The document provides an overview of Six Sigma, including:
1) It defines Six Sigma as a methodology for continuous improvement and creating high quality products and processes using statistical tools.
2) It discusses the origins and growth of Six Sigma at Motorola and GE in the 1980s-1990s.
3) It describes the DMAIC methodology used for process improvement projects and the roles of Master Black Belts, Black Belts, and Green Belts in a Six Sigma organization.
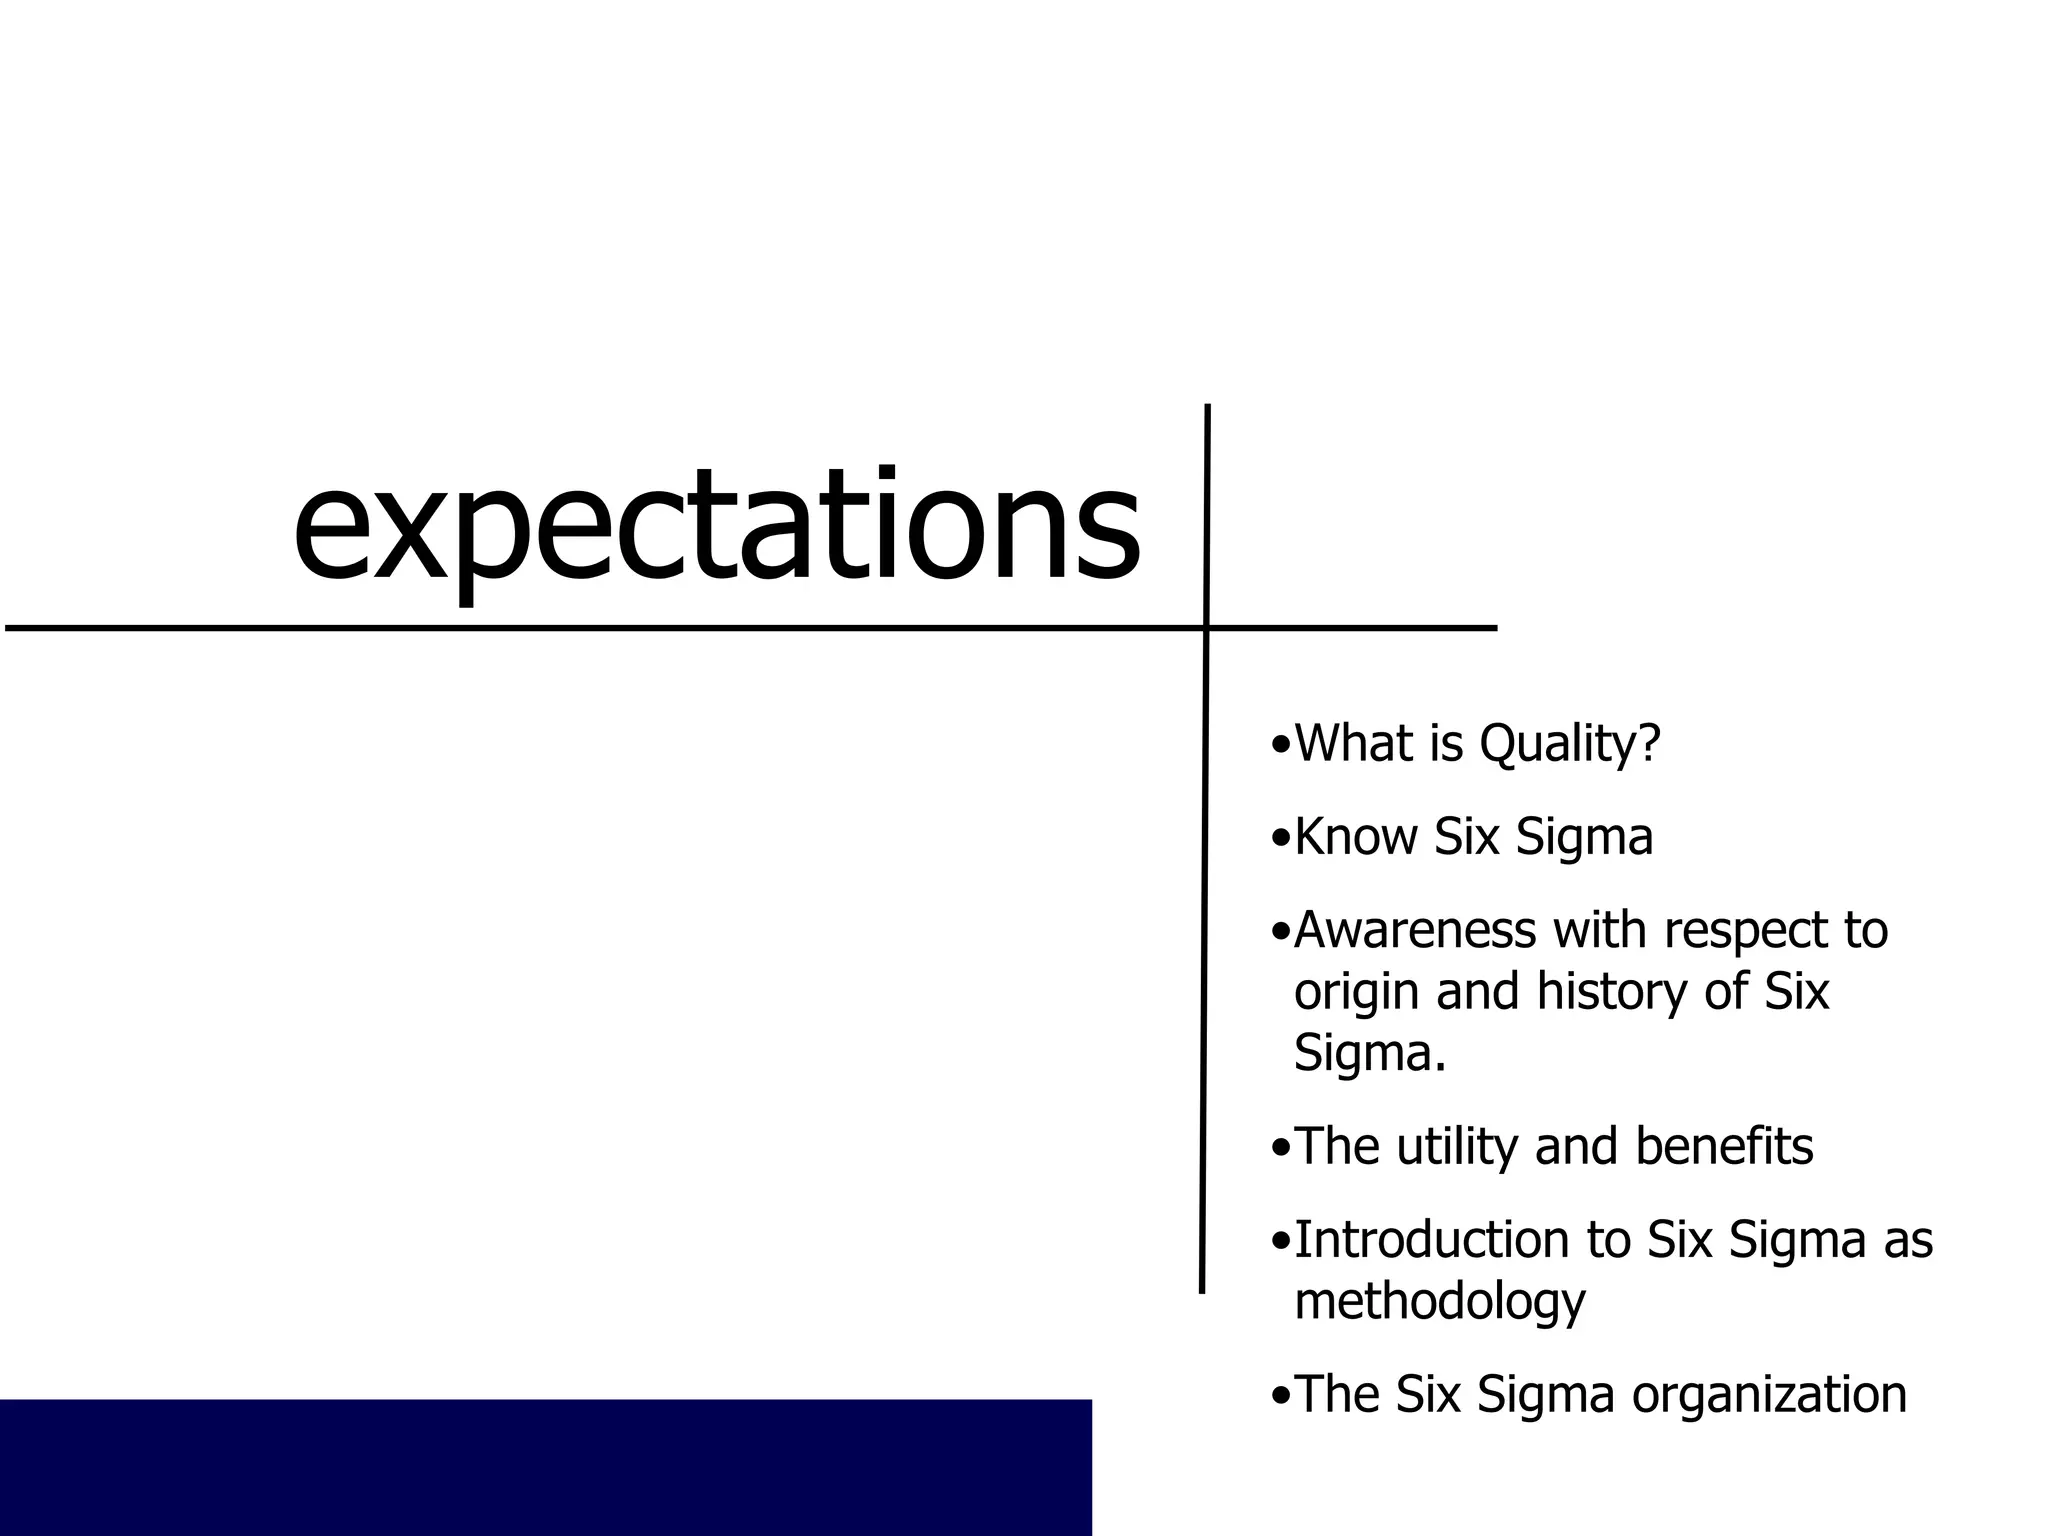
expectations What isQuality? Know Six Sigma Awareness with respect to origin and history of Six Sigma. The utility and benefits Introduction to Six Sigma as methodology The Six Sigma organization
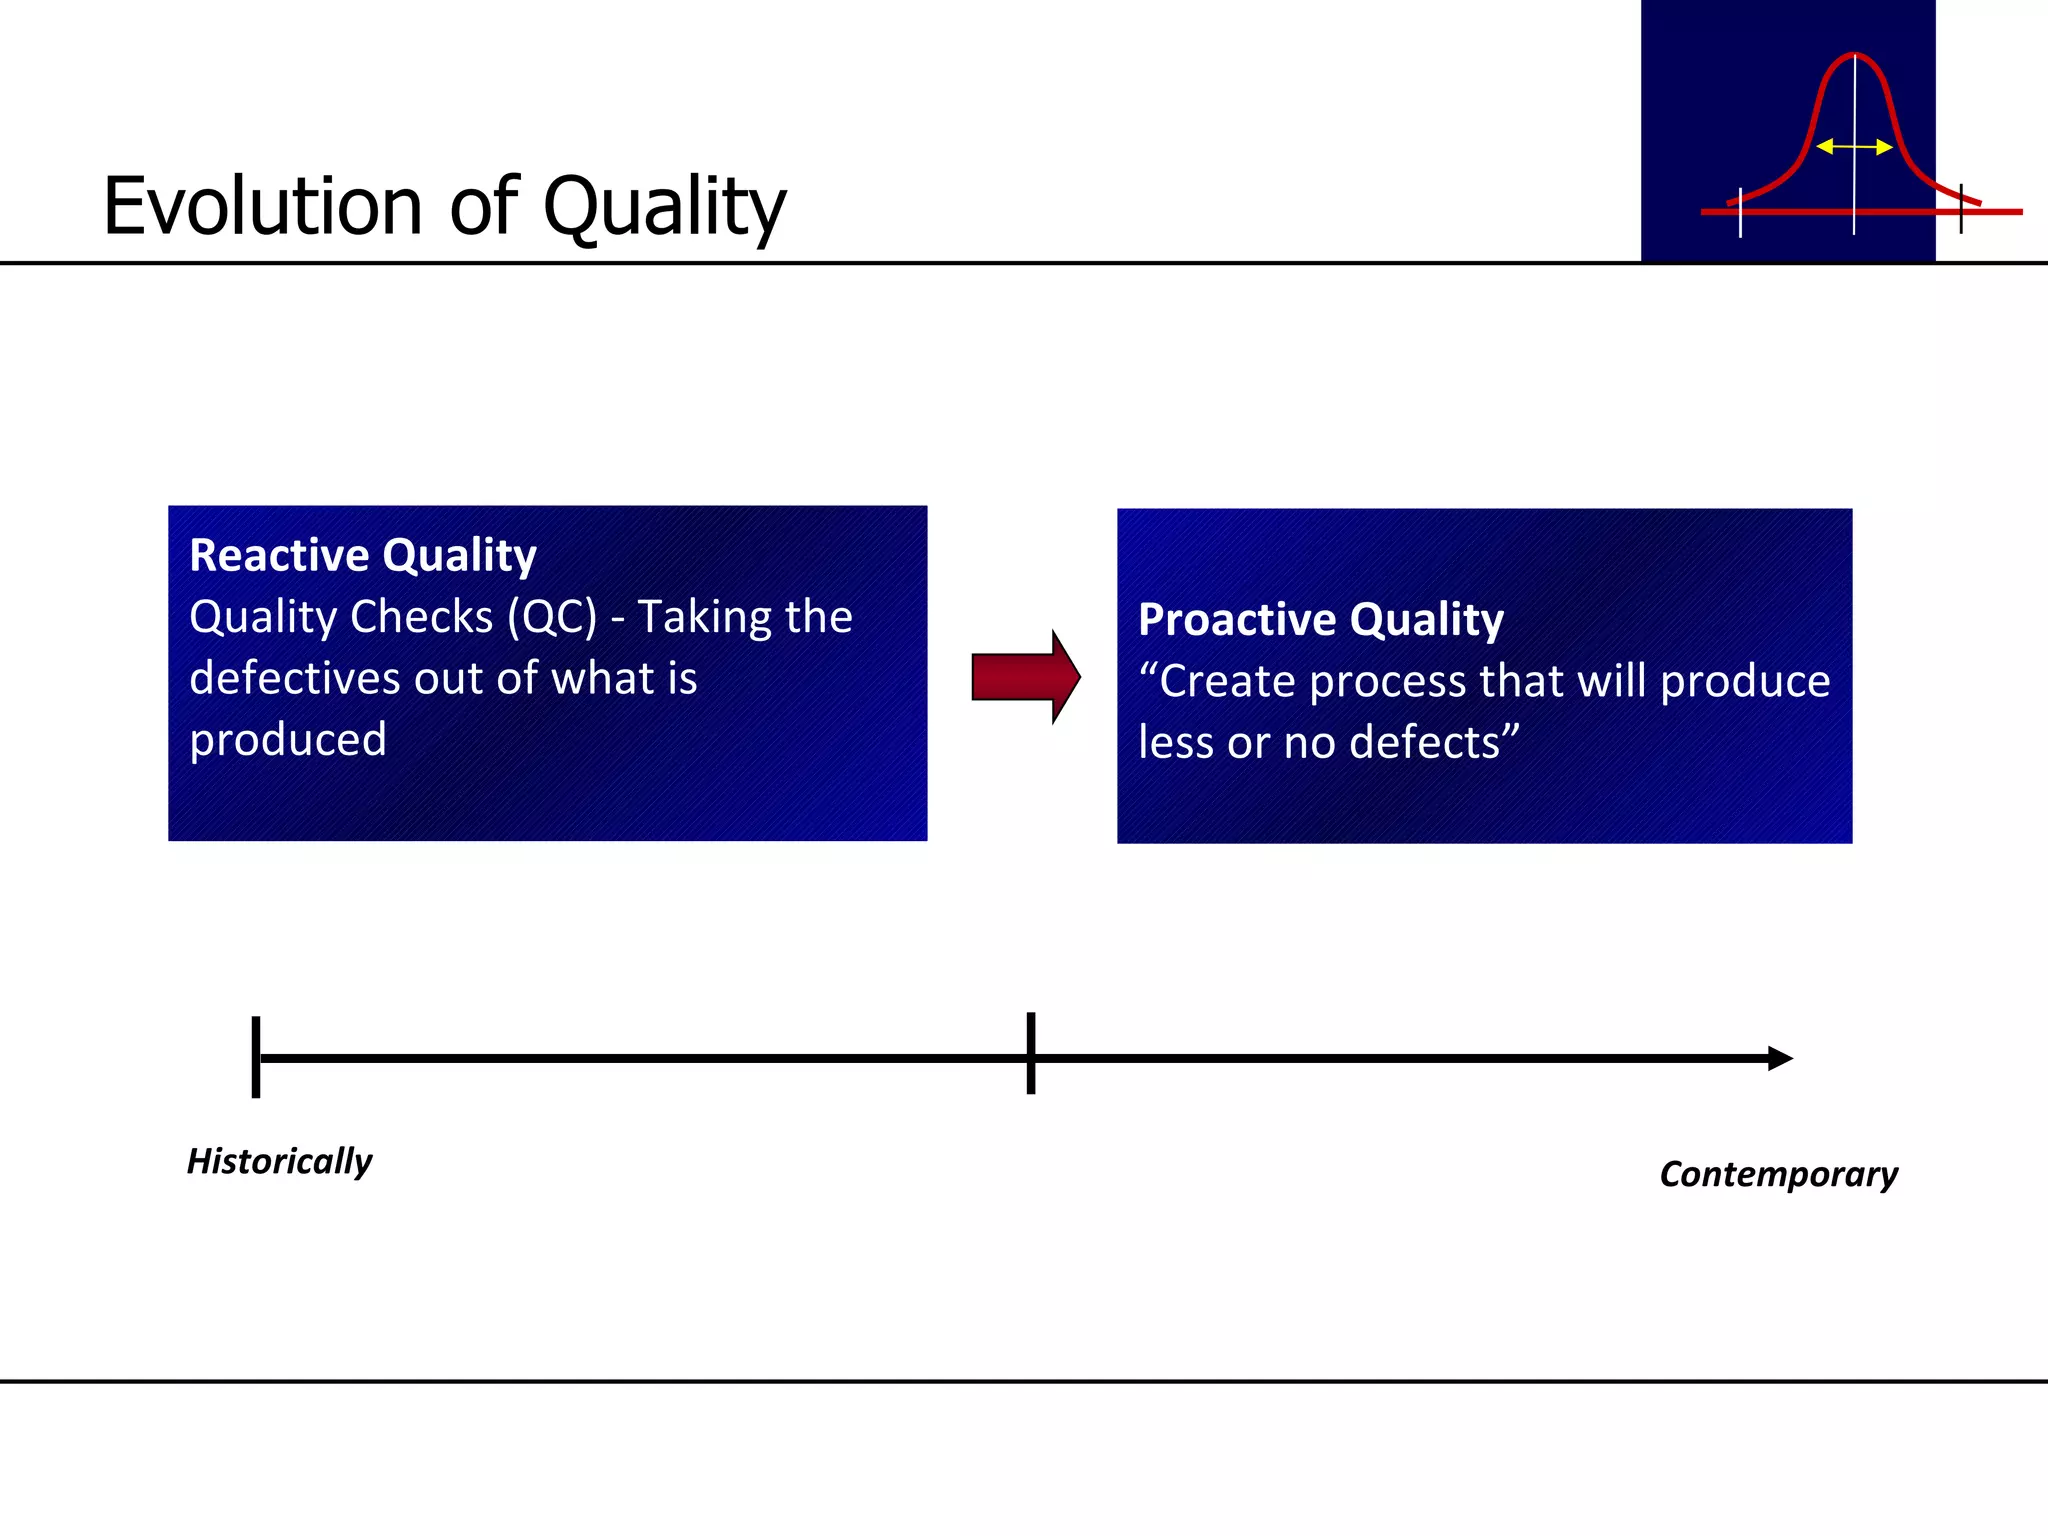
Evolution of QualityHistorically Proactive Quality “ Create process that will produce less or no defects” Contemporary Reactive Quality Quality Checks (QC) - Taking the defectives out of what is produced
5.
What is SixSigma? It is a methodology for continuous improvement It is a methodology for creating products/ processes that perform at high standards It is a set of statistical and other quality tools arranged in unique way It is a way of knowing where you are and where you could be! It is a Quality Philosophy and a management technique Six Sigma is not: A standard A certification Another metric like percentage
6.
The term “sigma”is used to designate the distribution or spread about the mean (average) of any process or procedure. For a process, the sigma capability (z-value) is a metric that indicates how well that process is performing. The higher the sigma capability, the better. Sigma capability measures the capability of the process to produce defect-free outputs. A defect is anything that results in customer dissatisfaction. Two Meanings of Sigma
7.
The term “SixSigma” was coined by Bill Smith, an engineer with Motorola Late 1970s - Motorola started experimenting with problem solving through statistical analysis 1987 - Motorola officially launched it’s Six Sigma program Origin of Six Sigma Motorola the company that invented Six Sigma
8.
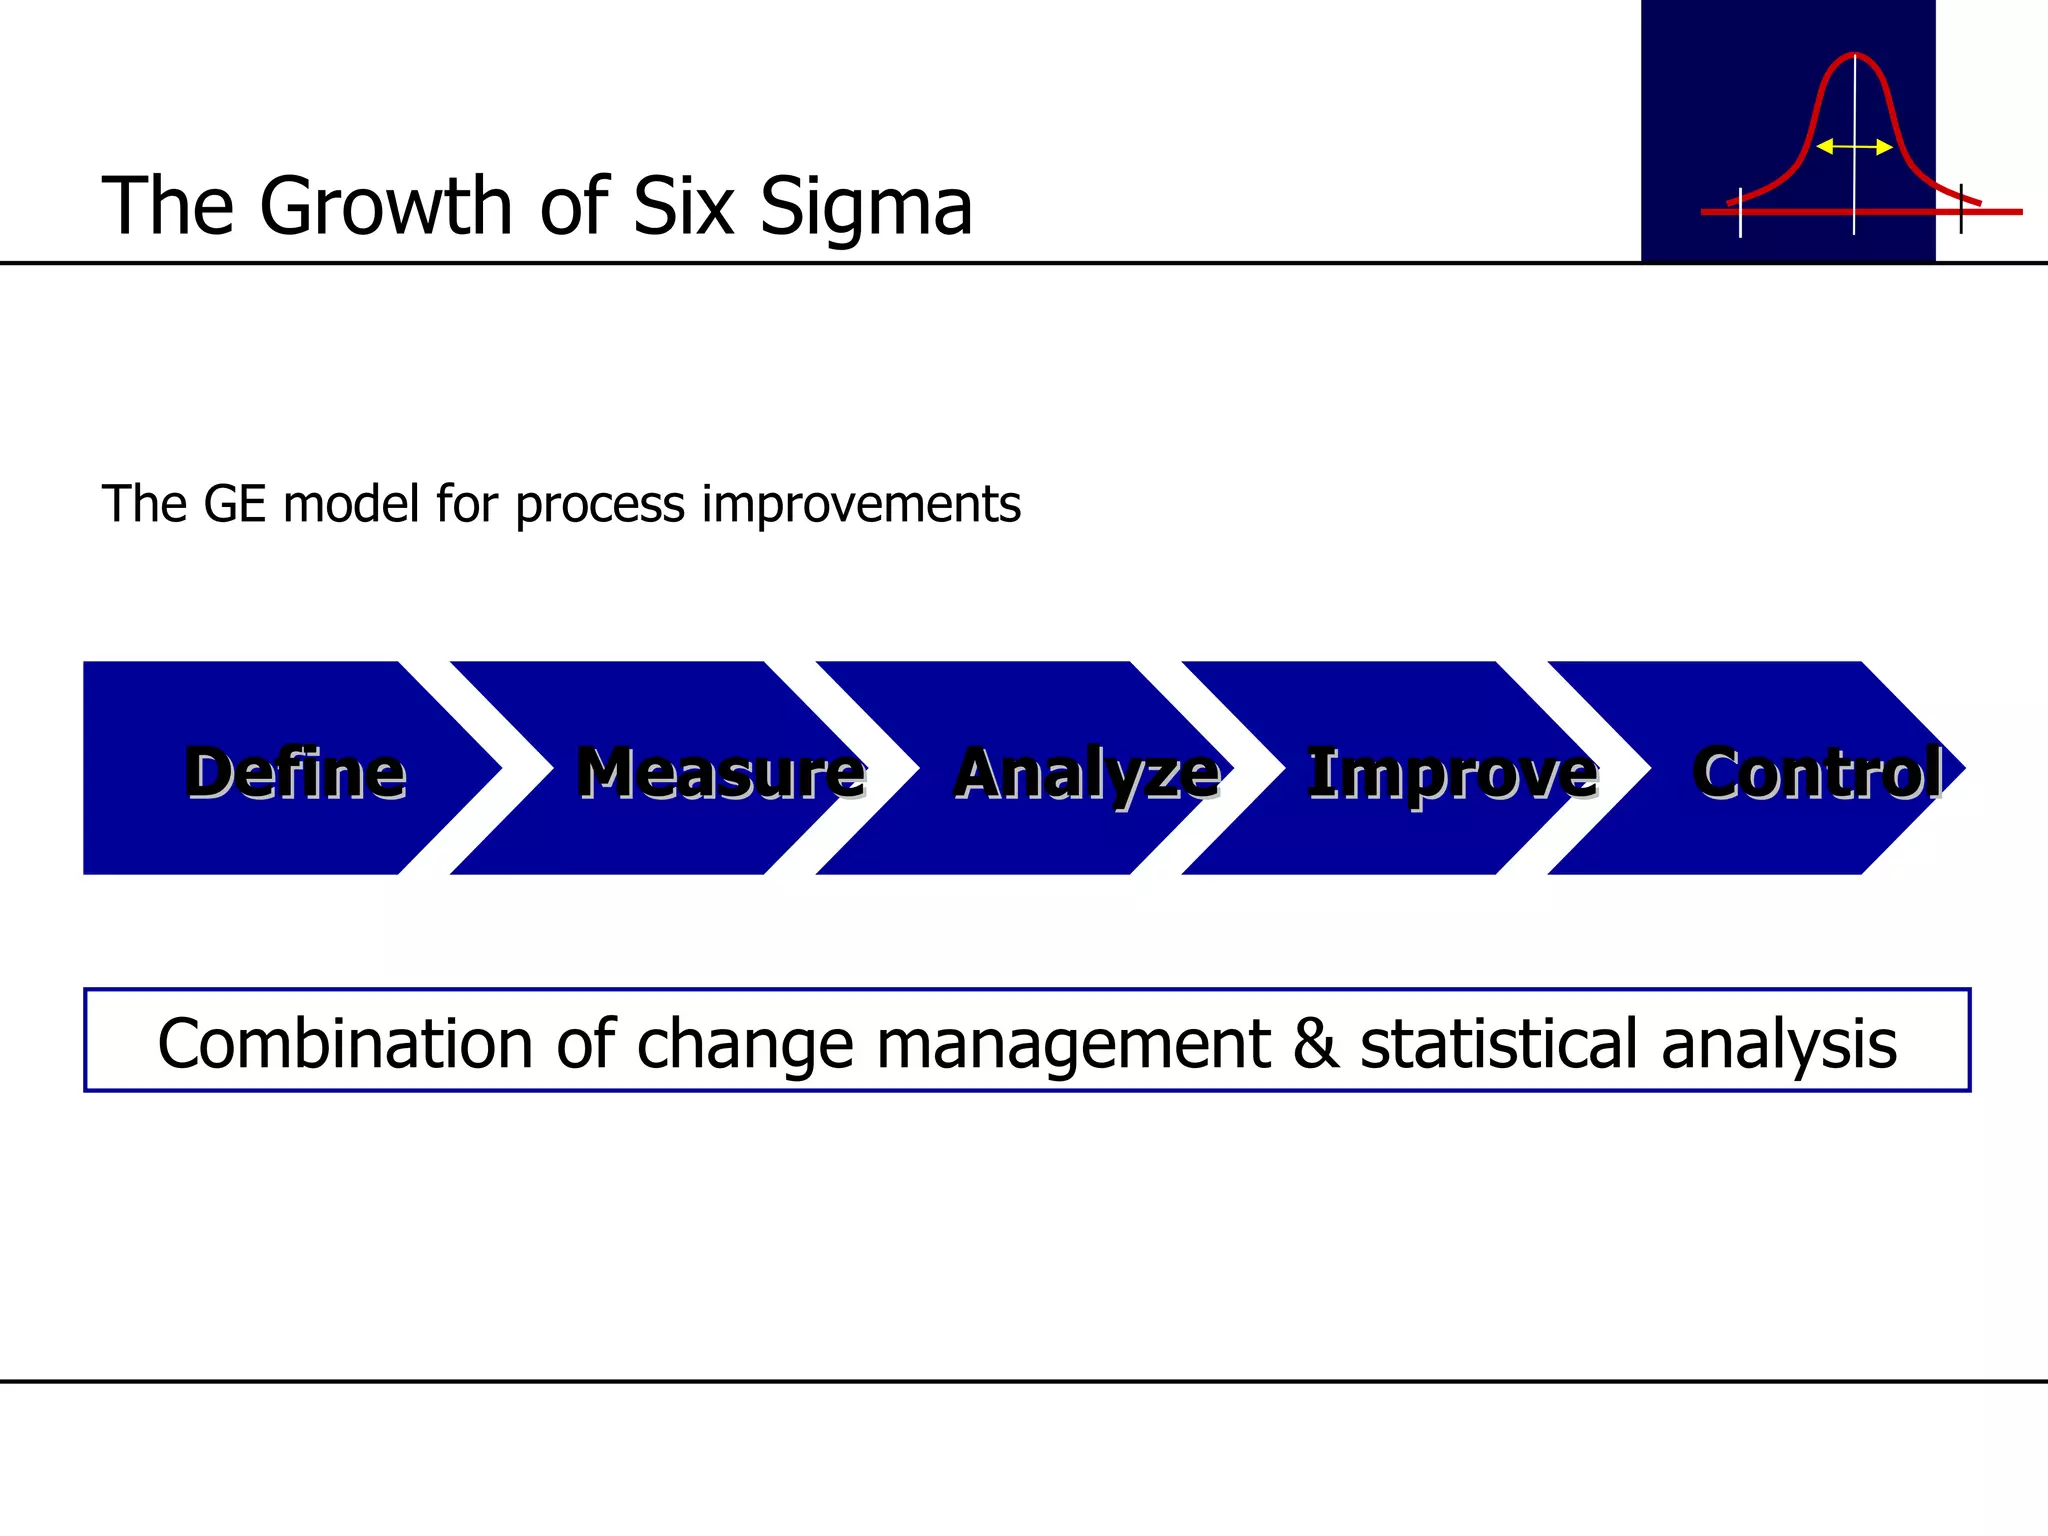
Jack Welch launchedSix Sigma at GE in Jan,1996 1998/99 - Green Belt exam certification became the criteria for management promotions 2002/03 - Green Belt certification became the criteria for promotion to management roles The Growth of Six Sigma GE the company that perfected Six Sigma
9.
The GE modelfor process improvements The Growth of Six Sigma Define Measure Analyze Improve Control Combination of change management & statistical analysis
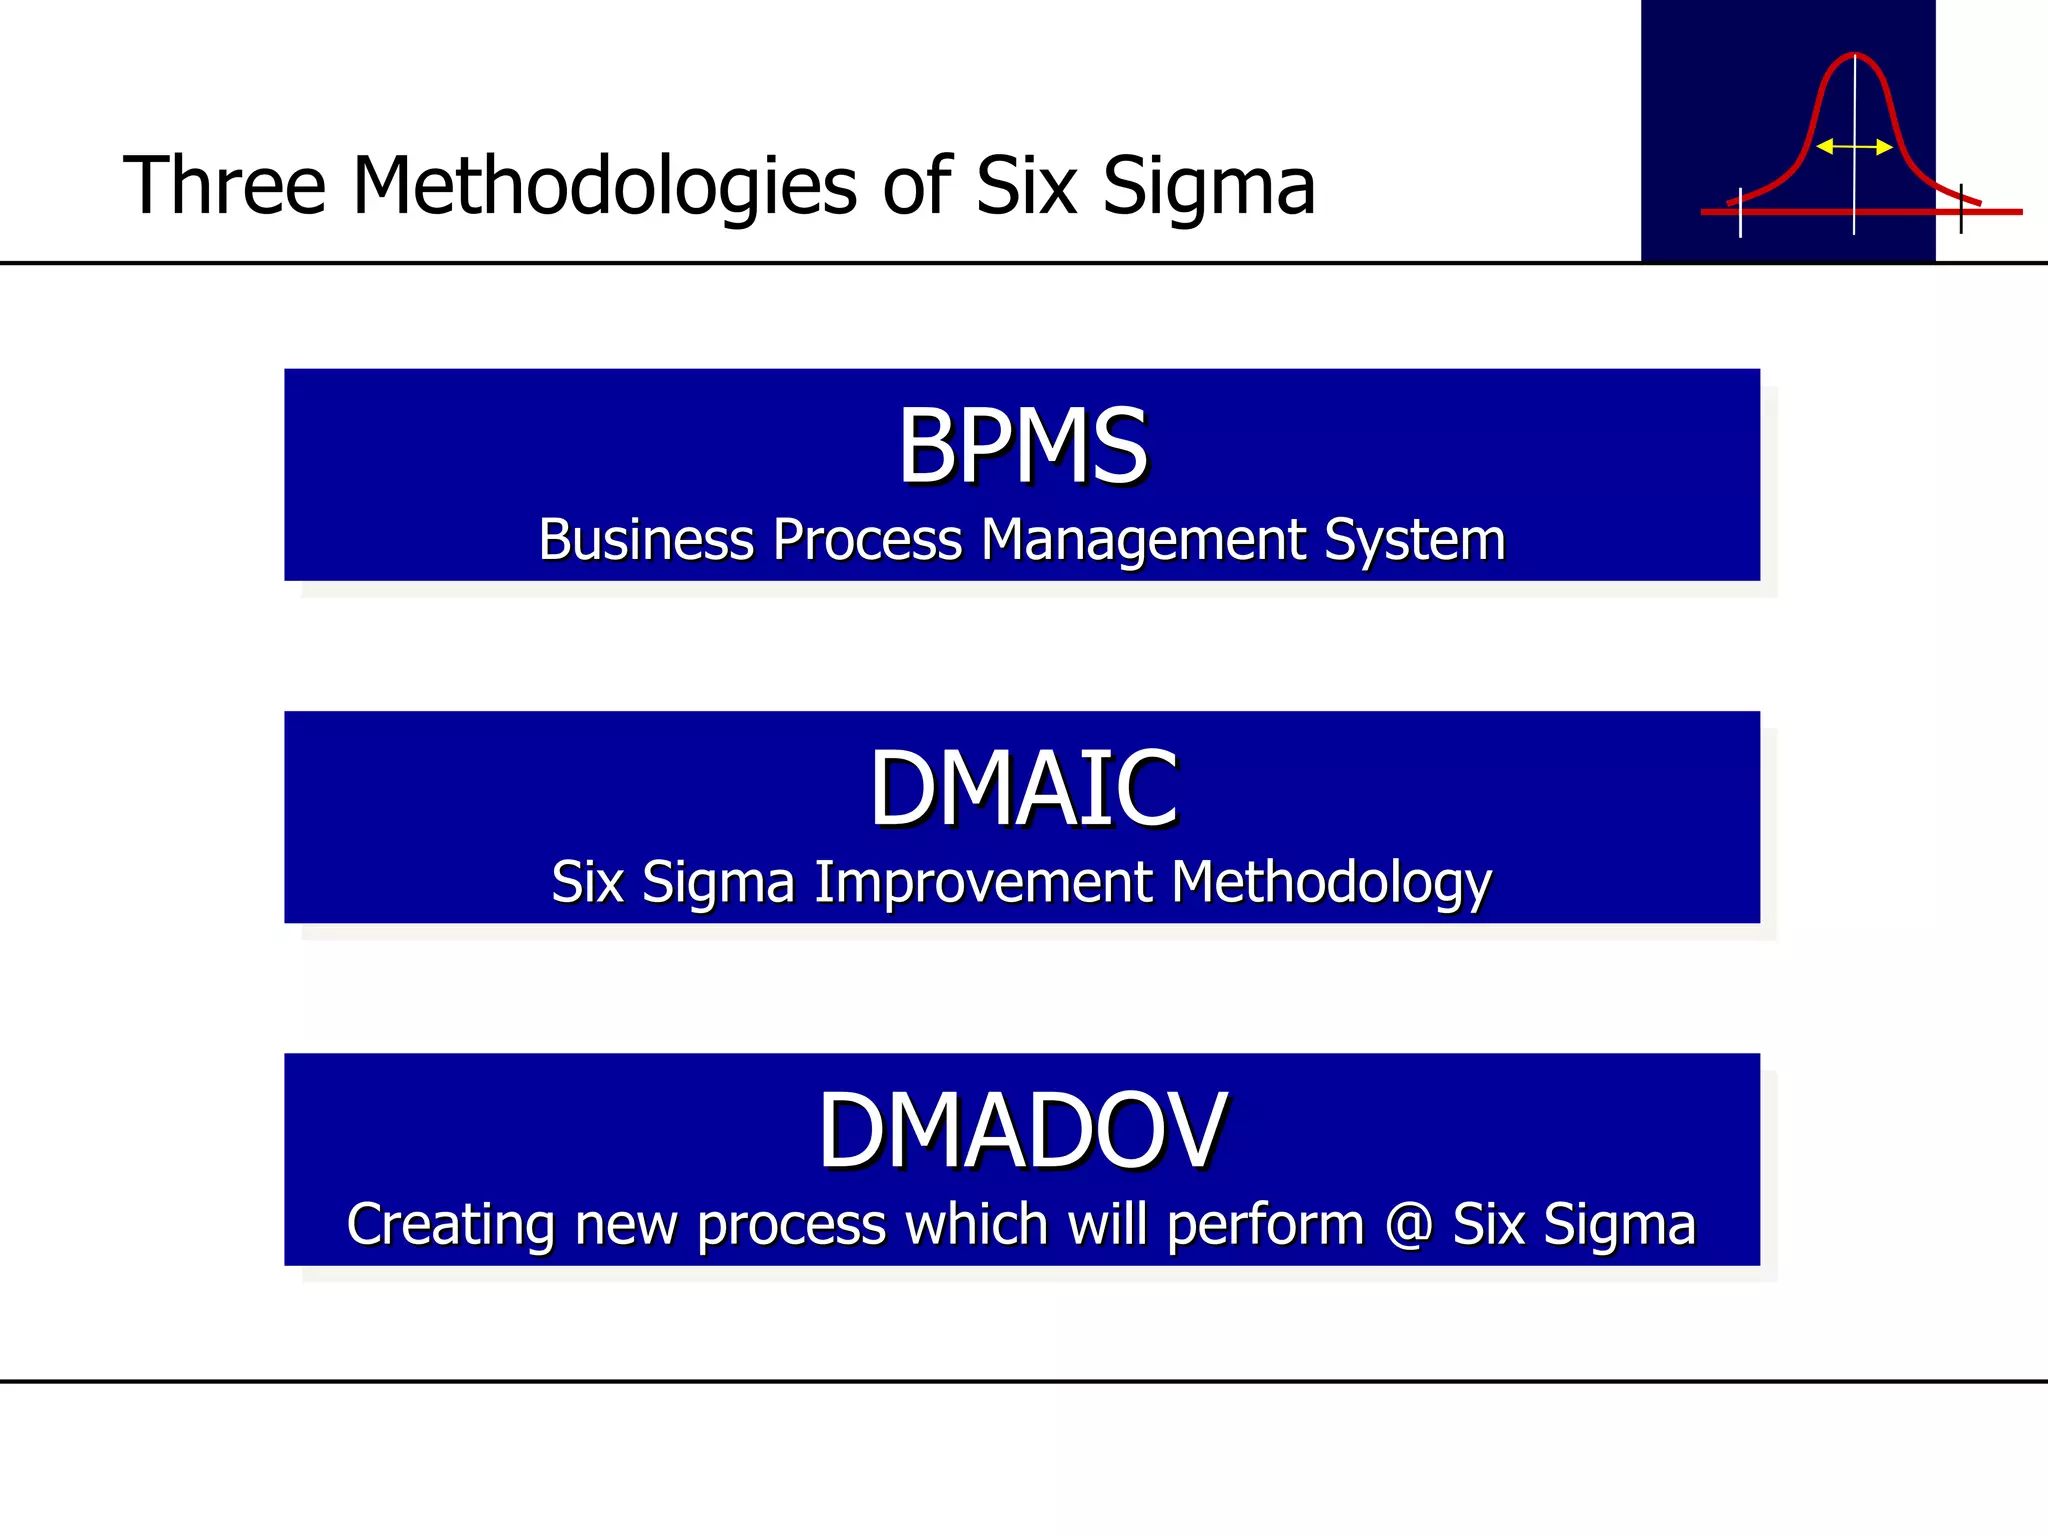
BPMS Business ProcessManagement System DMAIC Six Sigma Improvement Methodology DMADOV Creating new process which will perform @ Six Sigma Three Methodologies of Six Sigma
To understand theprocess; it’s mission, flow and scope To know the customers and their expectations To identify, monitor and improve correct performance measures for the process The Need of BPMS
14.
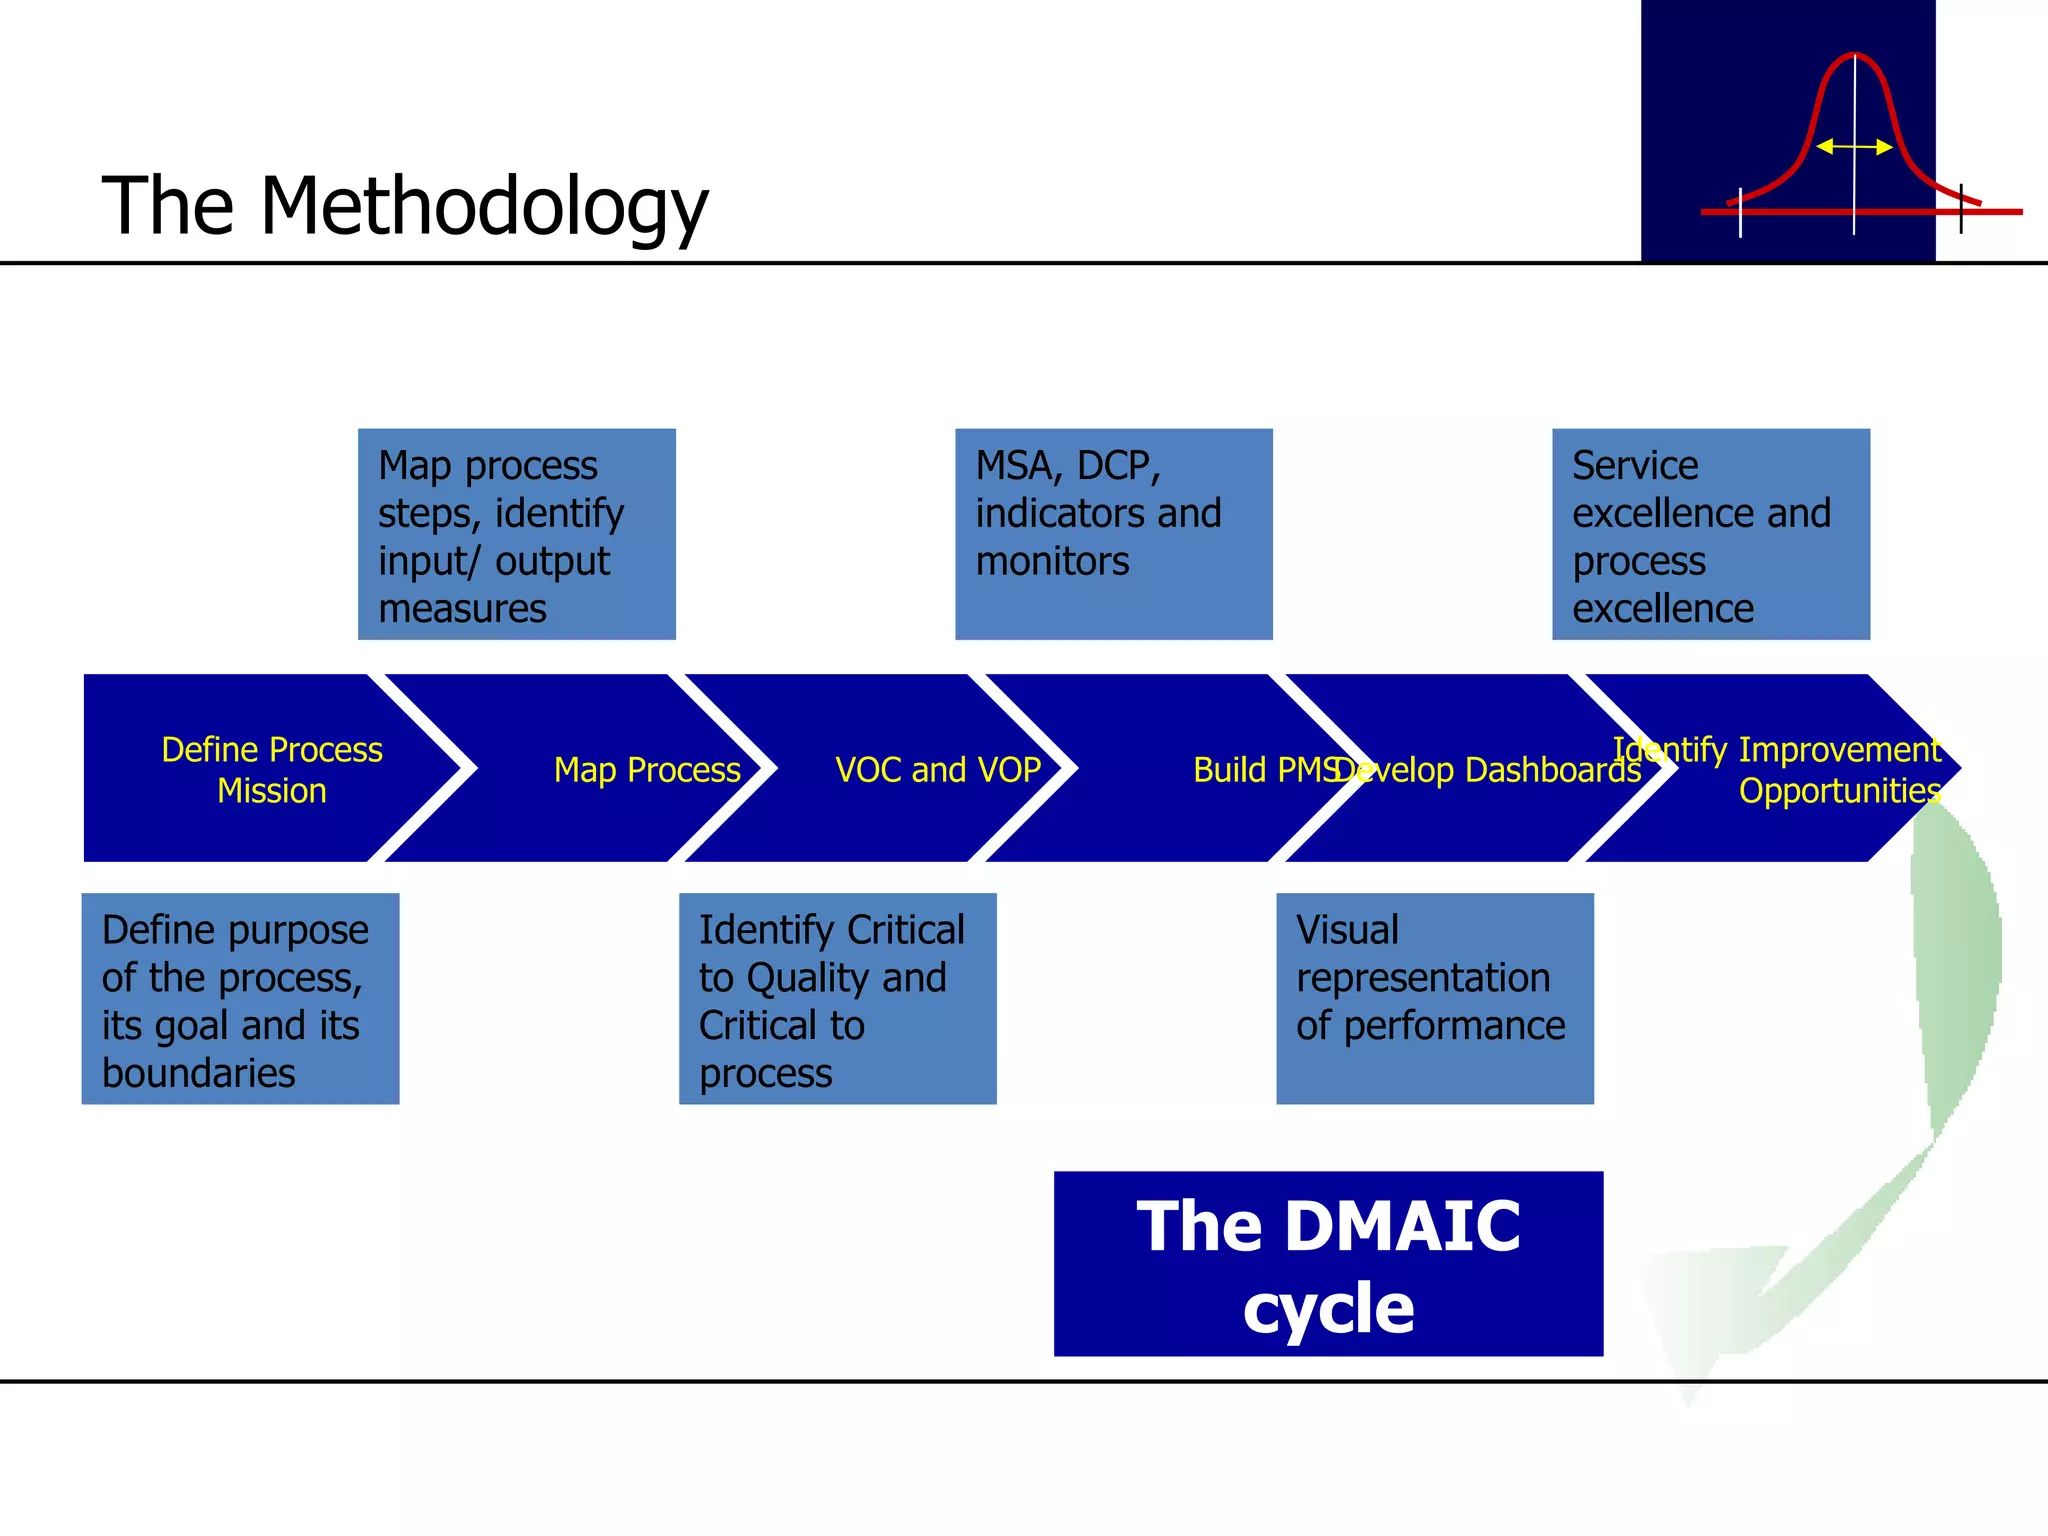
The Methodology Definepurpose of the process, its goal and its boundaries Identify Critical to Quality and Critical to process Visual representation of performance Map process steps, identify input/ output measures MSA, DCP, indicators and monitors Service excellence and process excellence The DMAIC cycle Define Process Mission Map Process VOC and VOP Build PMS Develop Dashboards Identify Improvement Opportunities
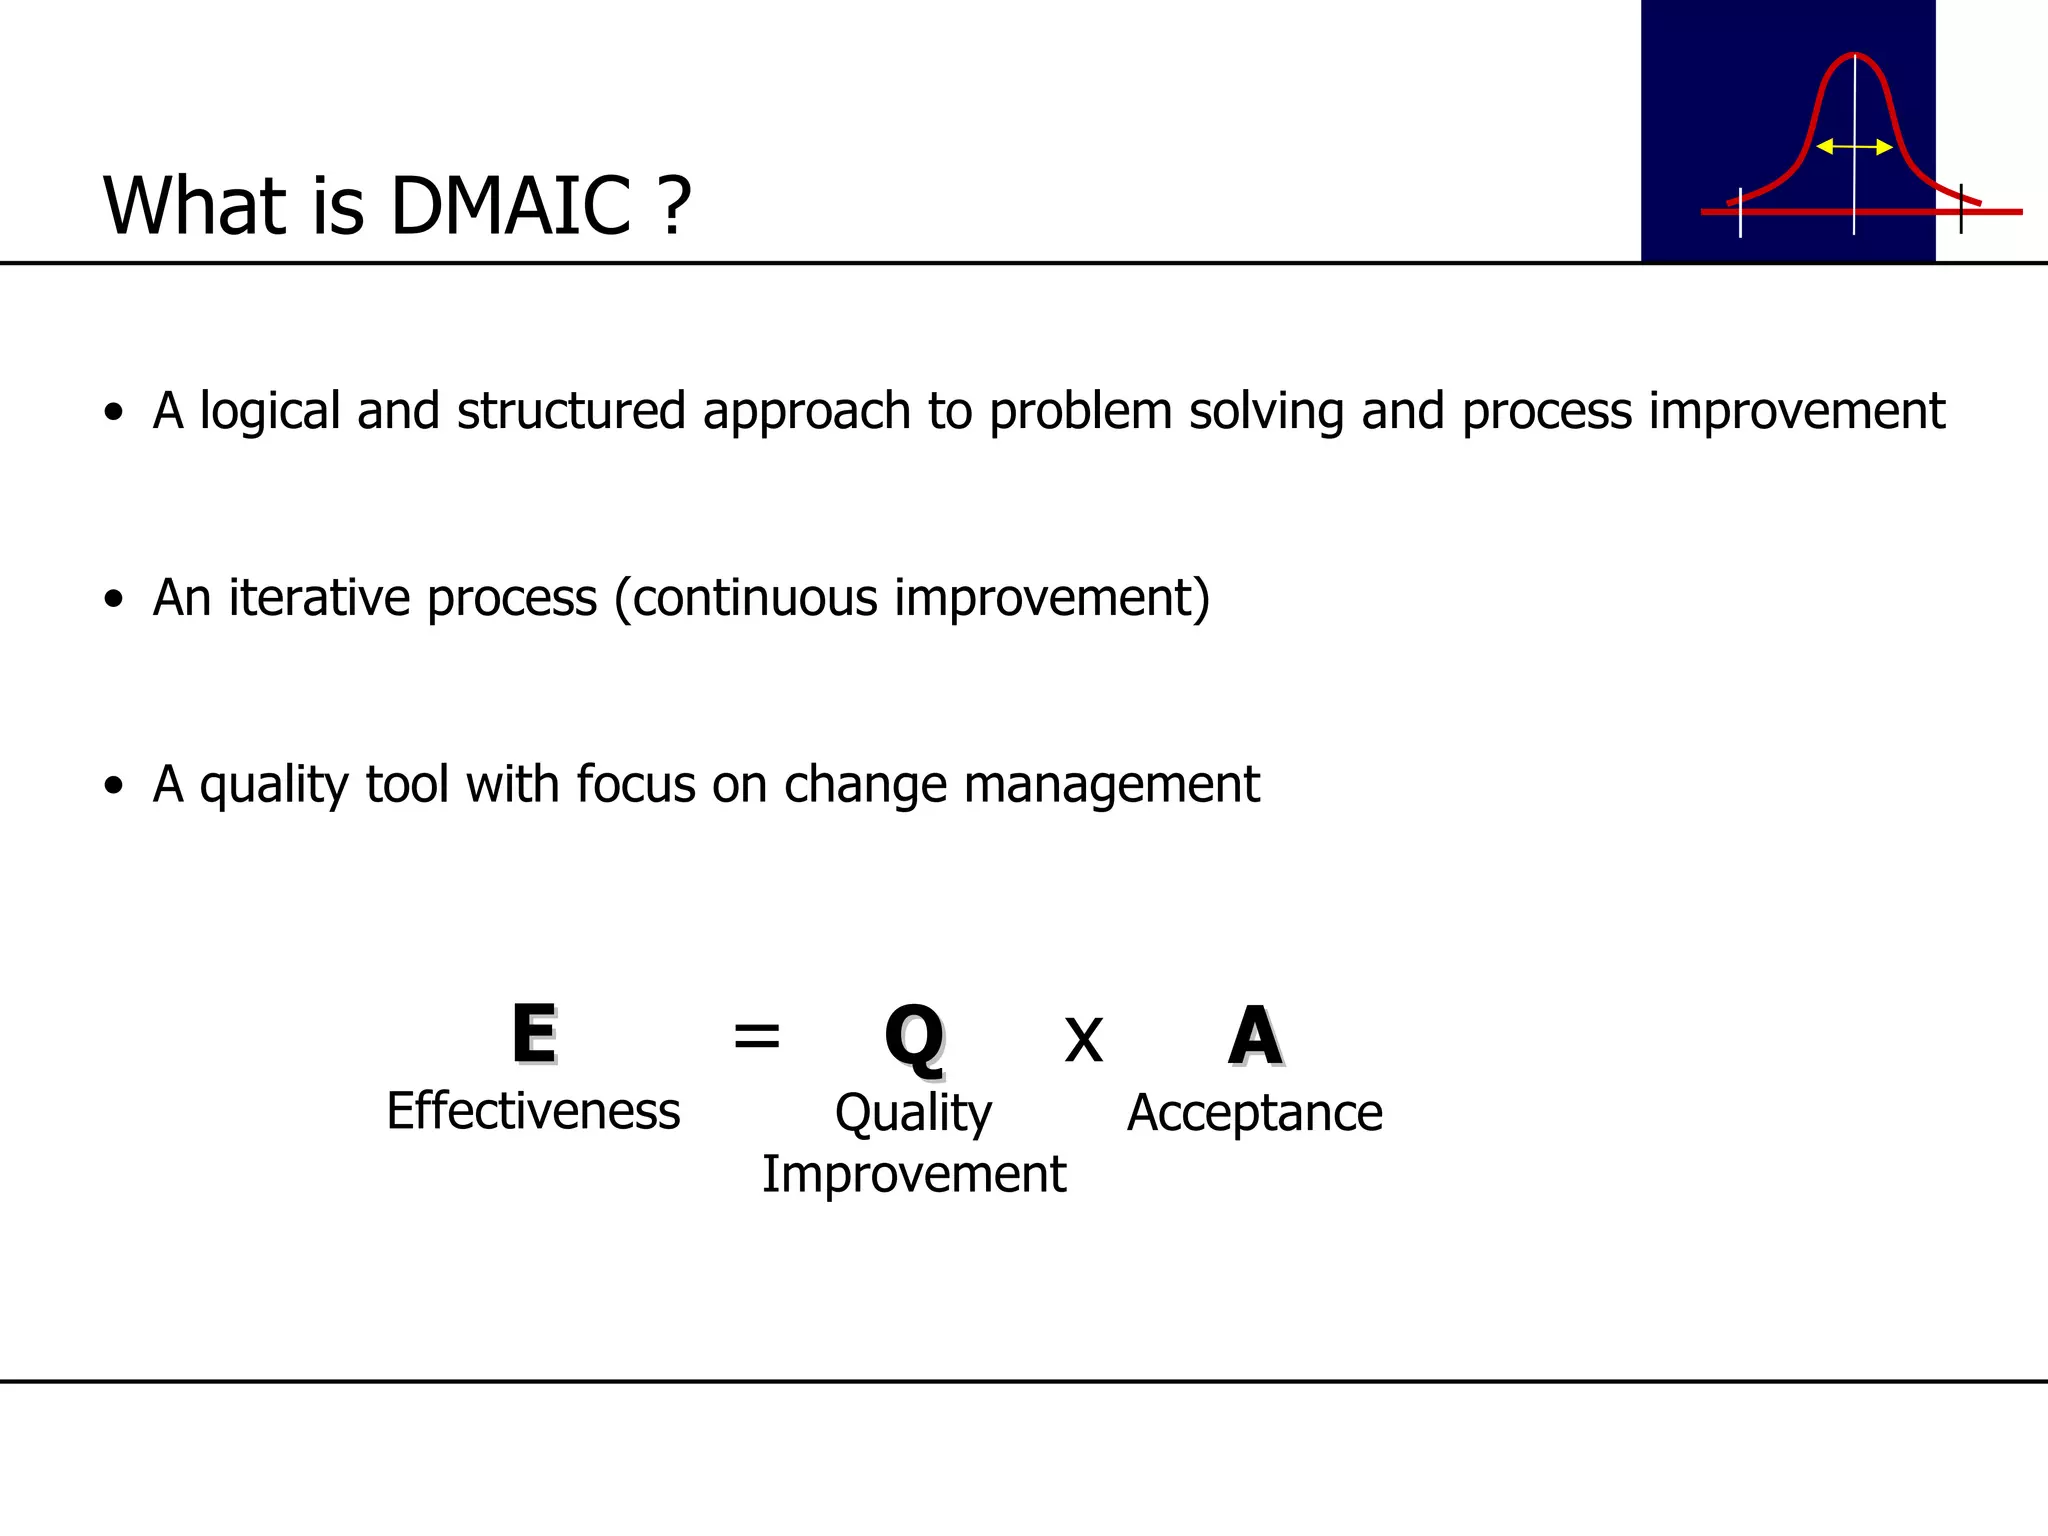
A logical andstructured approach to problem solving and process improvement An iterative process (continuous improvement) A quality tool with focus on change management What is DMAIC ? E Effectiveness = Q Quality Improvement x A Acceptance
17.
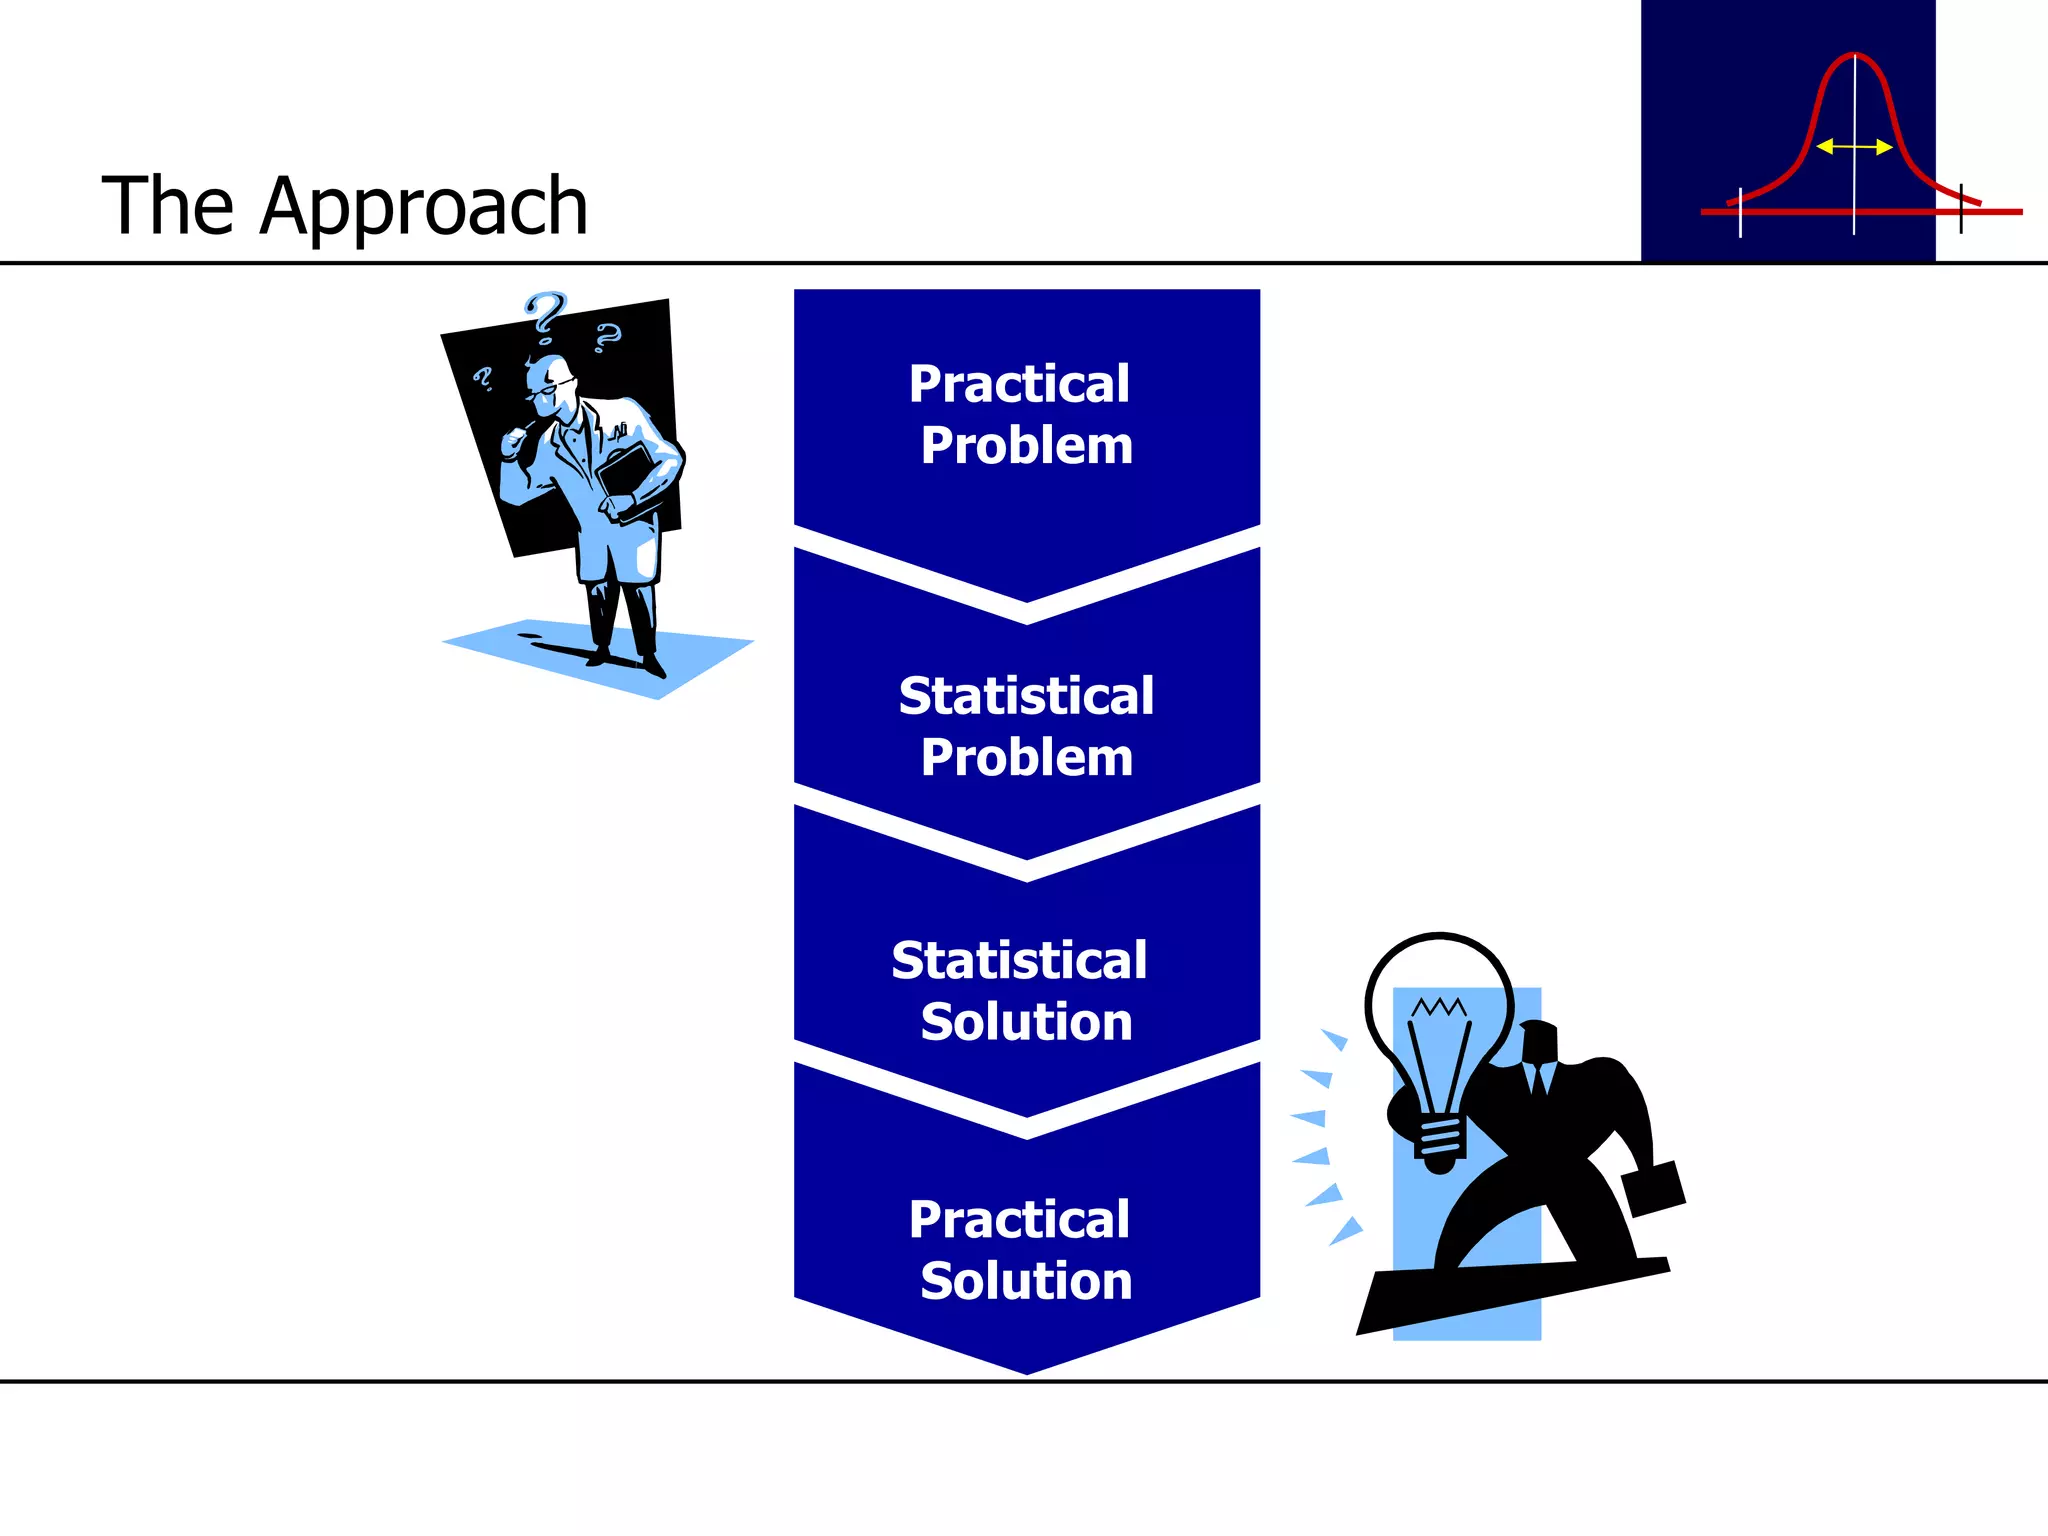
The Approach Practical Problem Statistical Problem Statistical Solution Practical Solution
18.
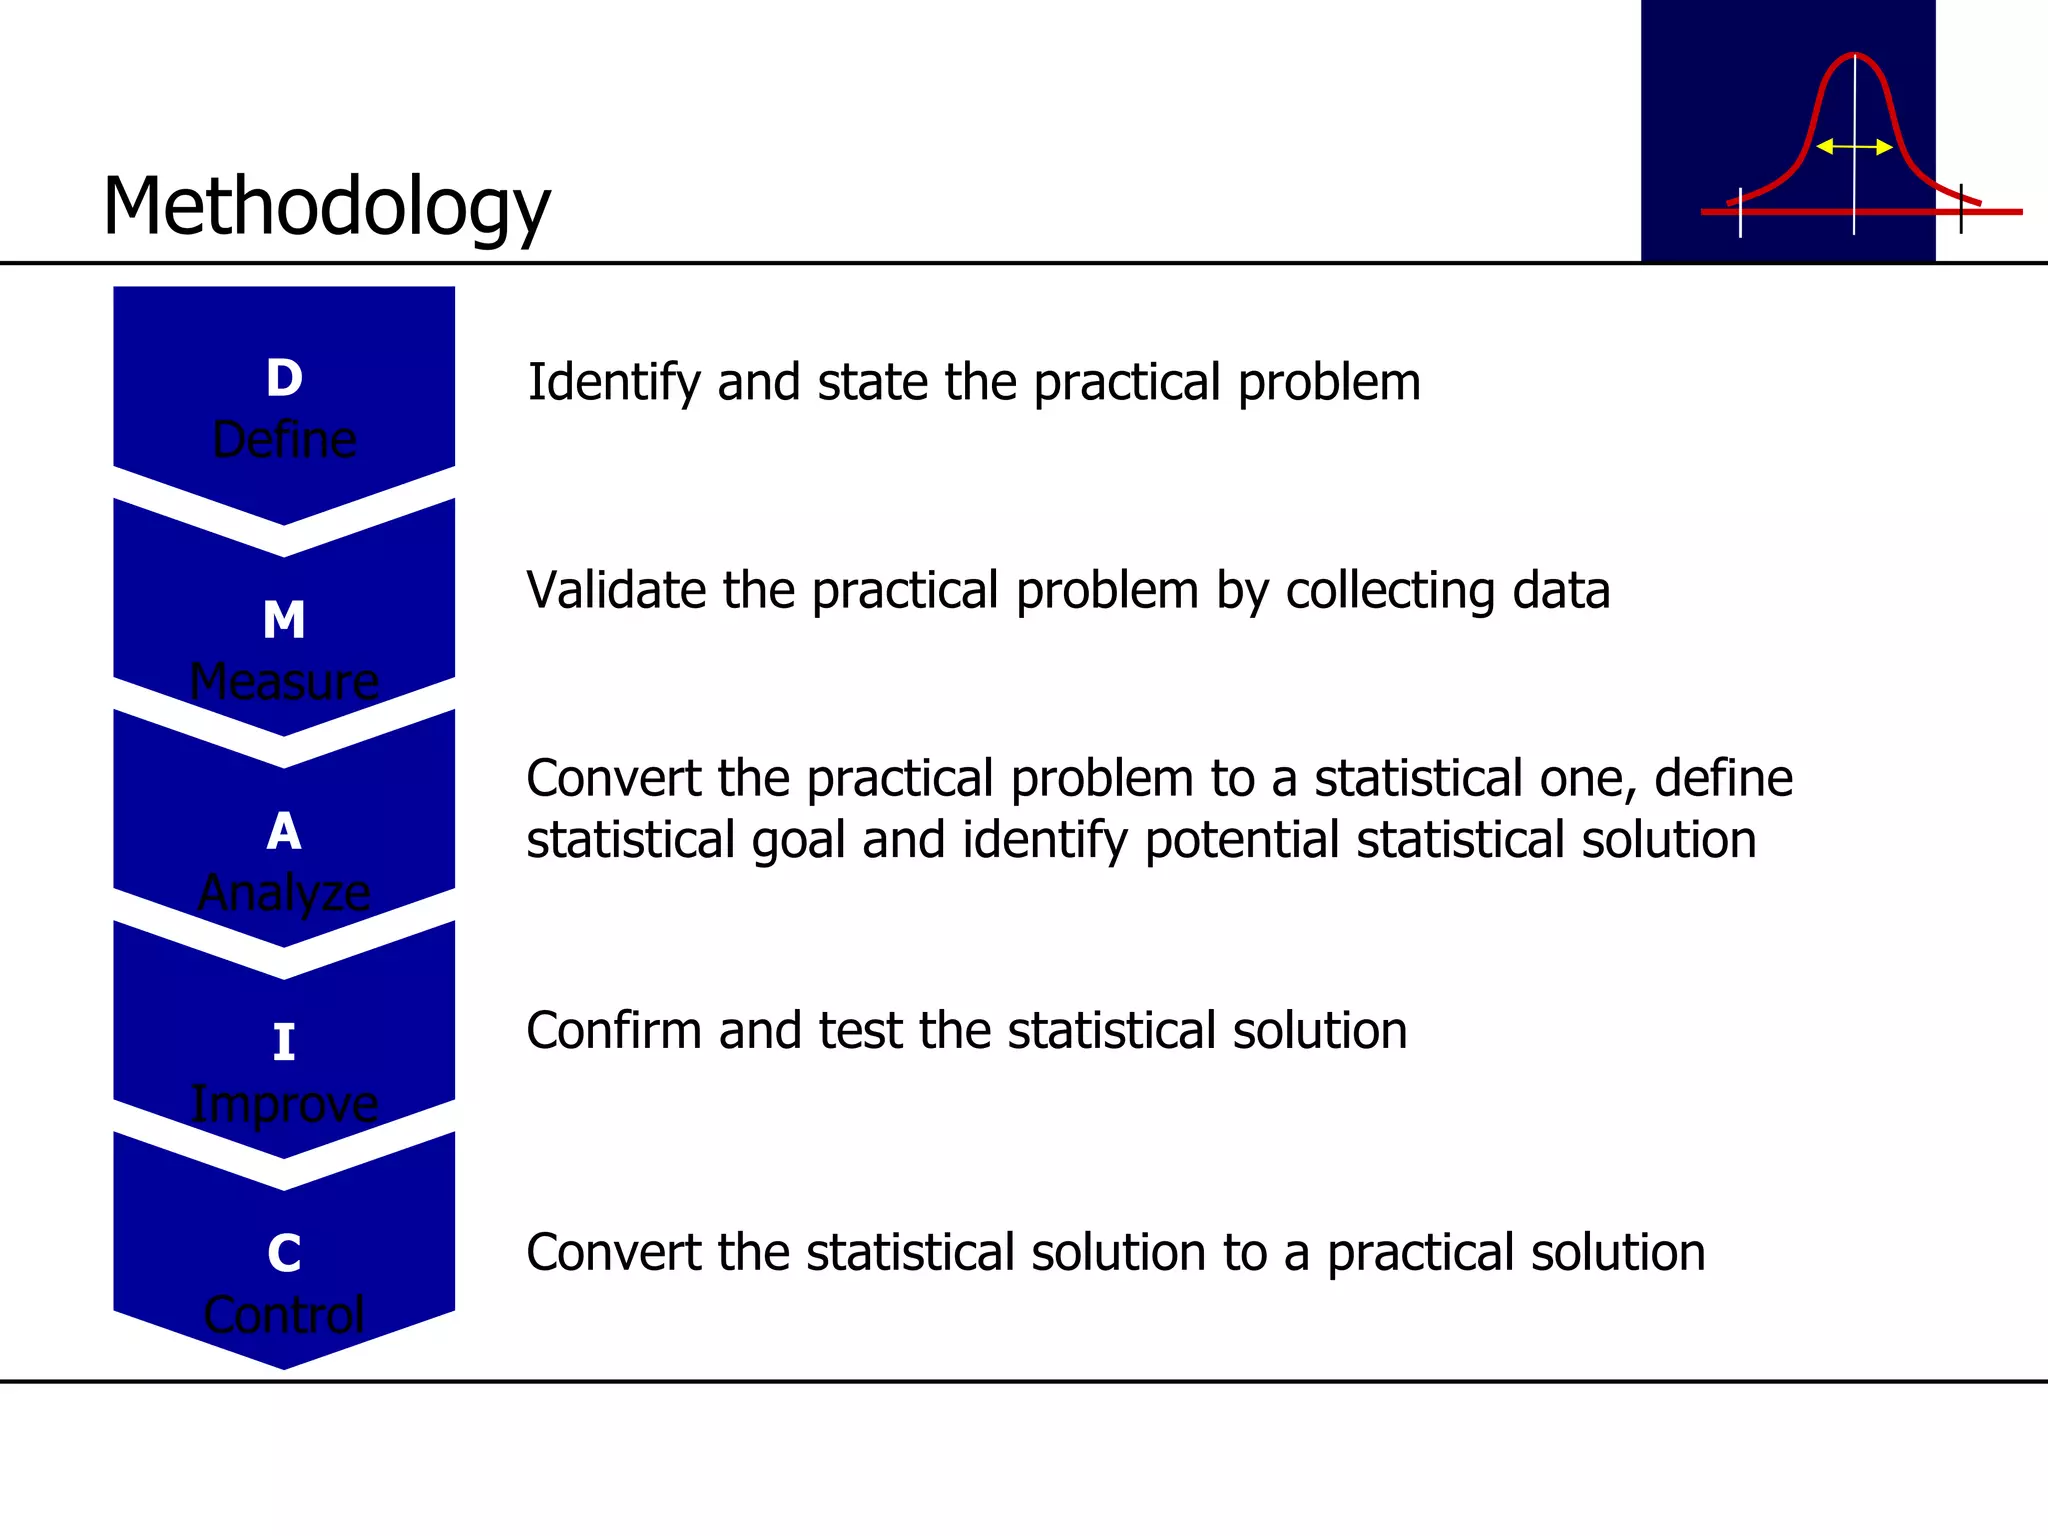
D Define MMeasure A Analyze I Improve C Control Identify and state the practical problem Validate the practical problem by collecting data Convert the practical problem to a statistical one, define statistical goal and identify potential statistical solution Confirm and test the statistical solution Convert the statistical solution to a practical solution Methodology
19.
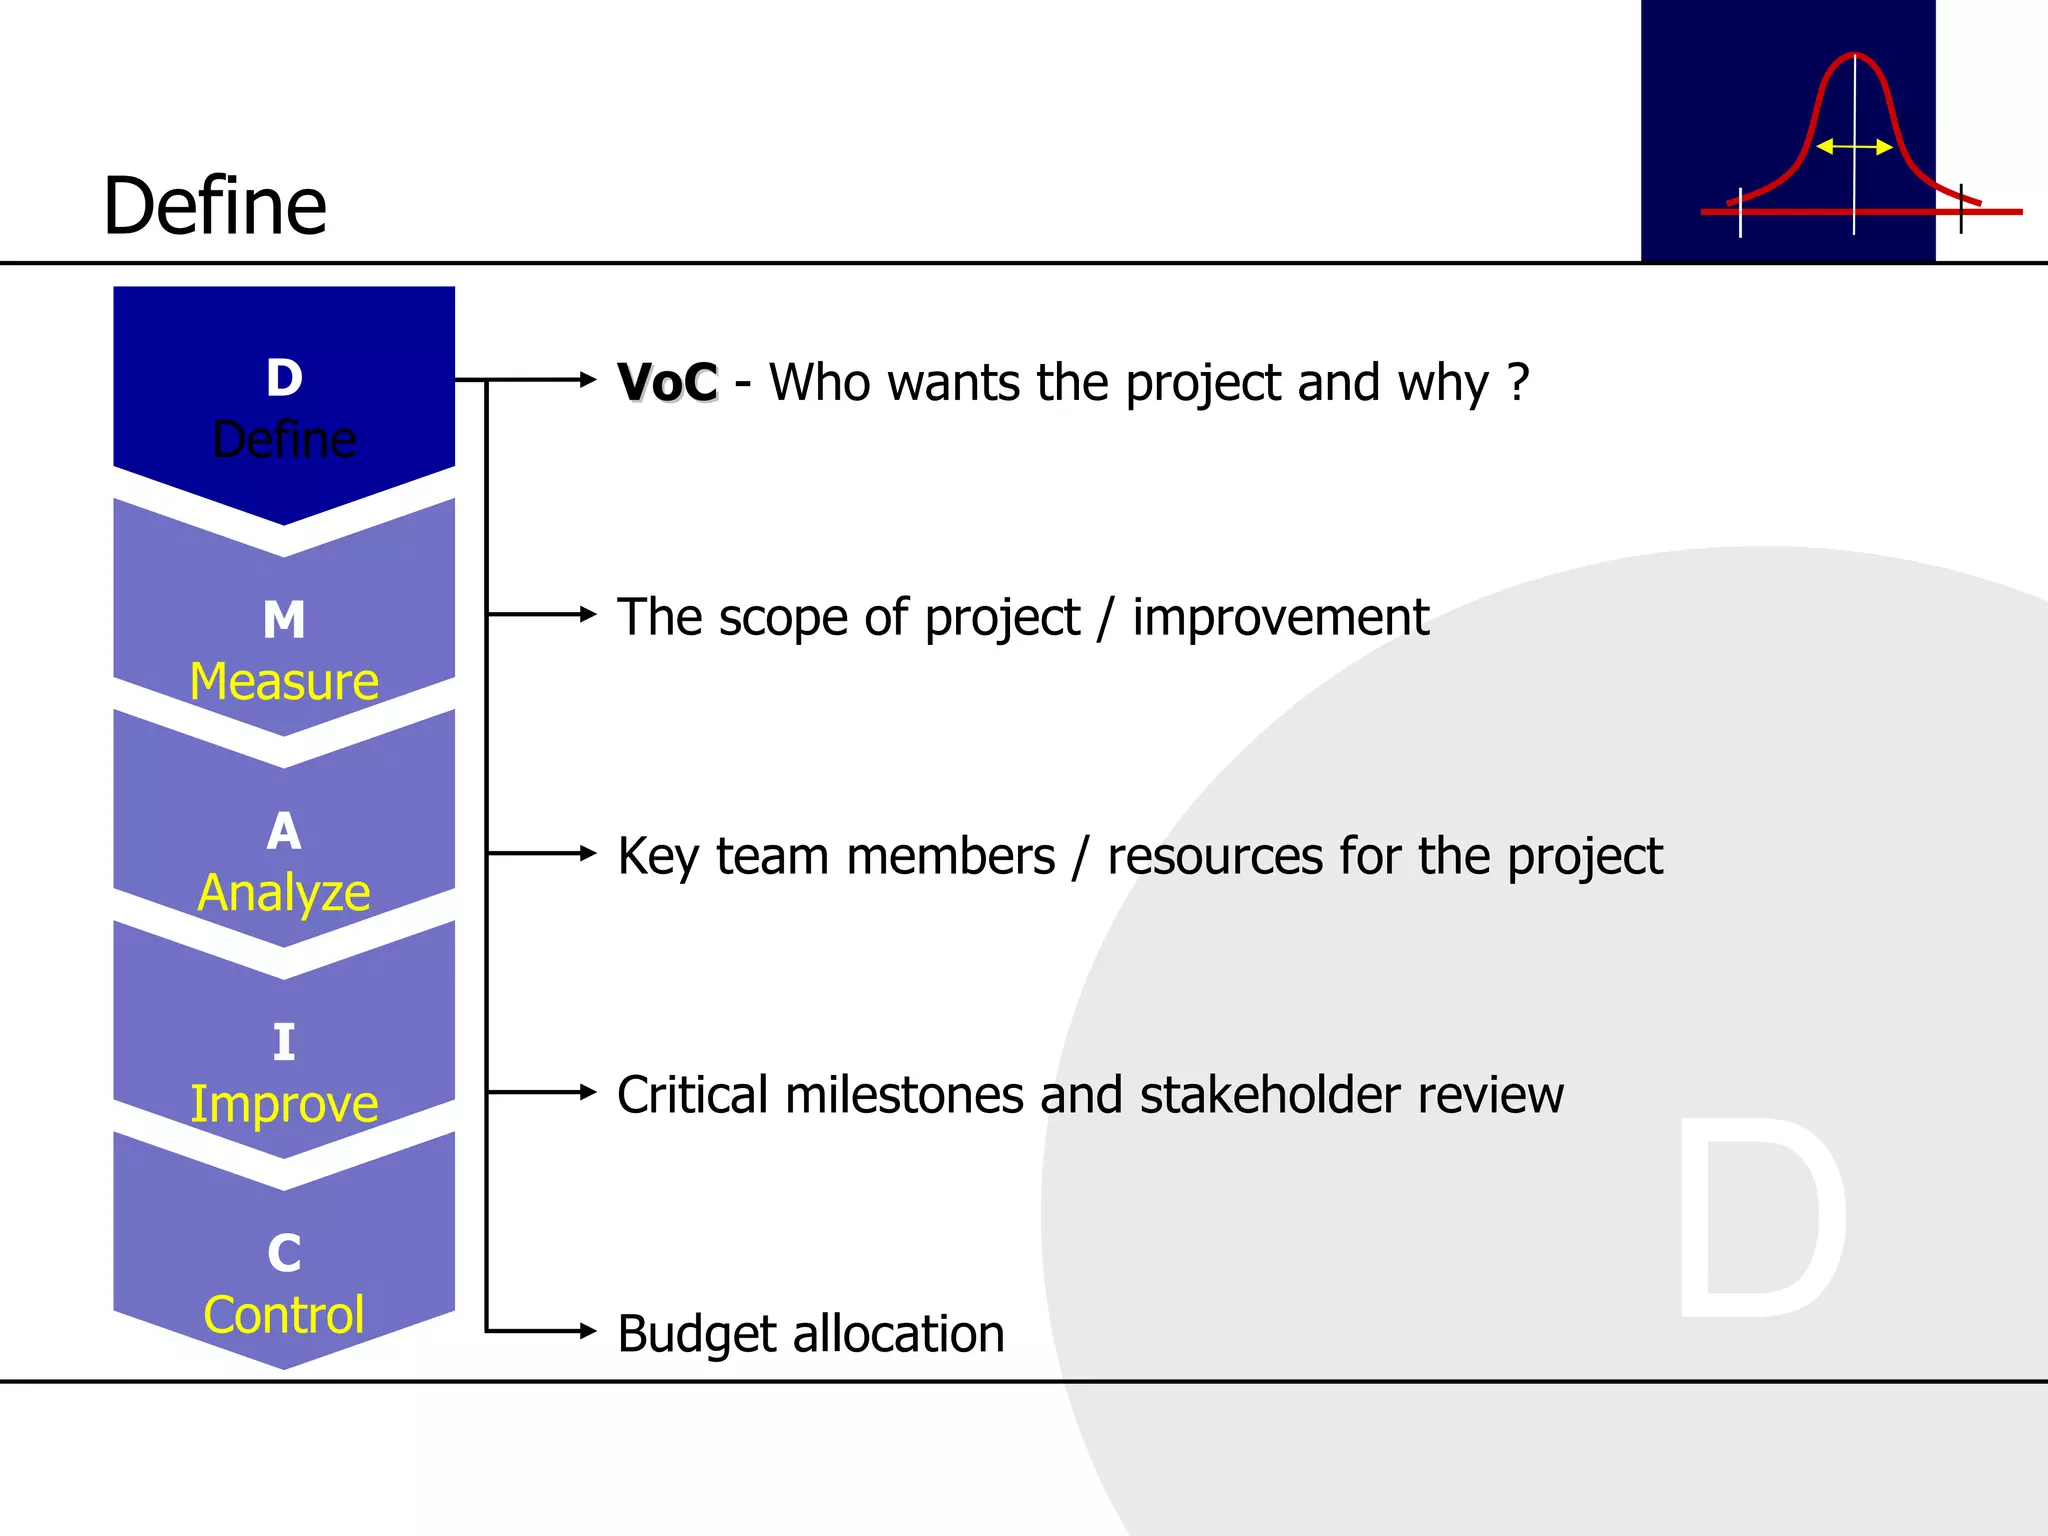
VoC -Who wants the project and why ? The scope of project / improvement Key team members / resources for the project Critical milestones and stakeholder review Budget allocation Define D Define M Measure A Analyze I Improve C Control
20.
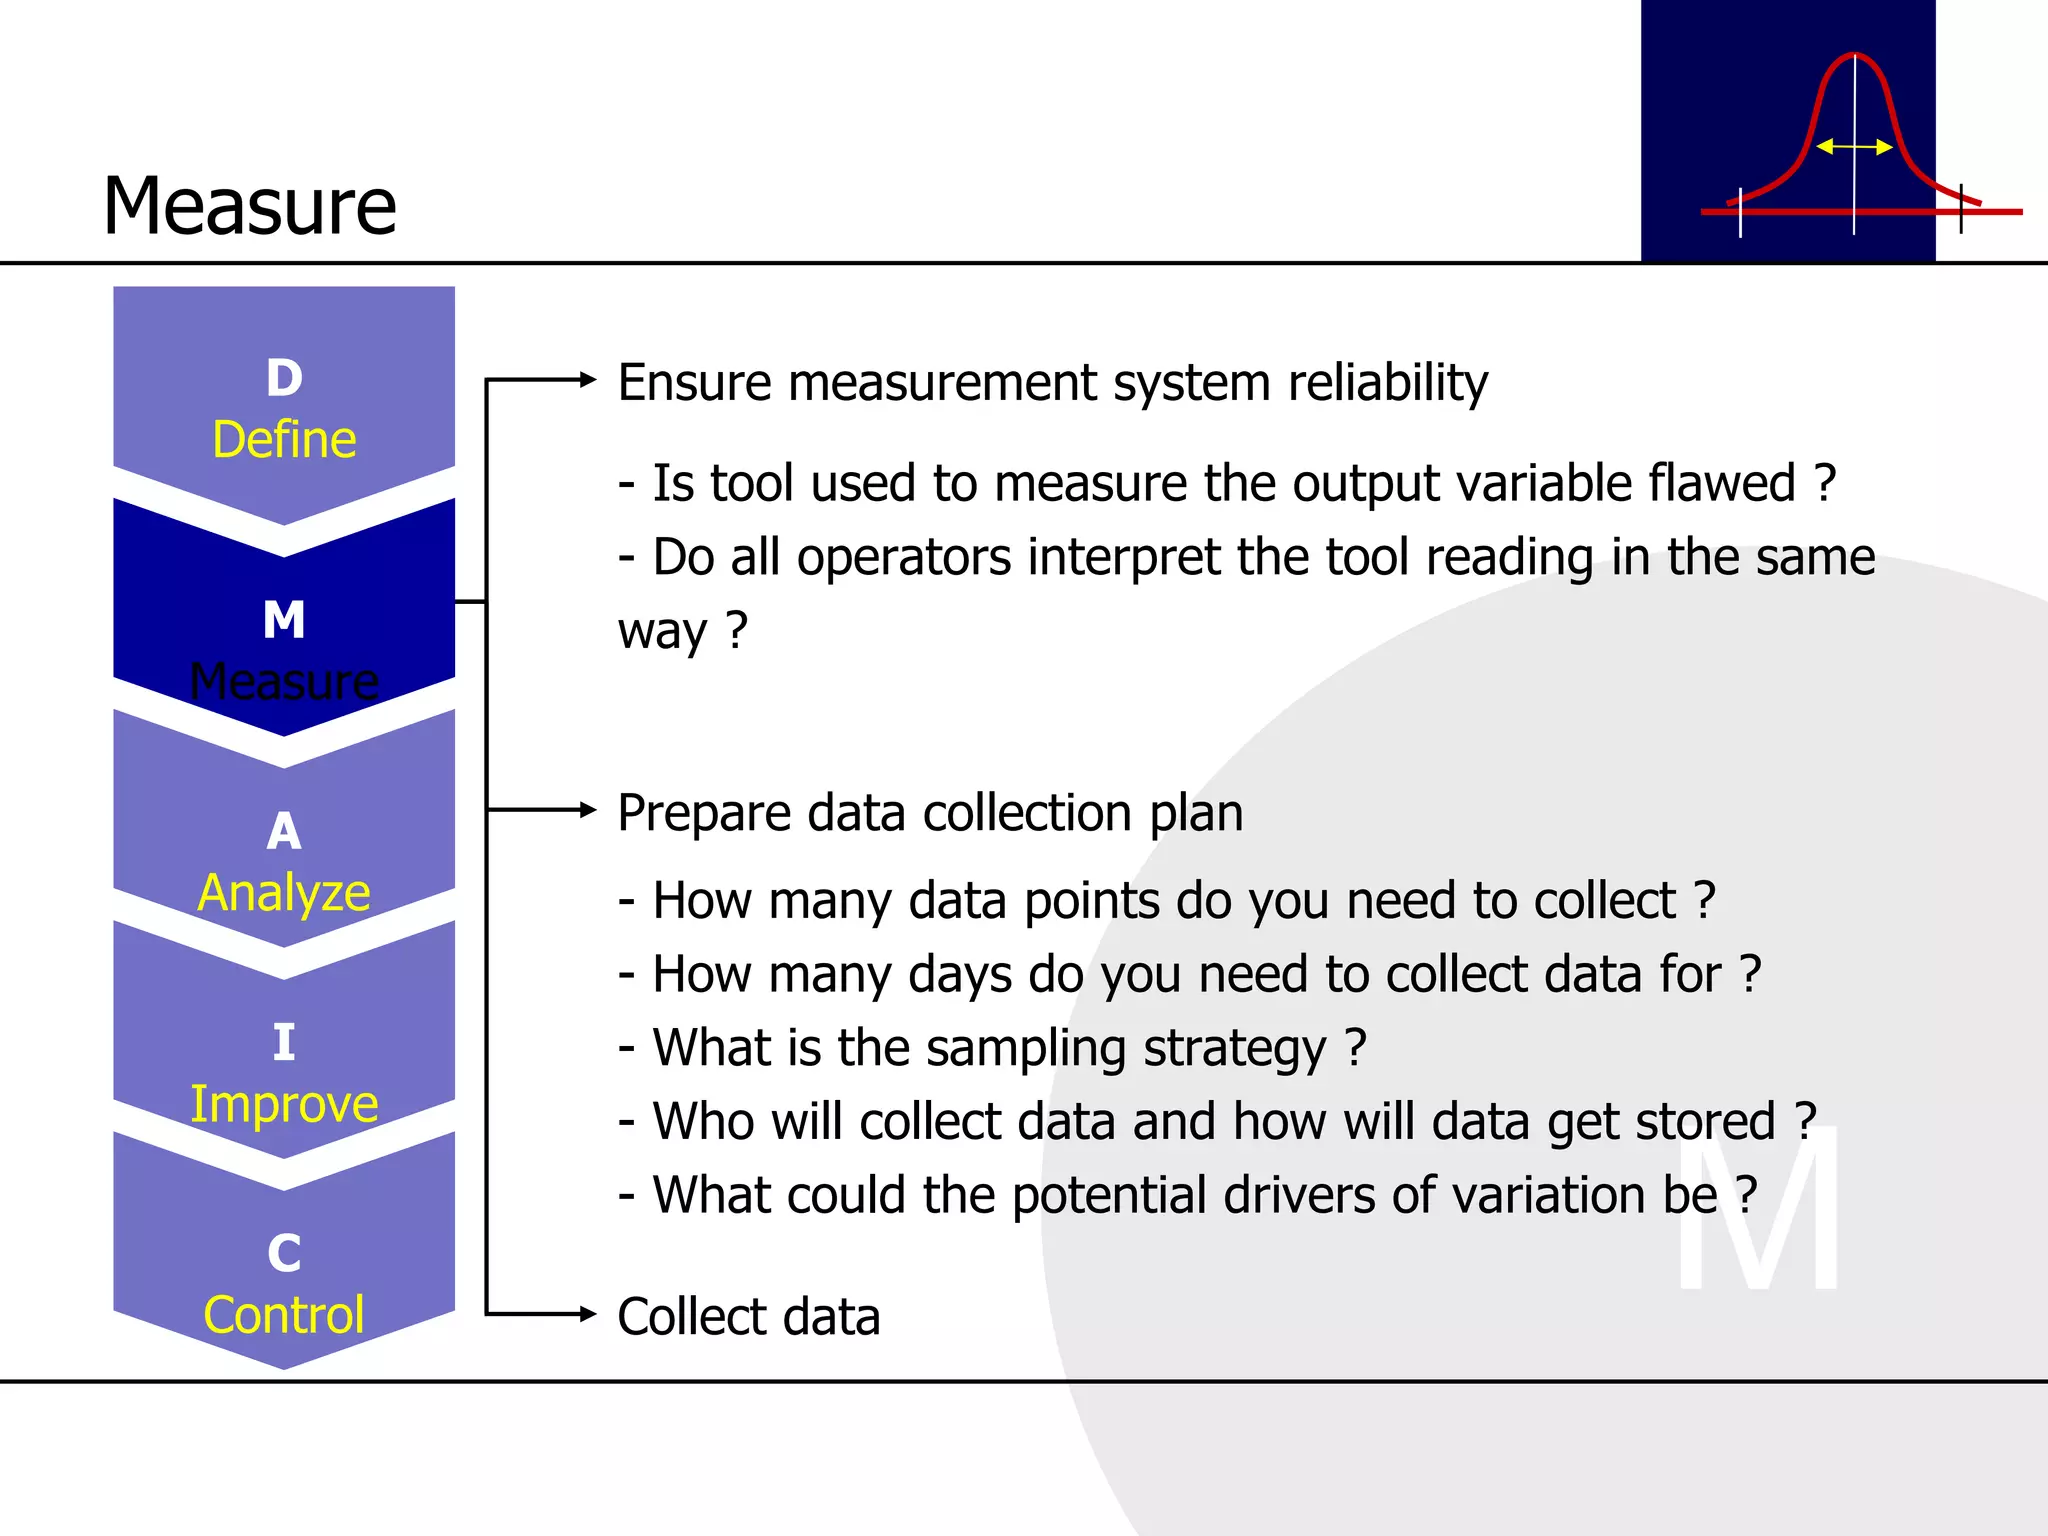
Ensure measurement systemreliability Prepare data collection plan Collect data - Is tool used to measure the output variable flawed ? - Do all operators interpret the tool reading in the same way ? - How many data points do you need to collect ? How many days do you need to collect data for ? What is the sampling strategy ? Who will collect data and how will data get stored ? What could the potential drivers of variation be ? Measure D Define M Measure A Analyze I Improve C Control
21.
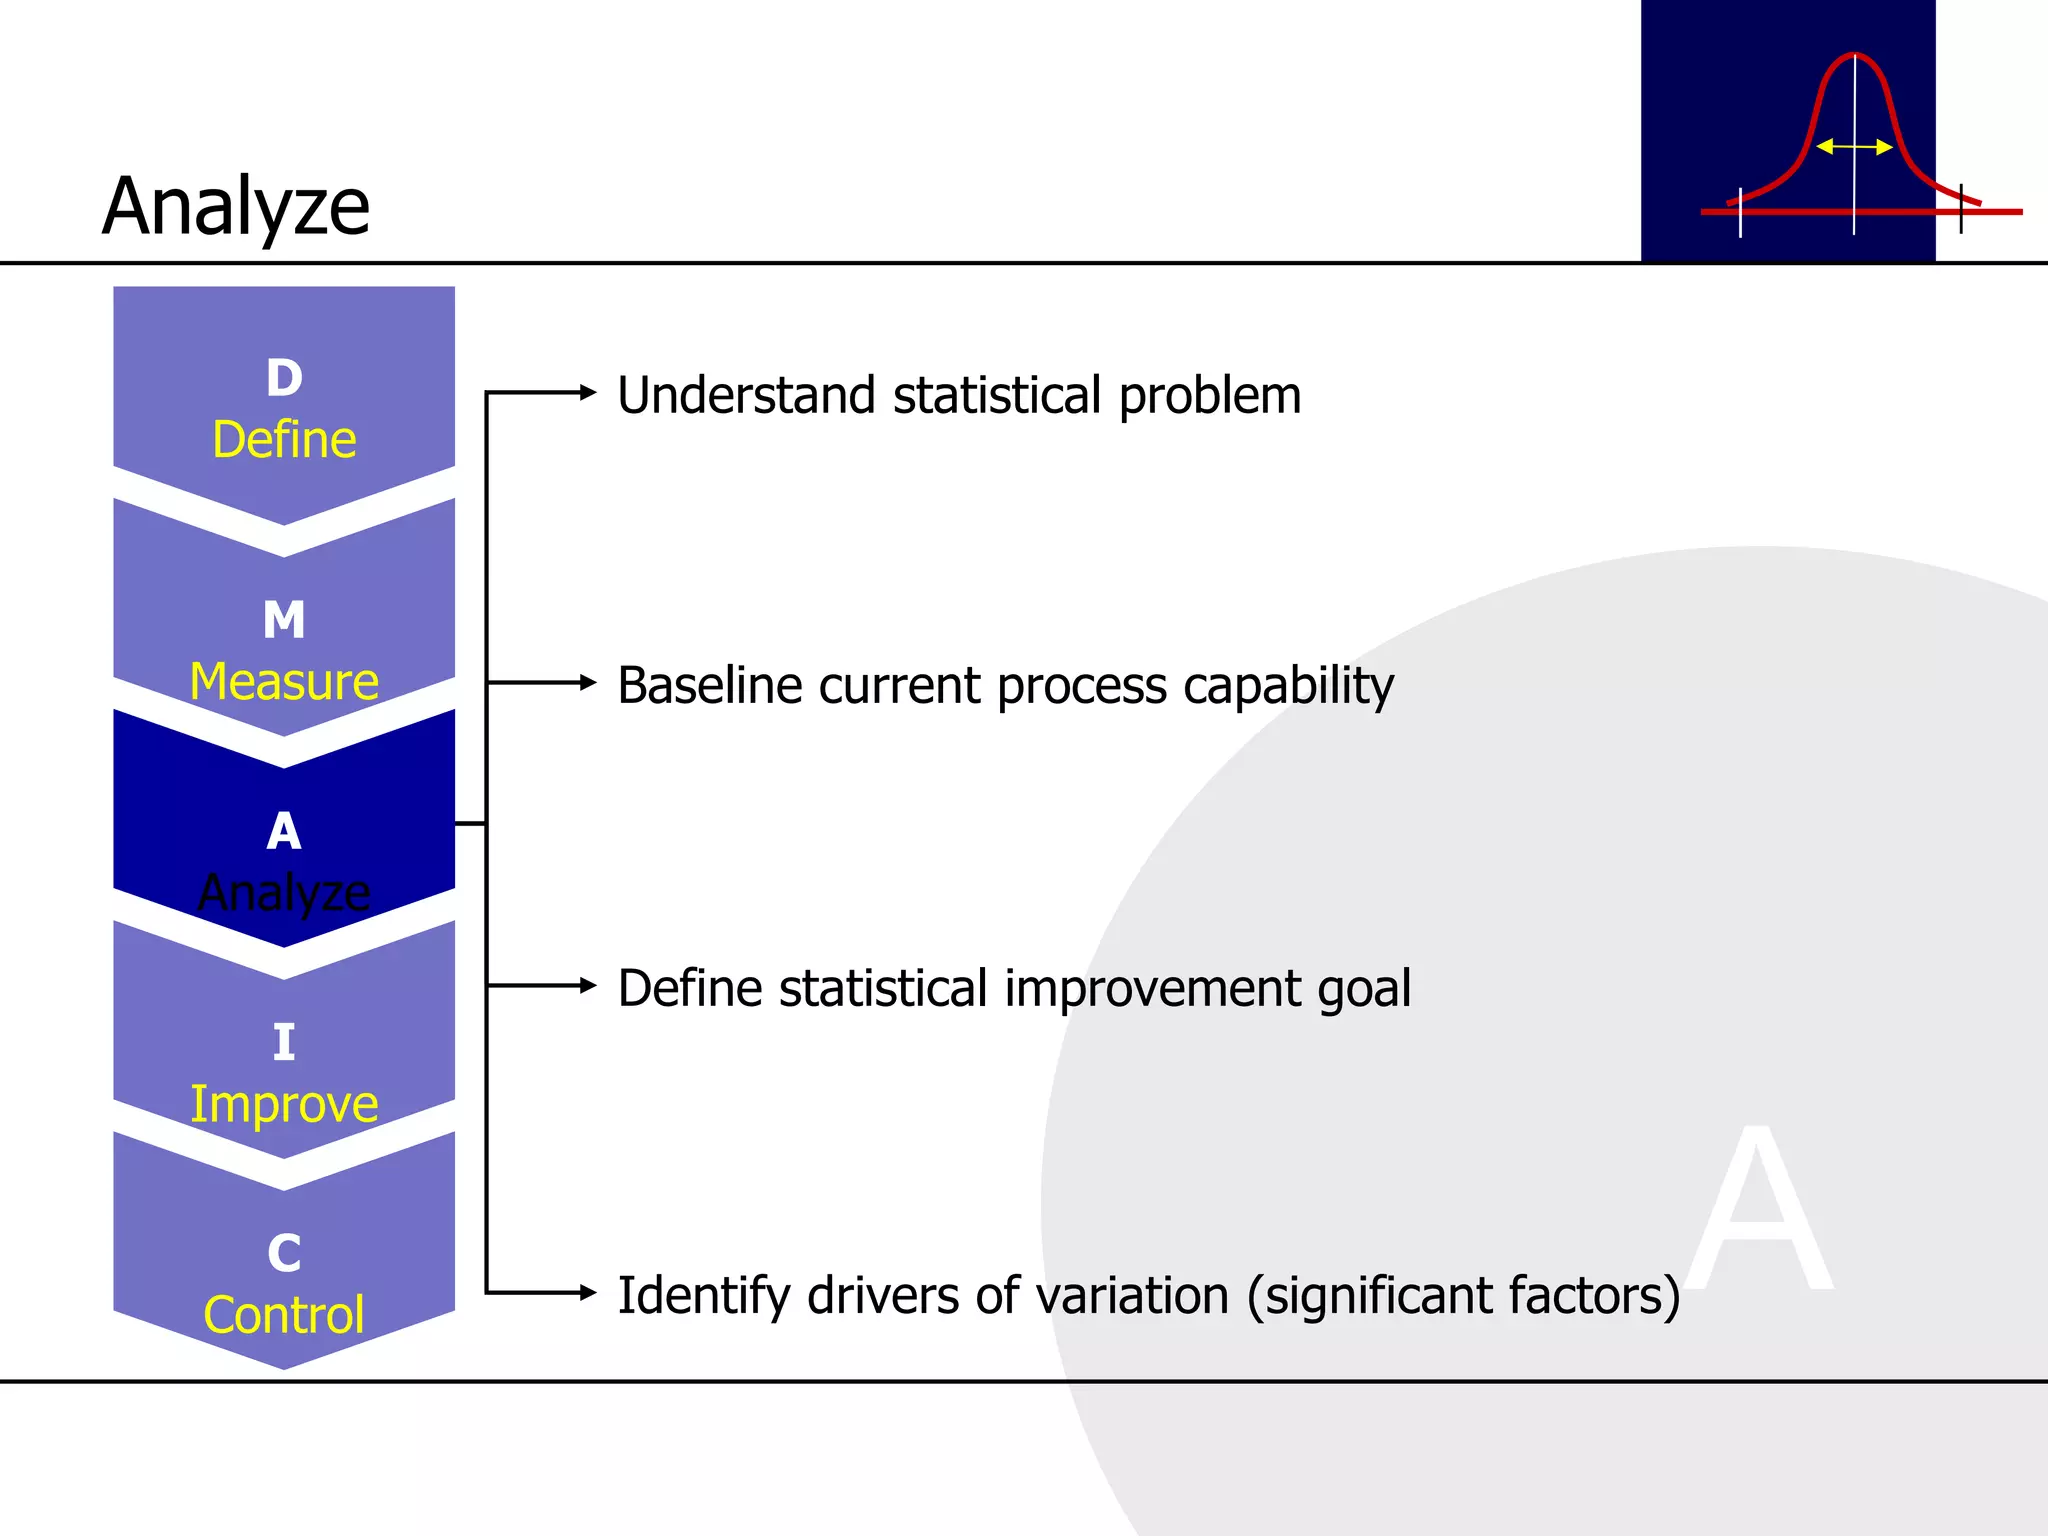
Understand statistical problemBaseline current process capability Define statistical improvement goal Identify drivers of variation (significant factors) Analyze D Define M Measure A Analyze I Improve C Control
22.
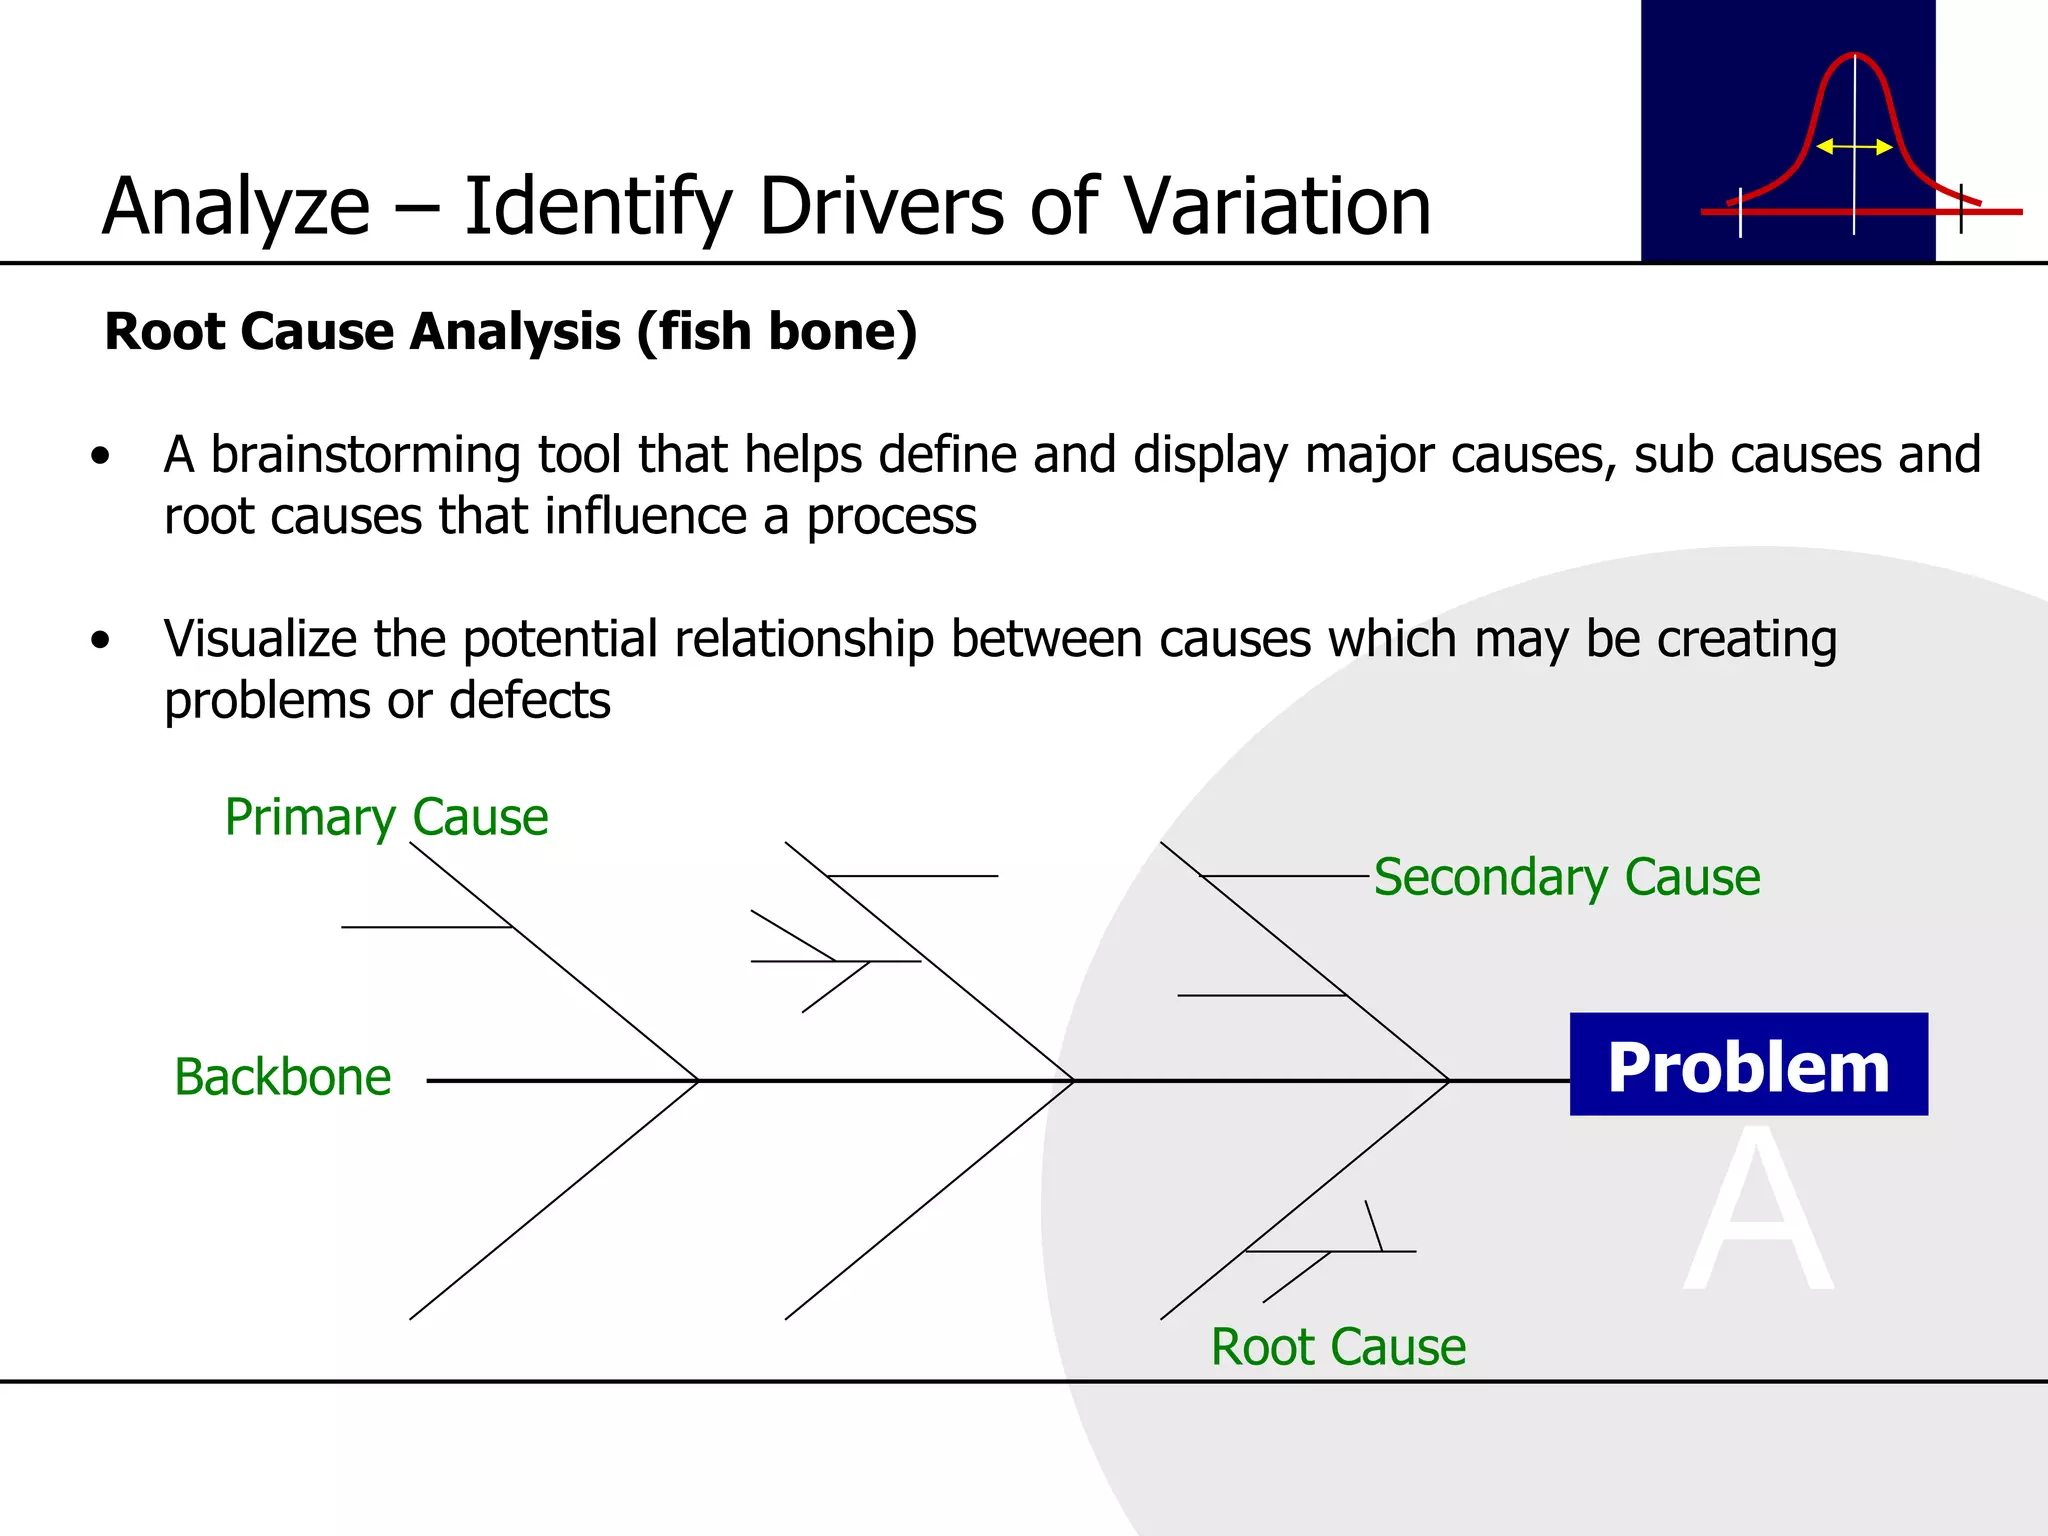
Root Cause Analysis(fish bone) A brainstorming tool that helps define and display major causes, sub causes and root causes that influence a process Visualize the potential relationship between causes which may be creating problems or defects Analyze – Identify Drivers of Variation Problem Backbone Primary Cause Secondary Cause Root Cause
23.
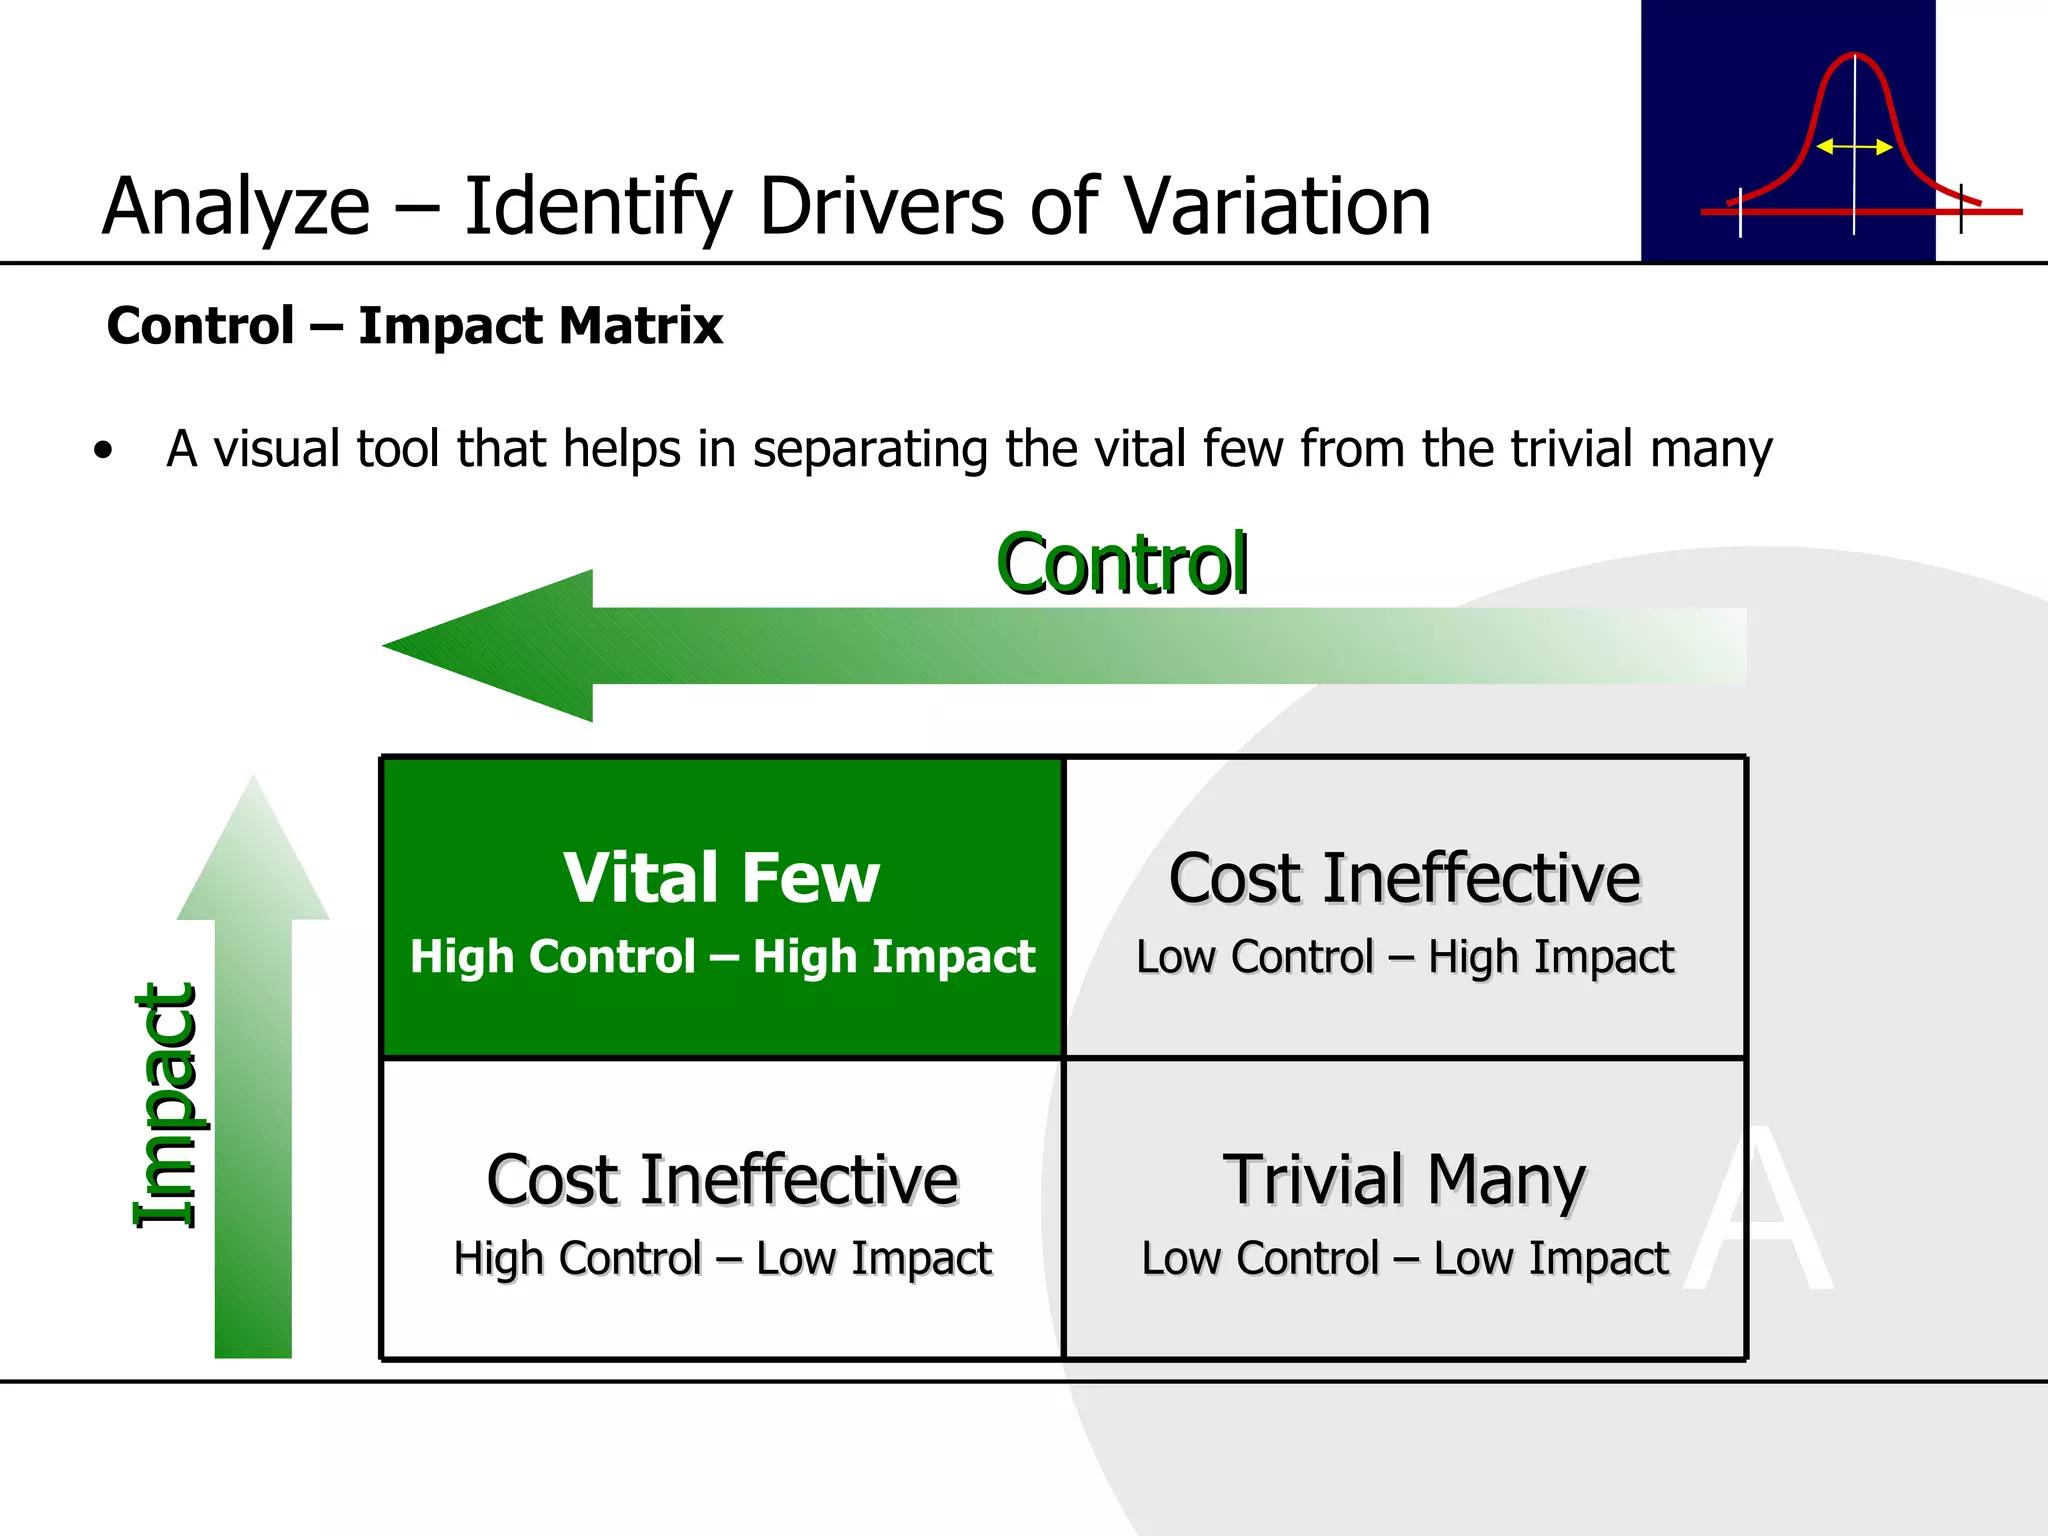
Control – ImpactMatrix A visual tool that helps in separating the vital few from the trivial many Control Impact Analyze – Identify Drivers of Variation Vital Few High Control – High Impact Cost Ineffective Low Control – High Impact Cost Ineffective High Control – Low Impact Trivial Many Low Control – Low Impact
24.
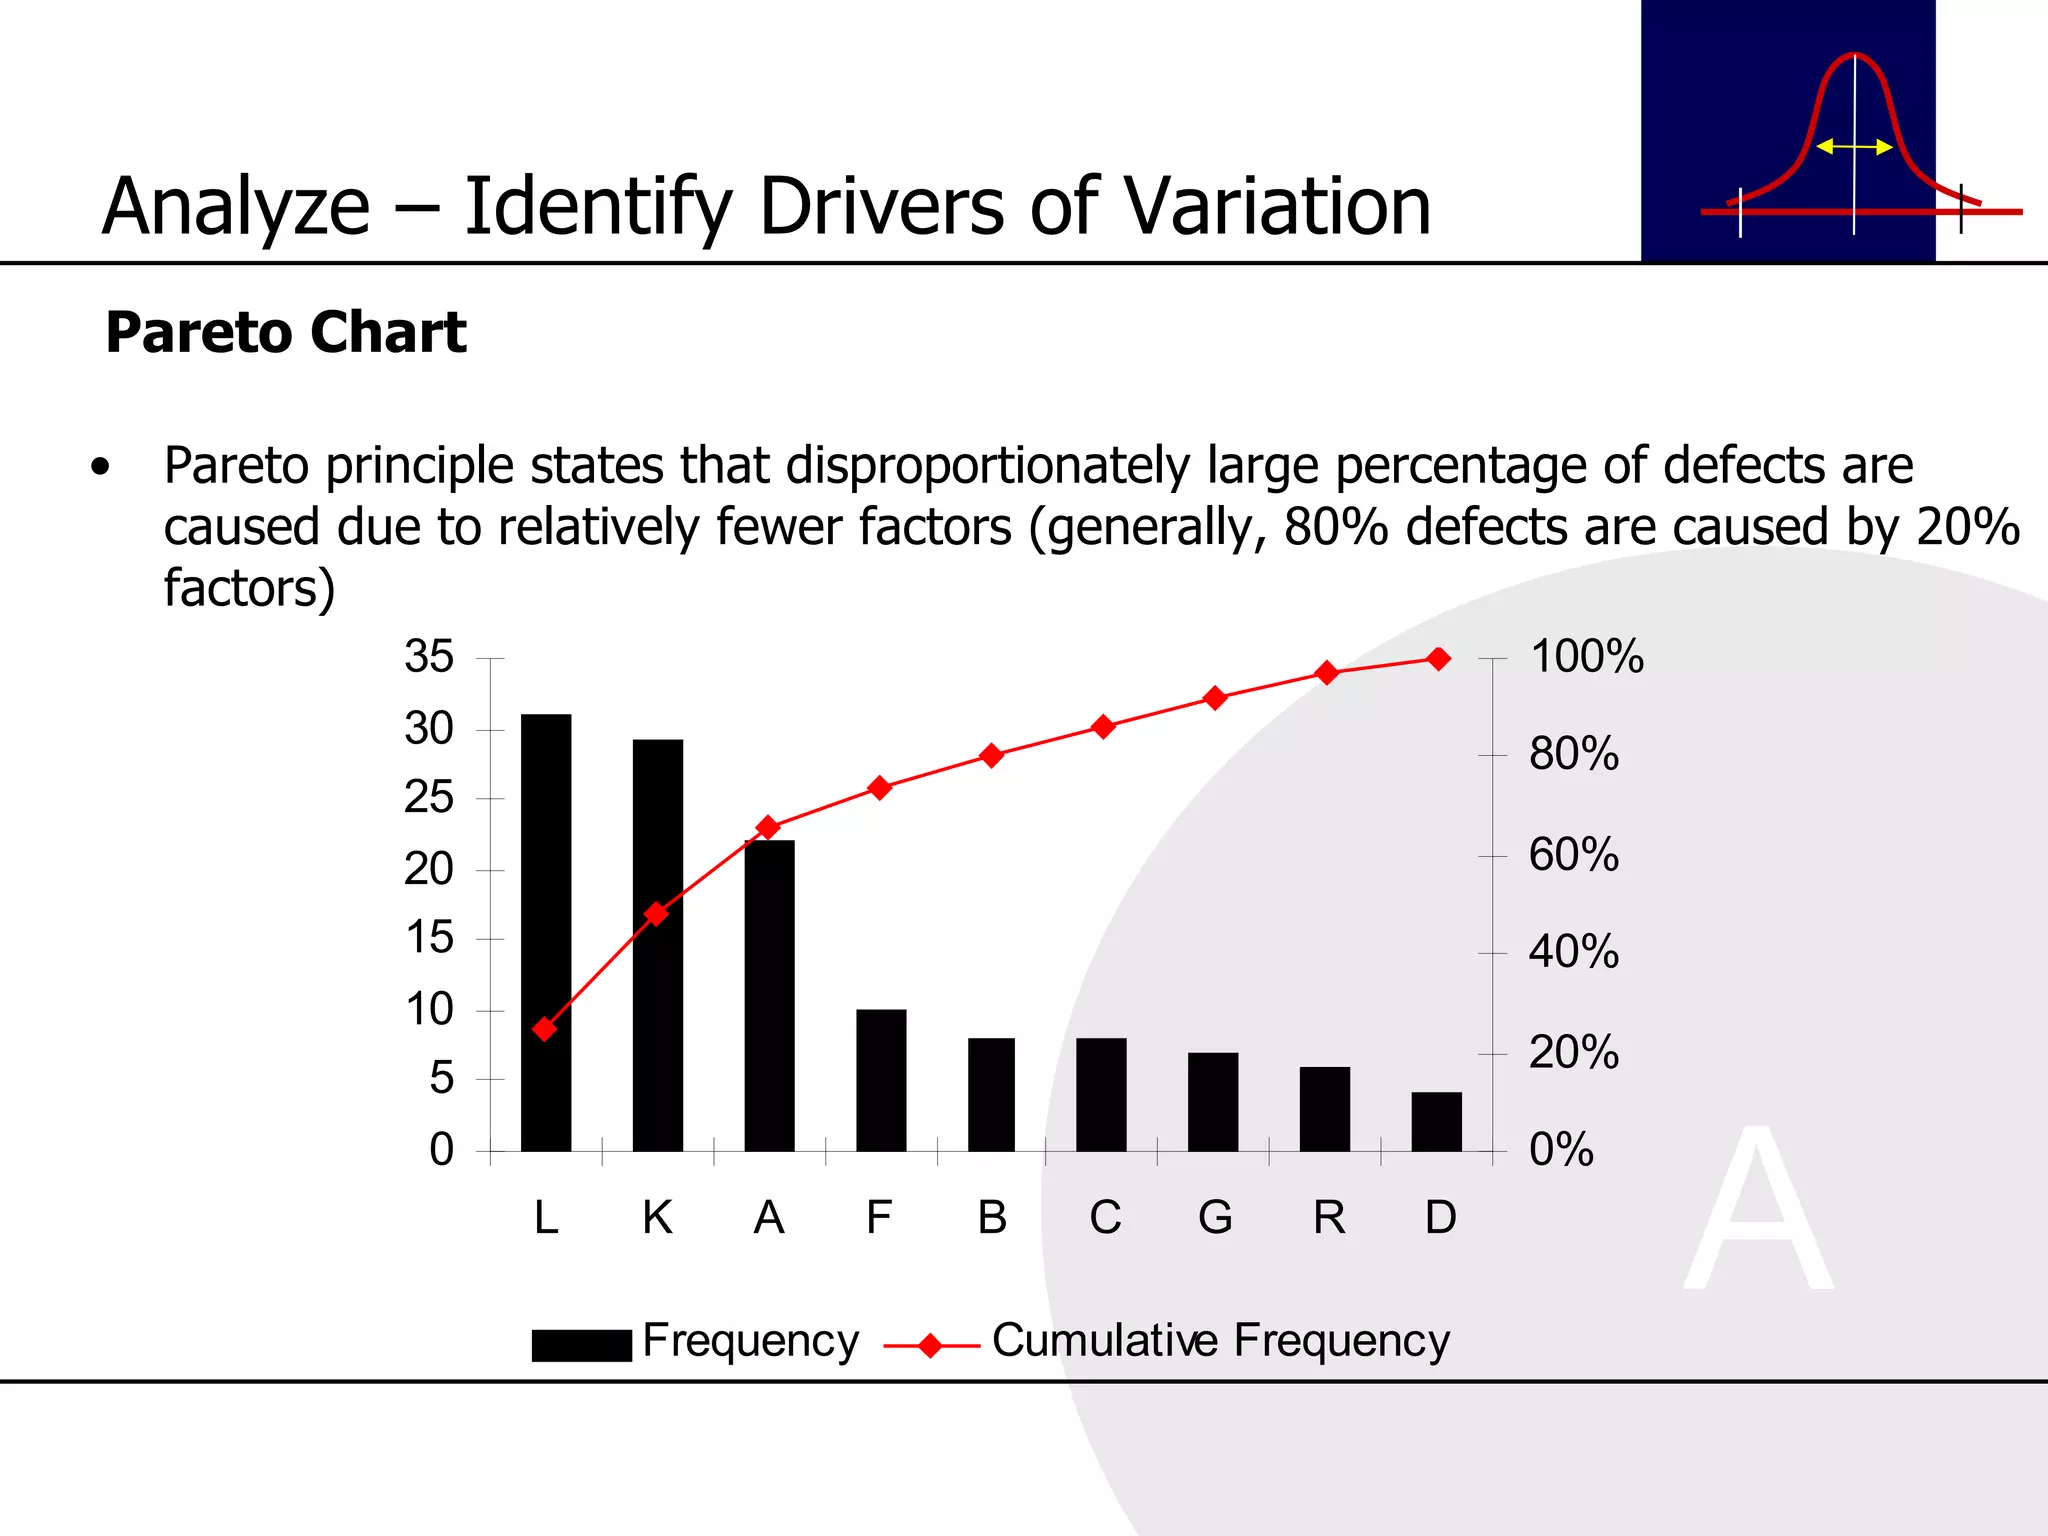
Pareto Chart Paretoprinciple states that disproportionately large percentage of defects are caused due to relatively fewer factors (generally, 80% defects are caused by 20% factors) Analyze – Identify Drivers of Variation
25.
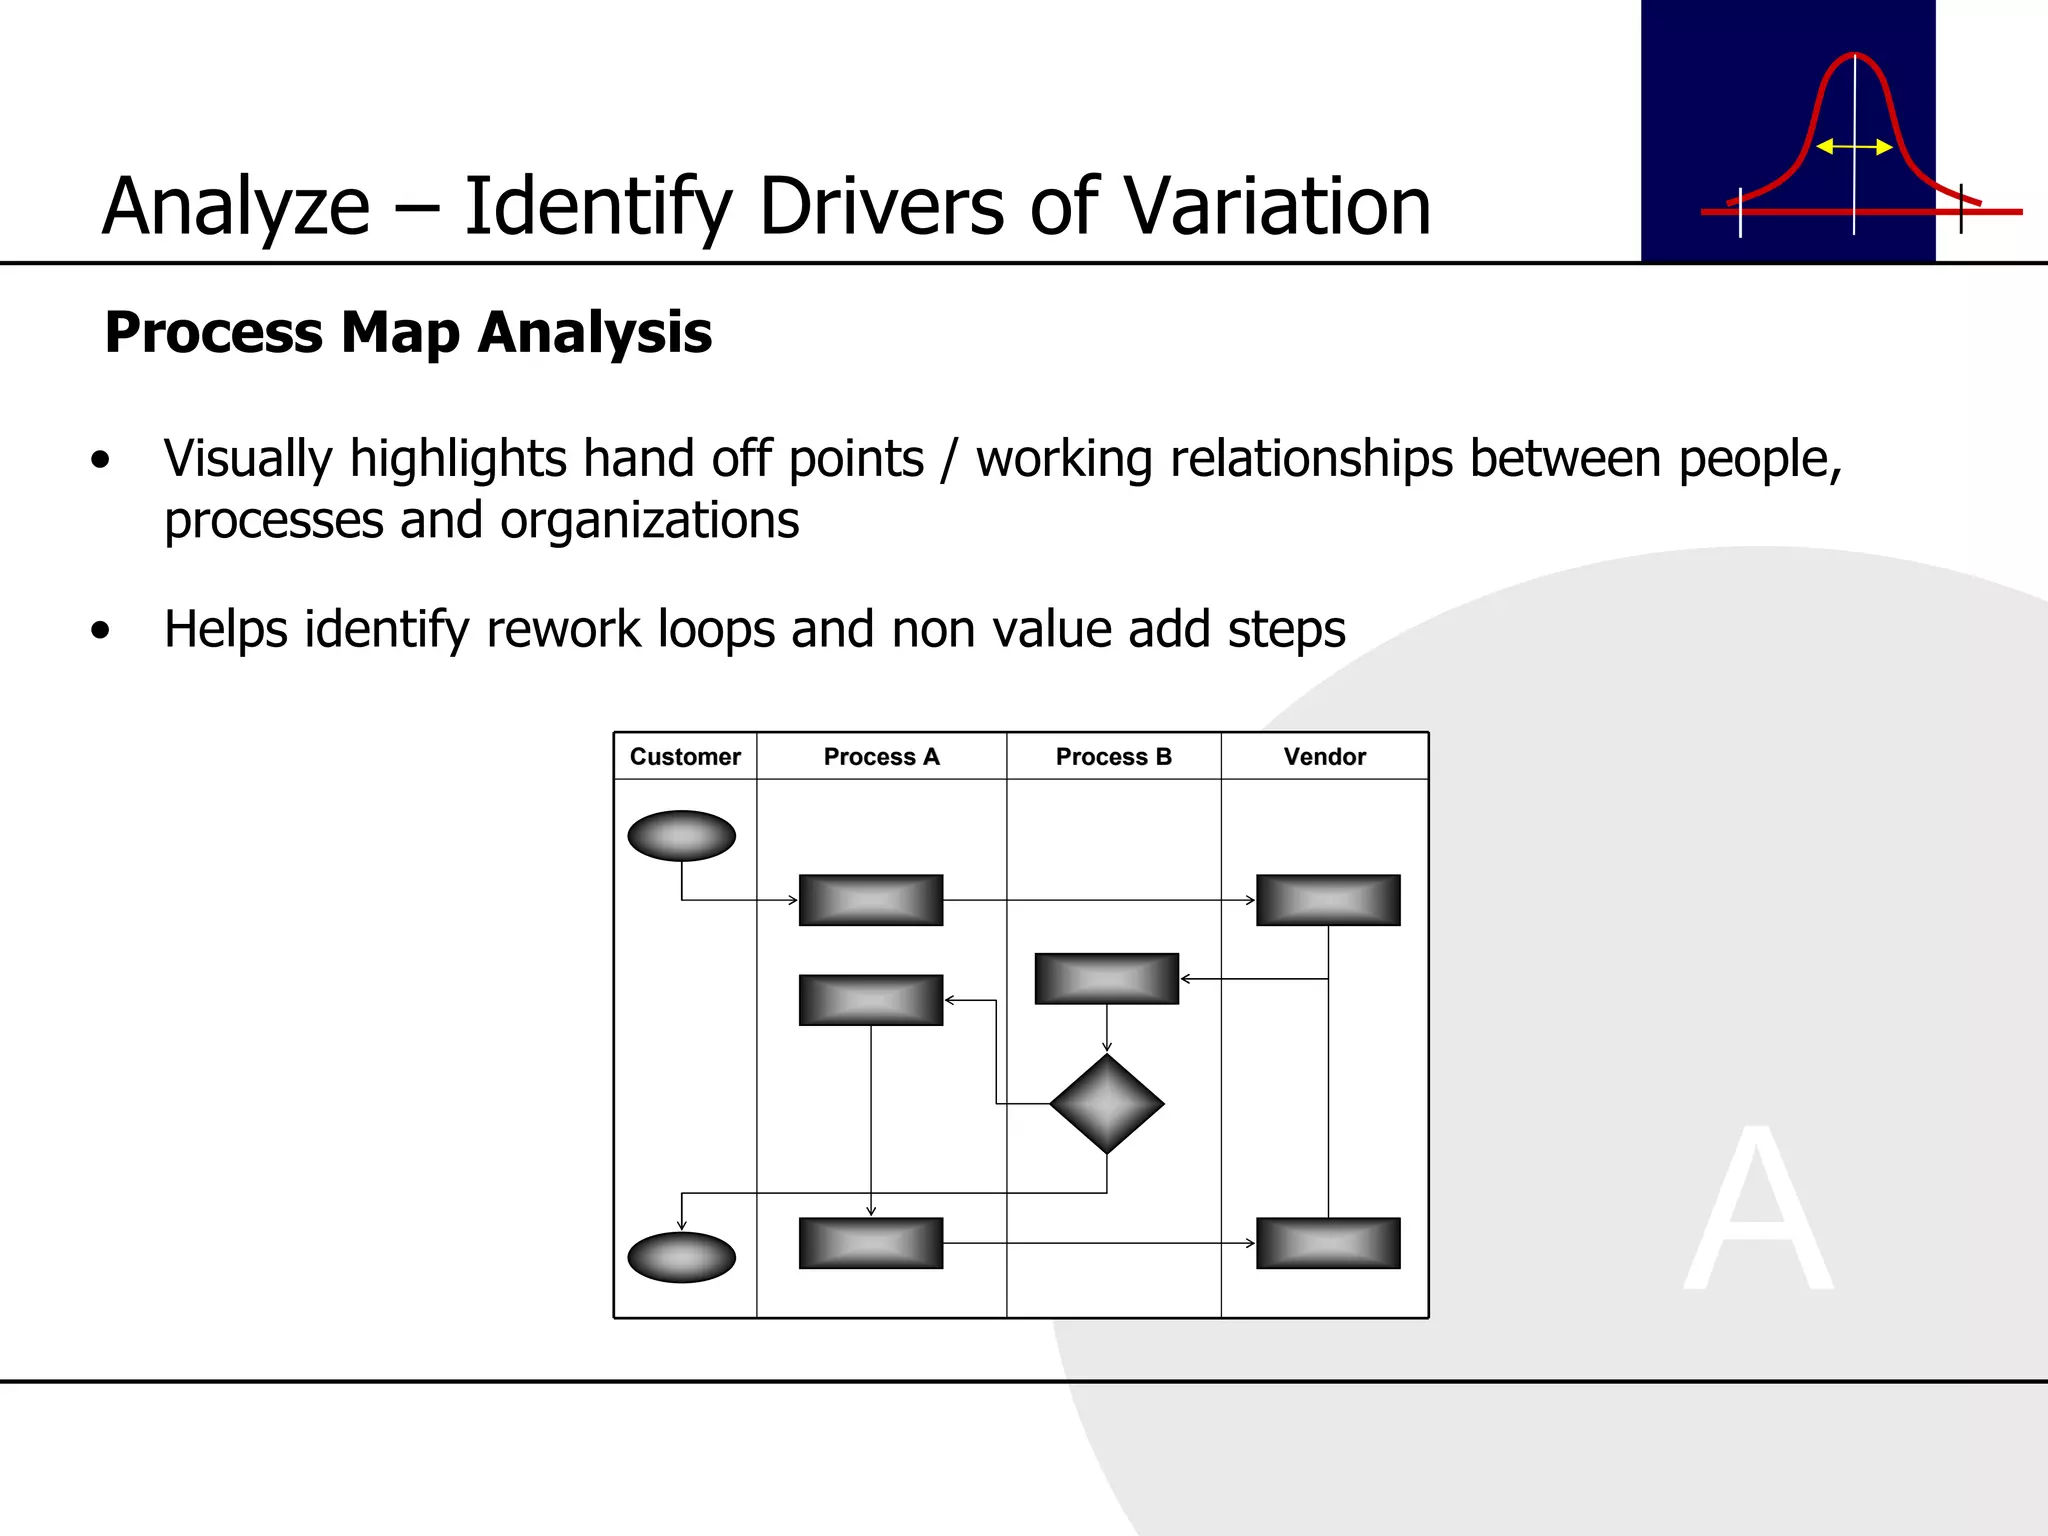
Process Map AnalysisVisually highlights hand off points / working relationships between people, processes and organizations Helps identify rework loops and non value add steps Analyze – Identify Drivers of Variation
26.
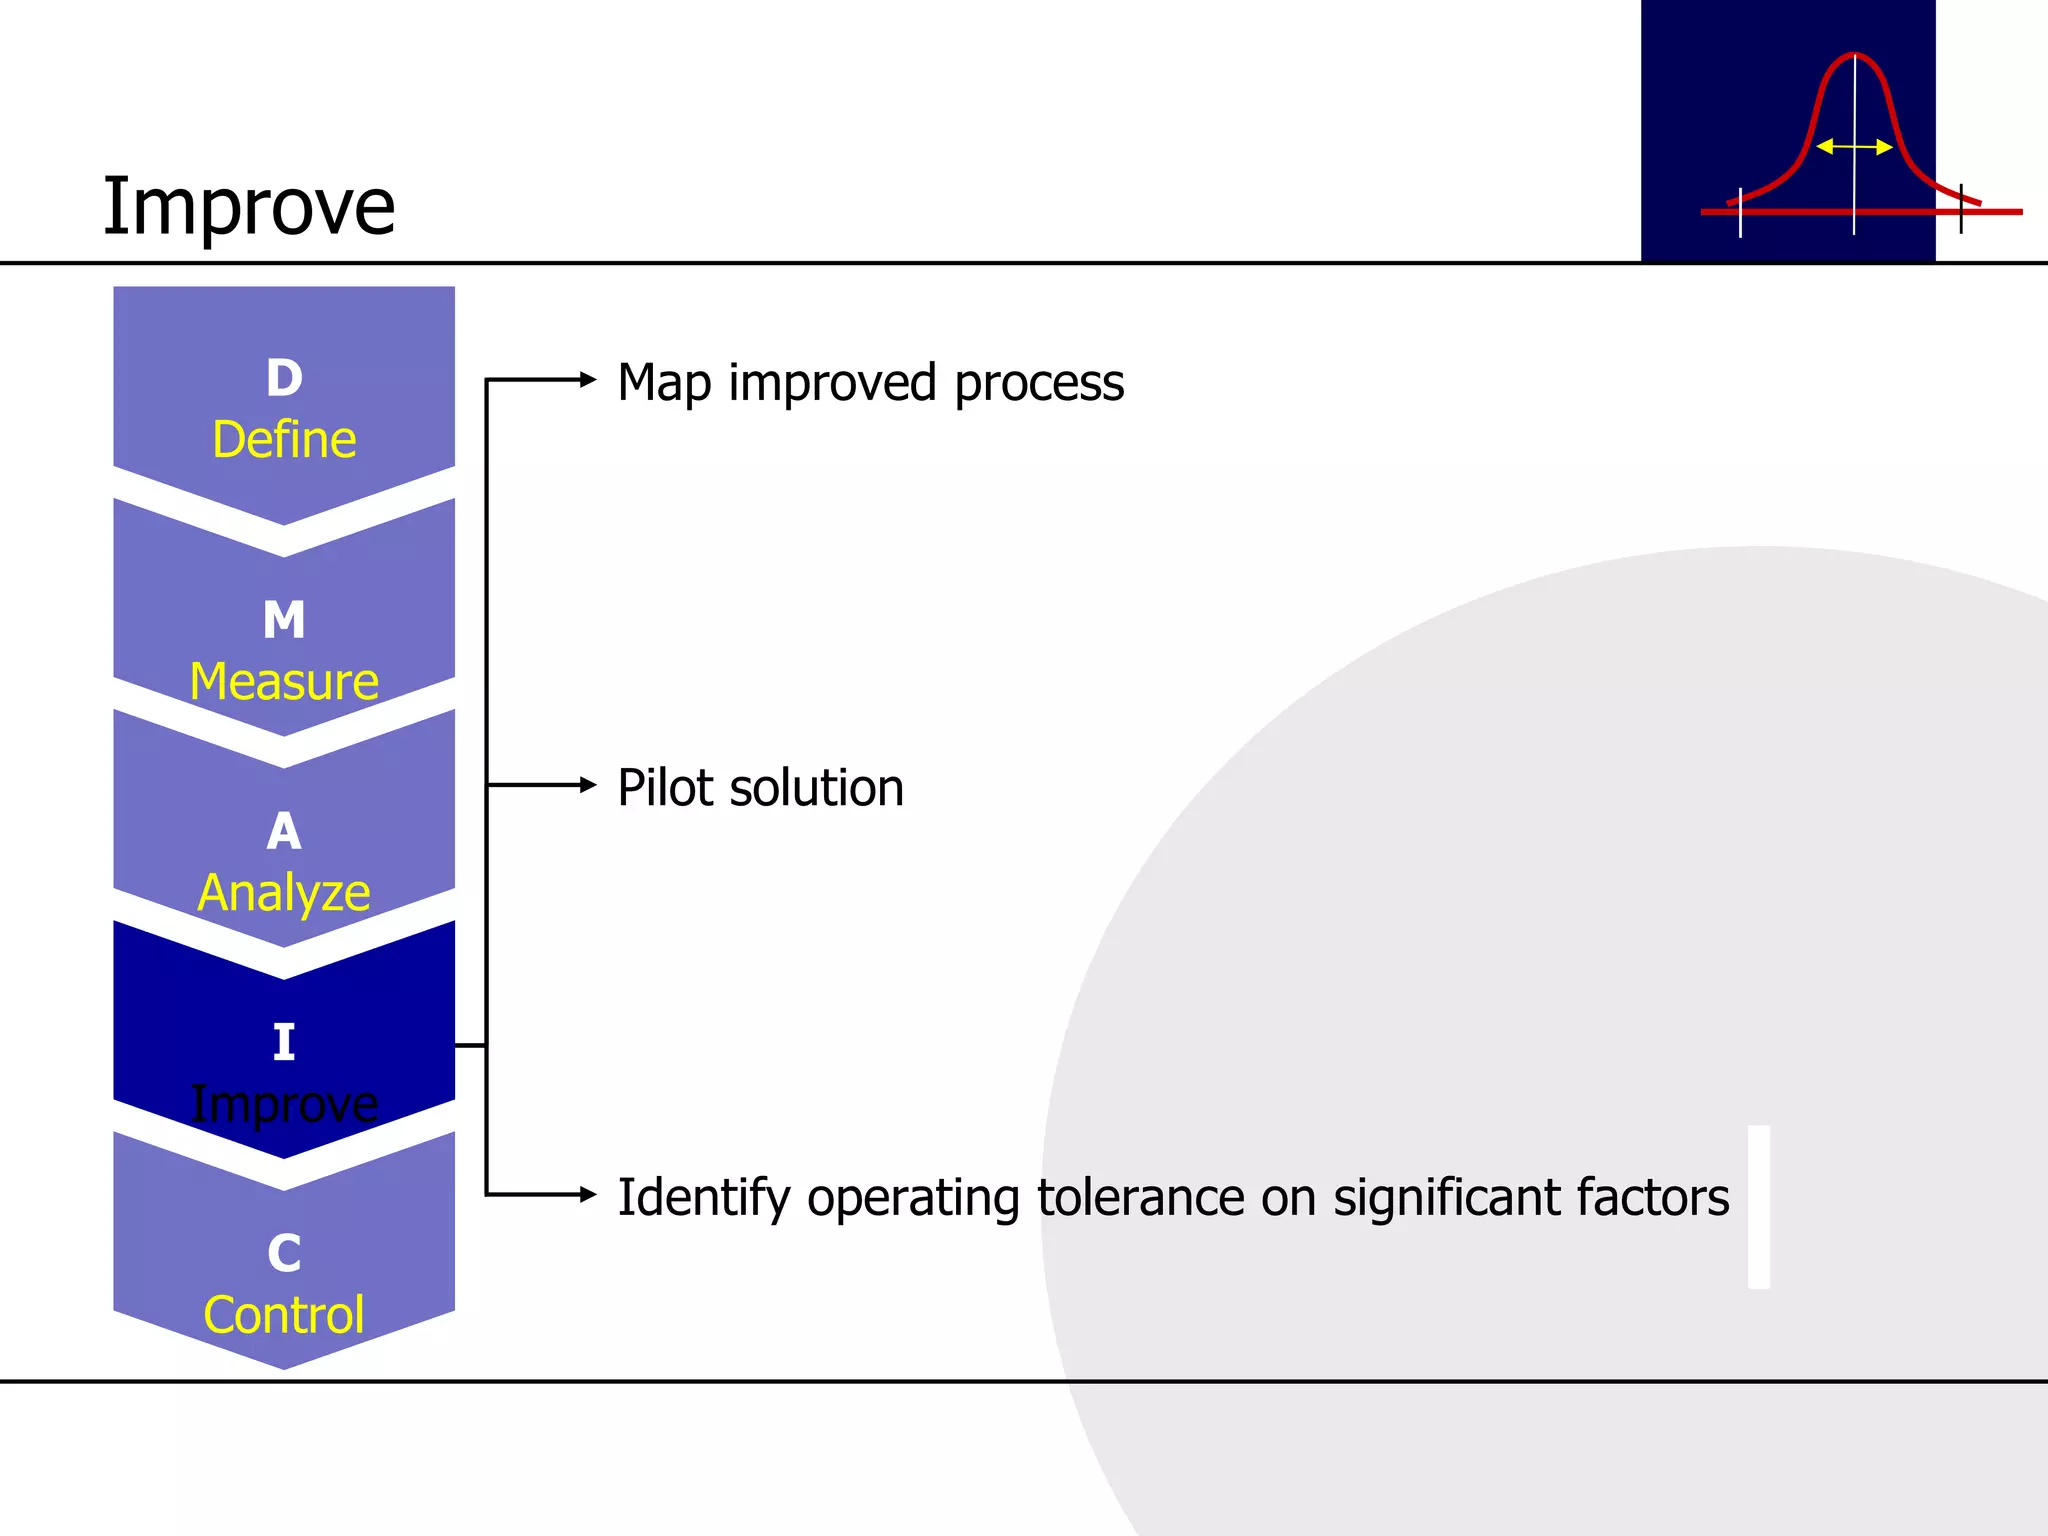
Map improved processPilot solution Identify operating tolerance on significant factors Improve D Define M Measure A Analyze I Improve C Control
27.
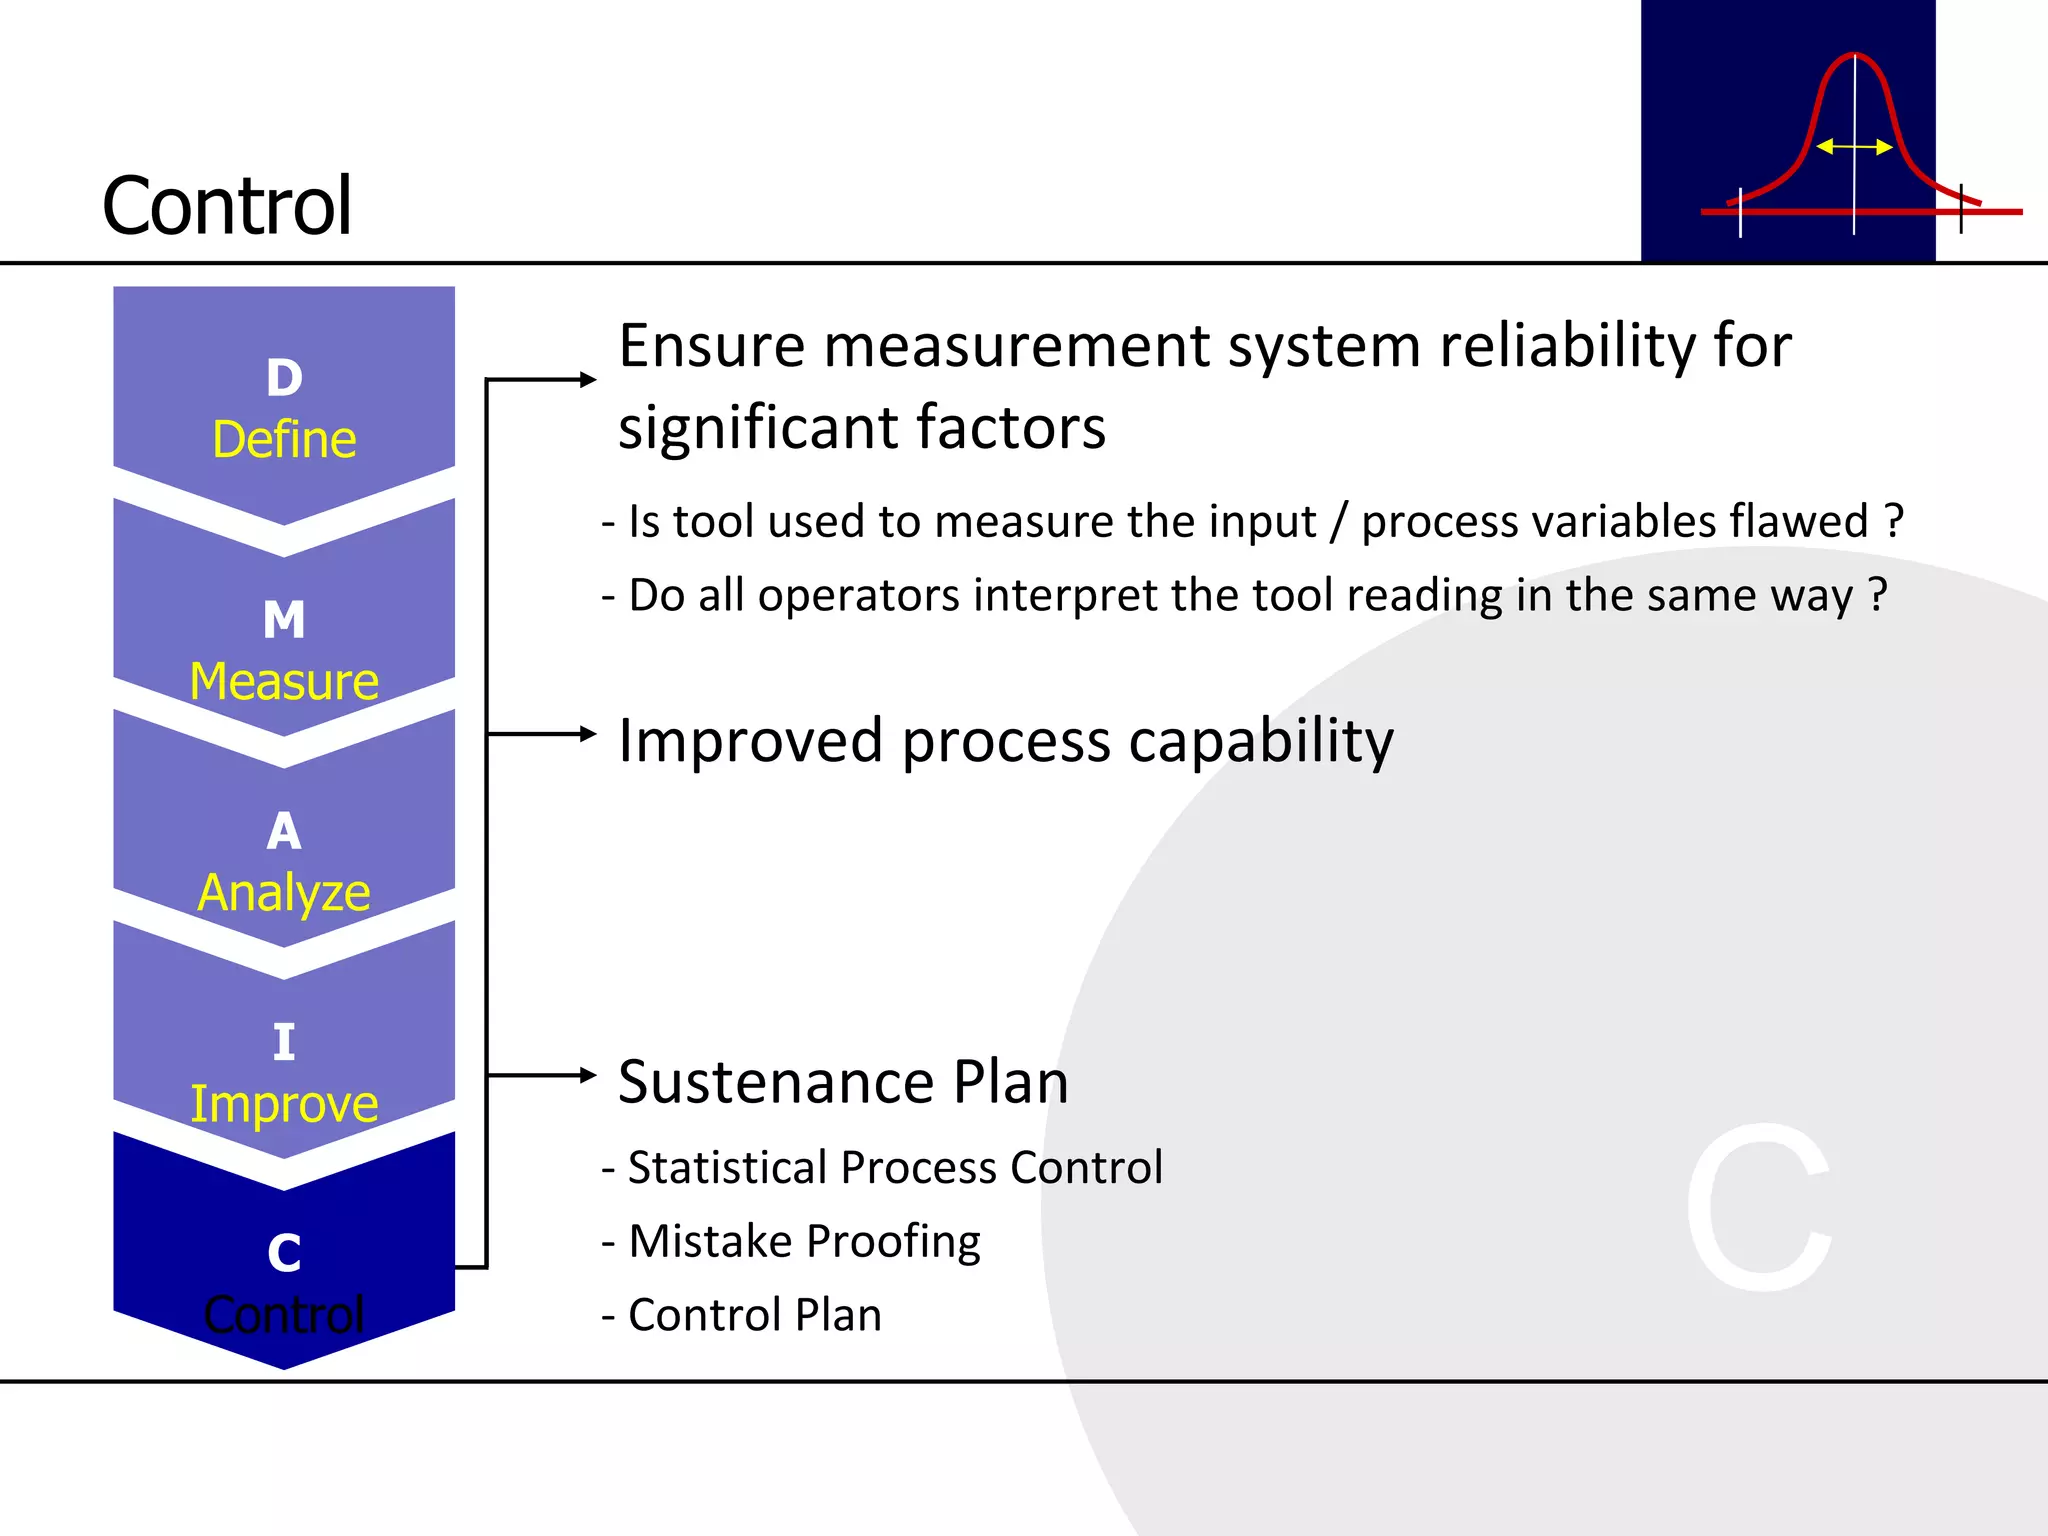
Ensure measurement systemreliability for significant factors Improved process capability Sustenance Plan - Is tool used to measure the input / process variables flawed ? - Do all operators interpret the tool reading in the same way ? - Statistical Process Control - Mistake Proofing - Control Plan Control D Define M Measure A Analyze I Improve C Control
28.
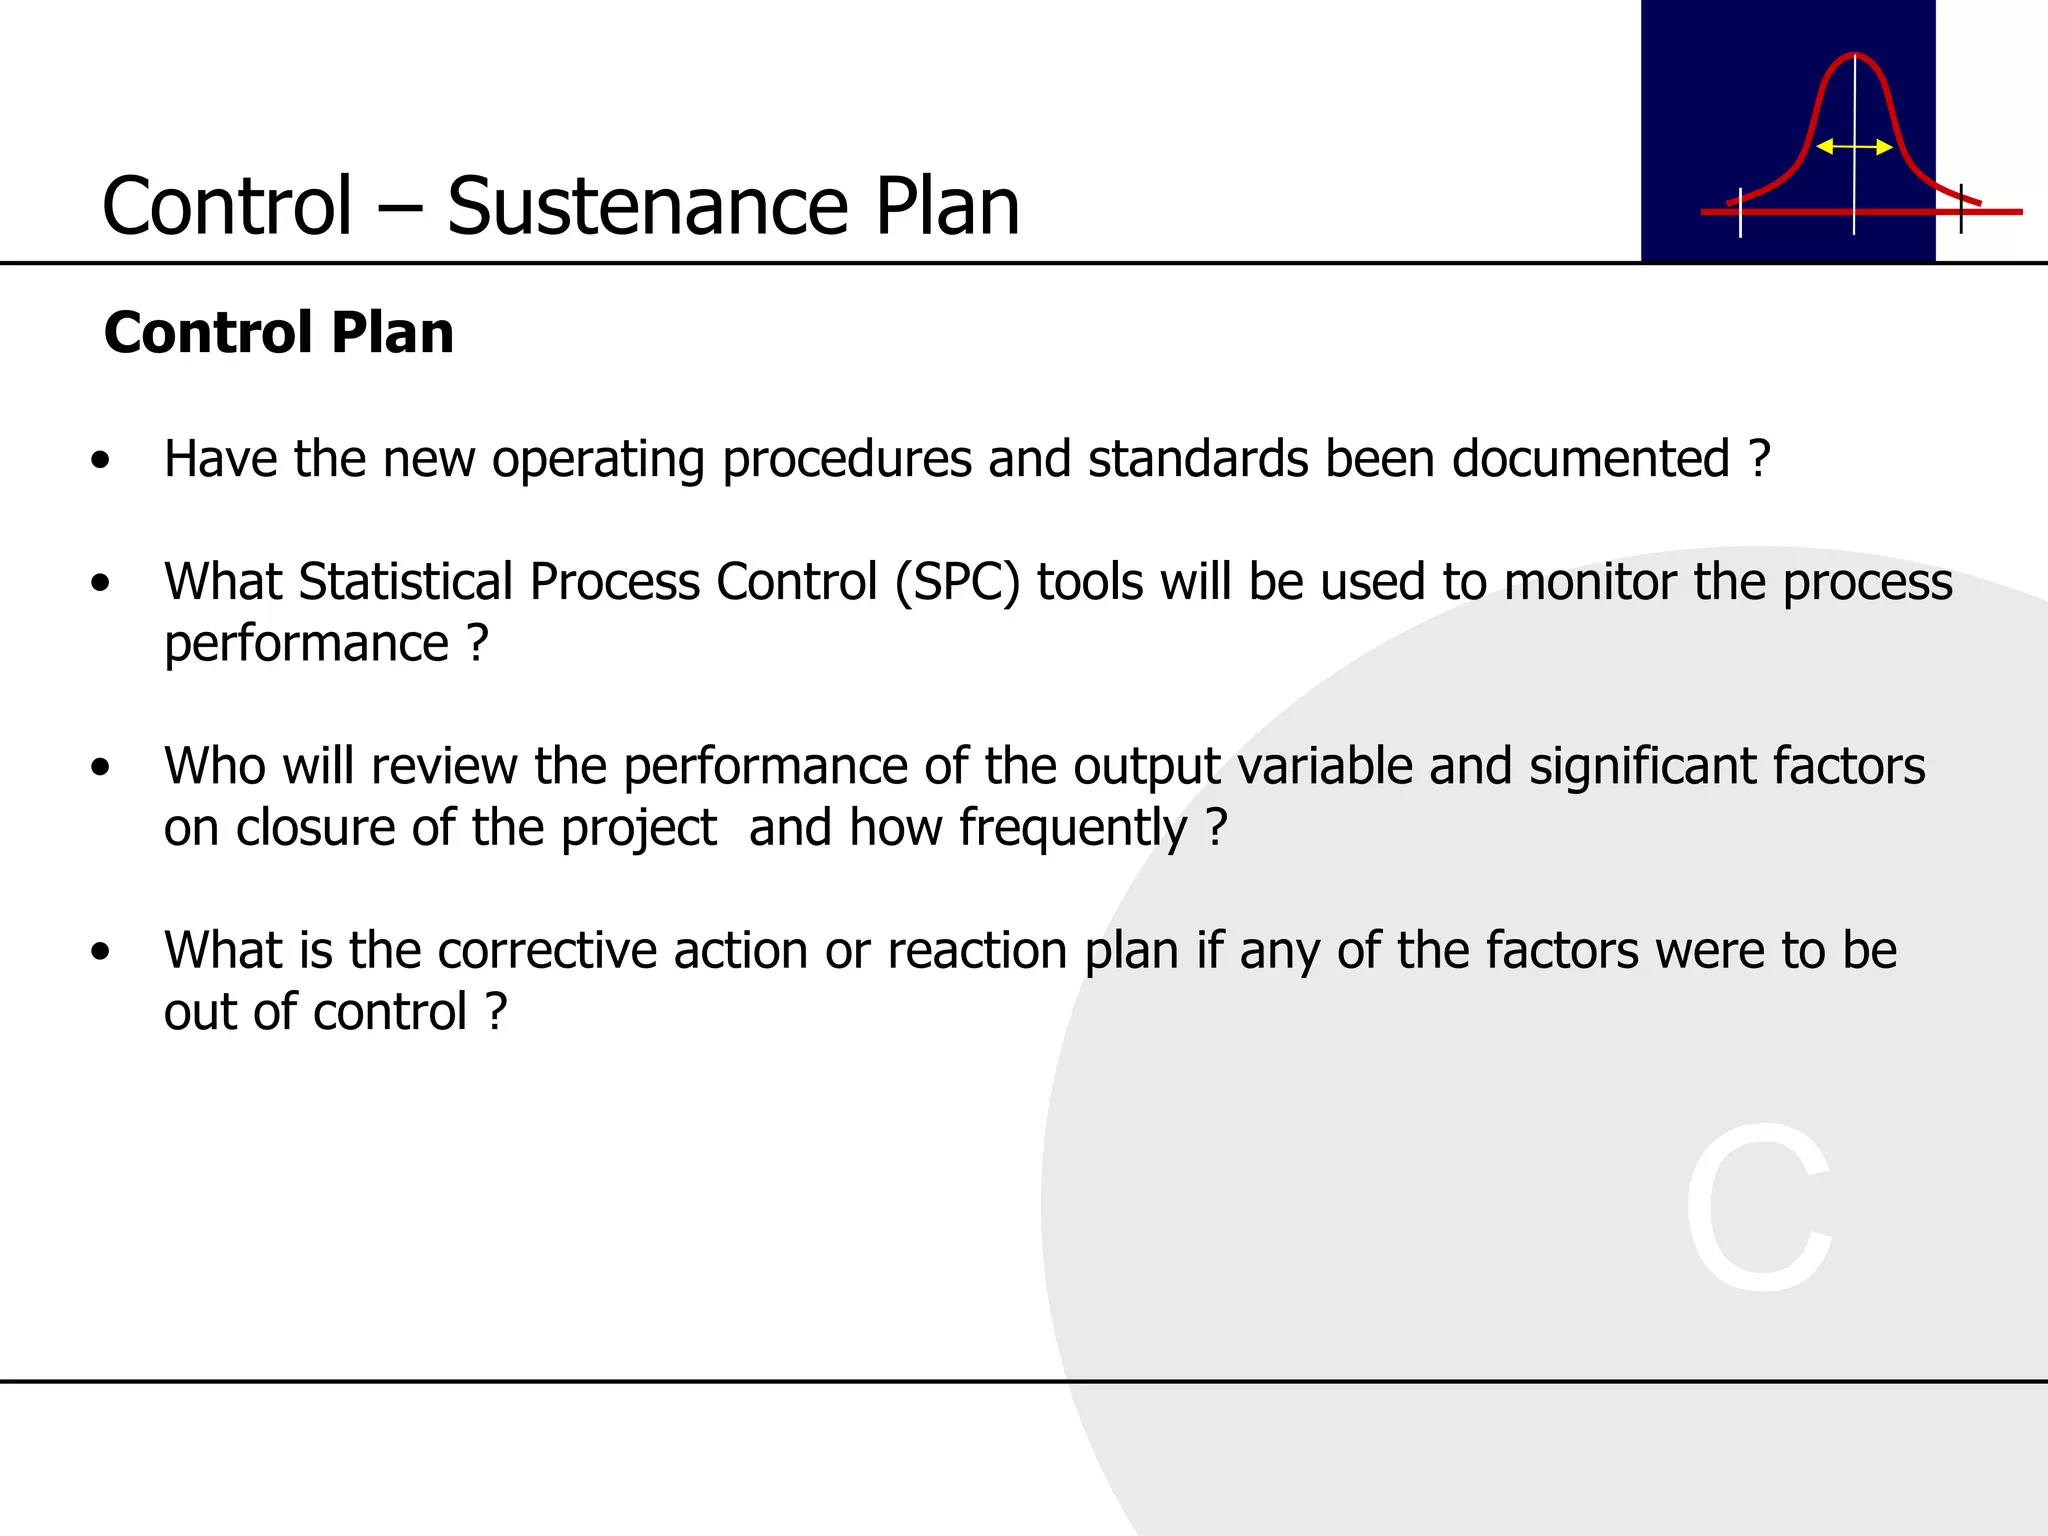
Control Plan Havethe new operating procedures and standards been documented ? What Statistical Process Control (SPC) tools will be used to monitor the process performance ? Who will review the performance of the output variable and significant factors on closure of the project and how frequently ? What is the corrective action or reaction plan if any of the factors were to be out of control ? Control – Sustenance Plan
29.
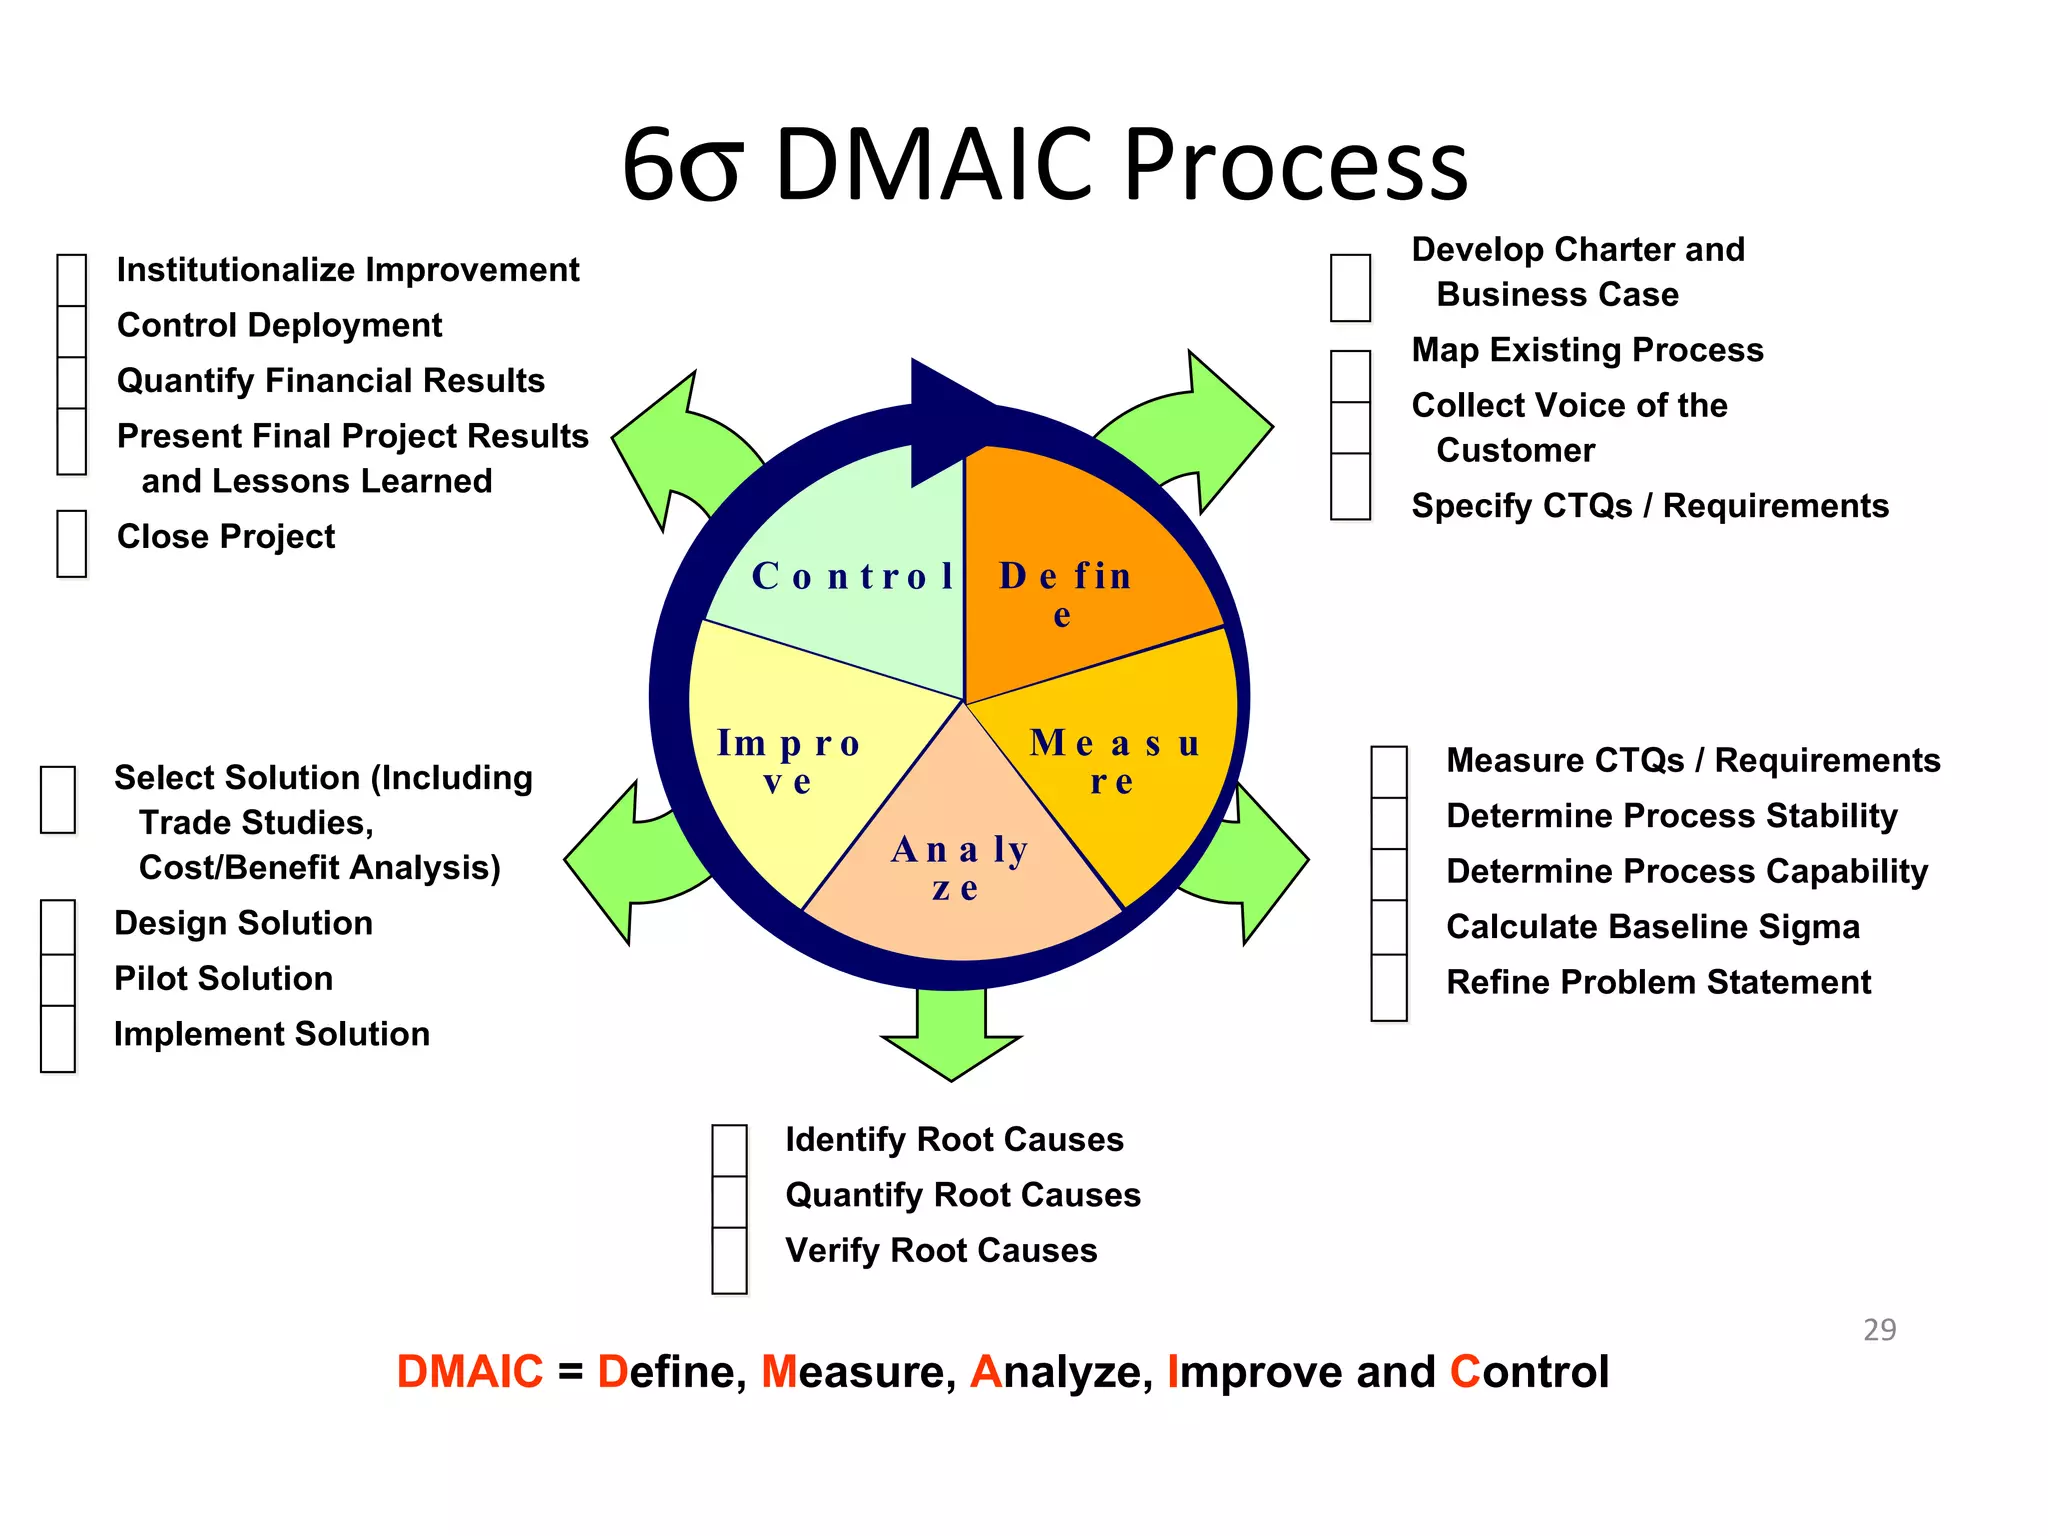
6 DMAIC Process DMAIC = D efine, M easure, A nalyze, I mprove and C ontrol Develop Charter and Business Case Map Existing Process Collect Voice of the Customer Specify CTQs / Requirements Measure CTQs / Requirements Determine Process Stability Determine Process Capability Calculate Baseline Sigma Refine Problem Statement Identify Root Causes Quantify Root Causes Verify Root Causes Institutionalize Improvement Control Deployment Quantify Financial Results Present Final Project Results and Lessons Learned Close Project Select Solution (Including Trade Studies, Cost/Benefit Analysis) Design Solution Pilot Solution Implement Solution Define Measure Analyze Improve Control
30.
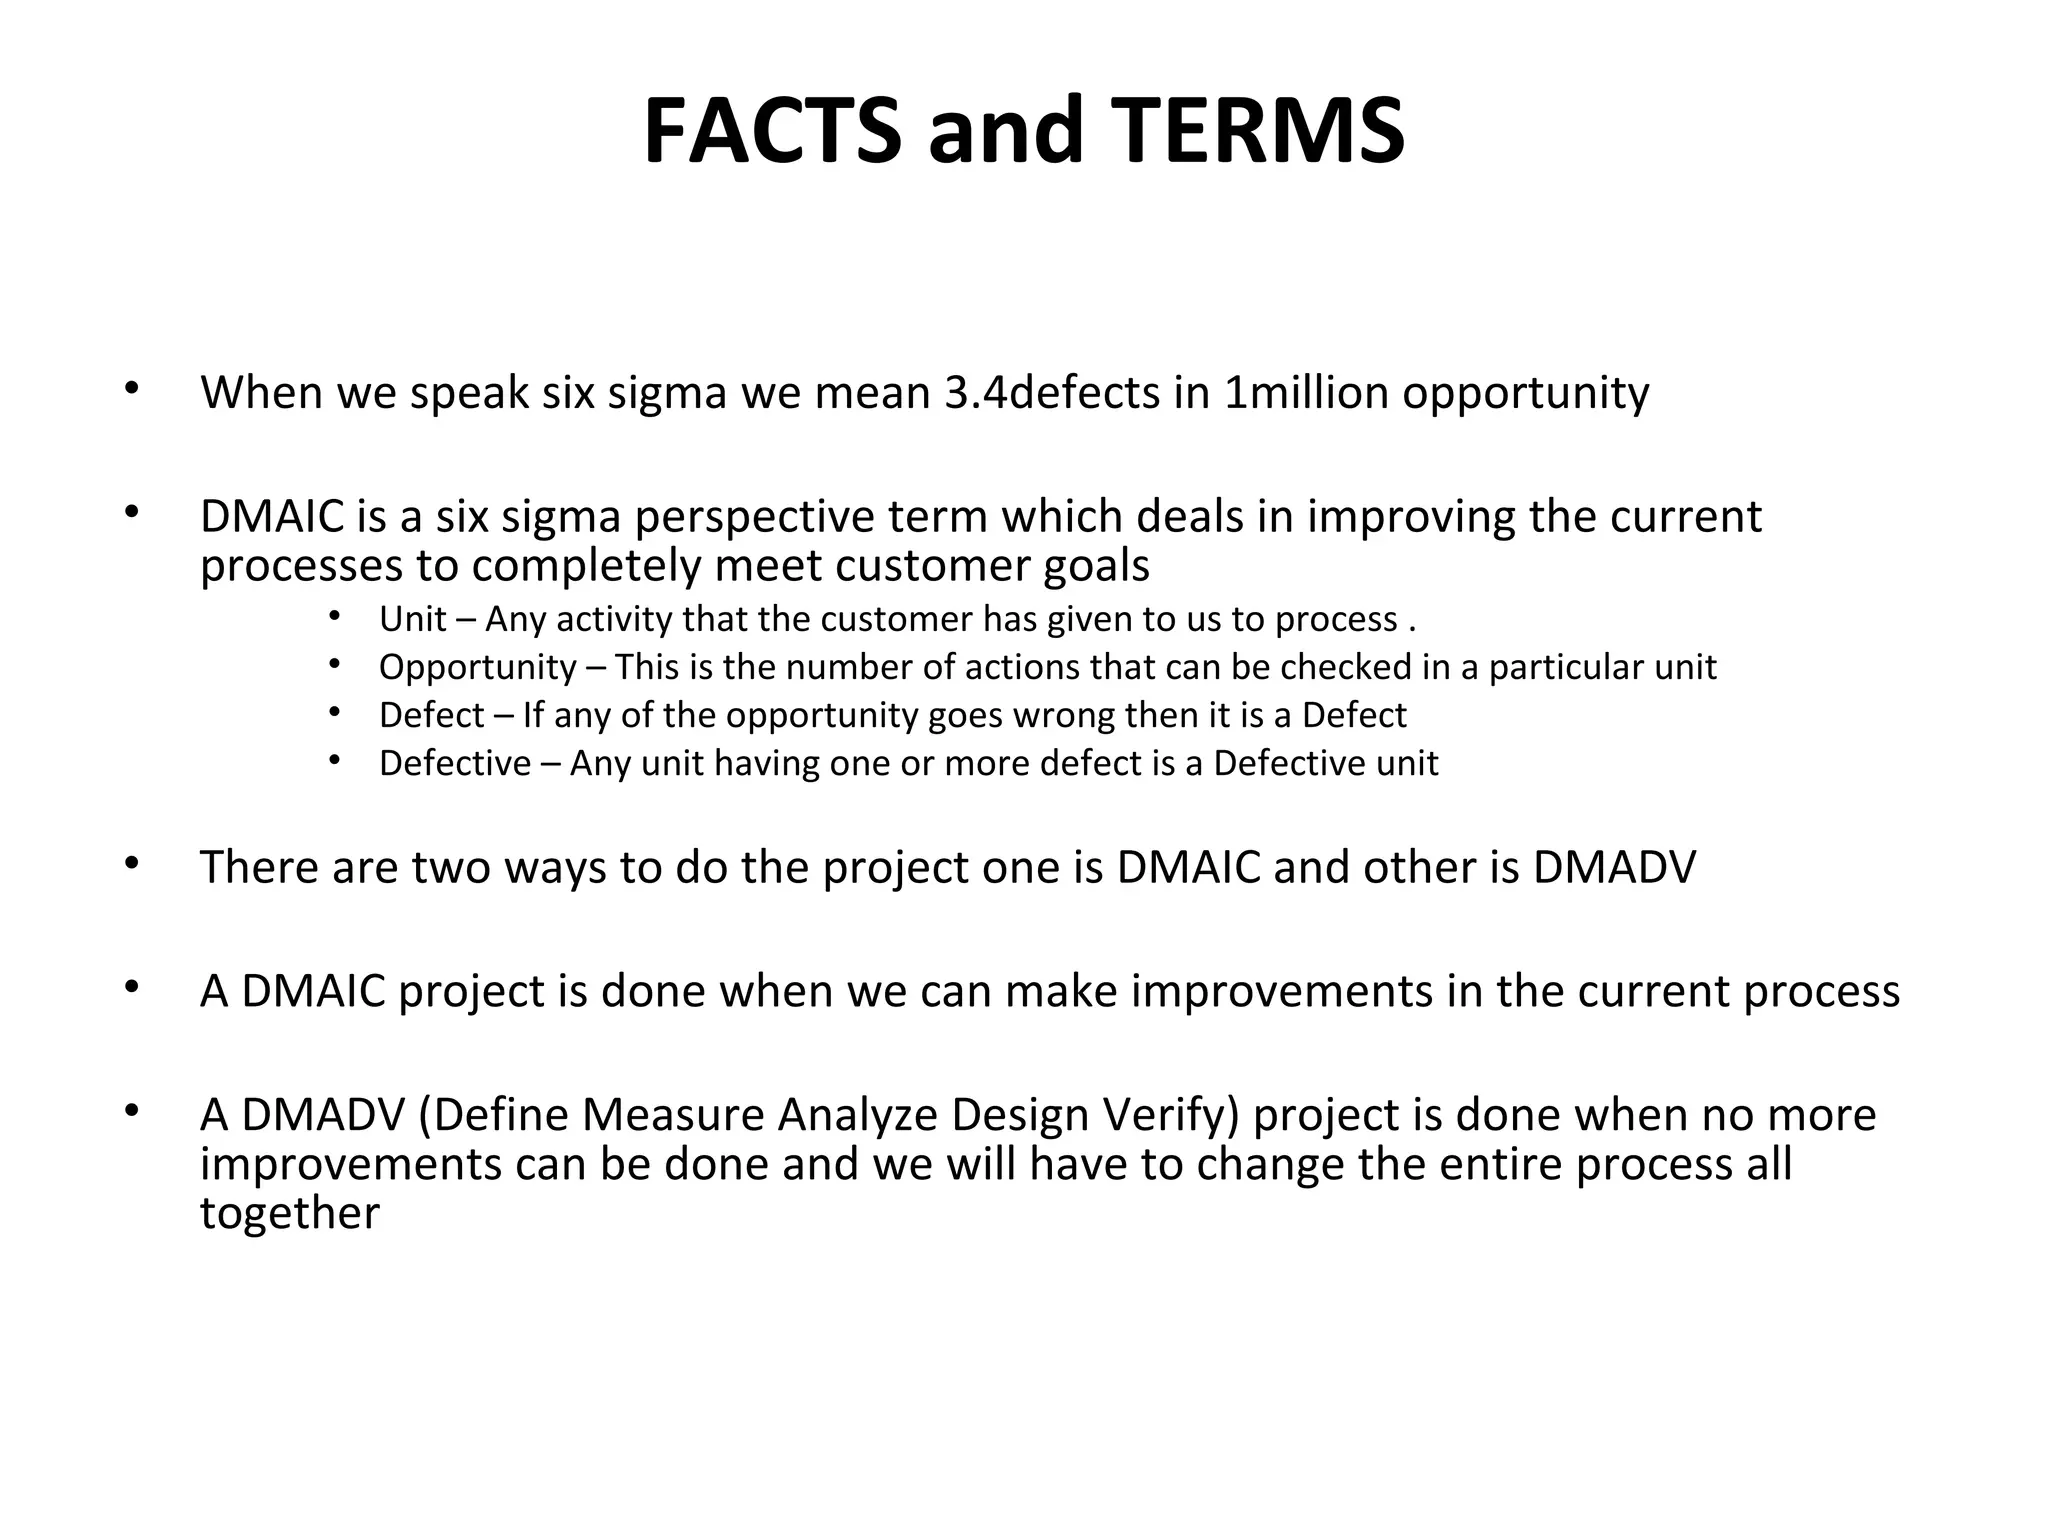
FACTS and TERMSWhen we speak six sigma we mean 3.4defects in 1million opportunity DMAIC is a six sigma perspective term which deals in improving the current processes to completely meet customer goals Unit – Any activity that the customer has given to us to process . Opportunity – This is the number of actions that can be checked in a particular unit Defect – If any of the opportunity goes wrong then it is a Defect Defective – Any unit having one or more defect is a Defective unit There are two ways to do the project one is DMAIC and other is DMADV A DMAIC project is done when we can make improvements in the current process A DMADV (Define Measure Analyze Design Verify) project is done when no more improvements can be done and we will have to change the entire process all together
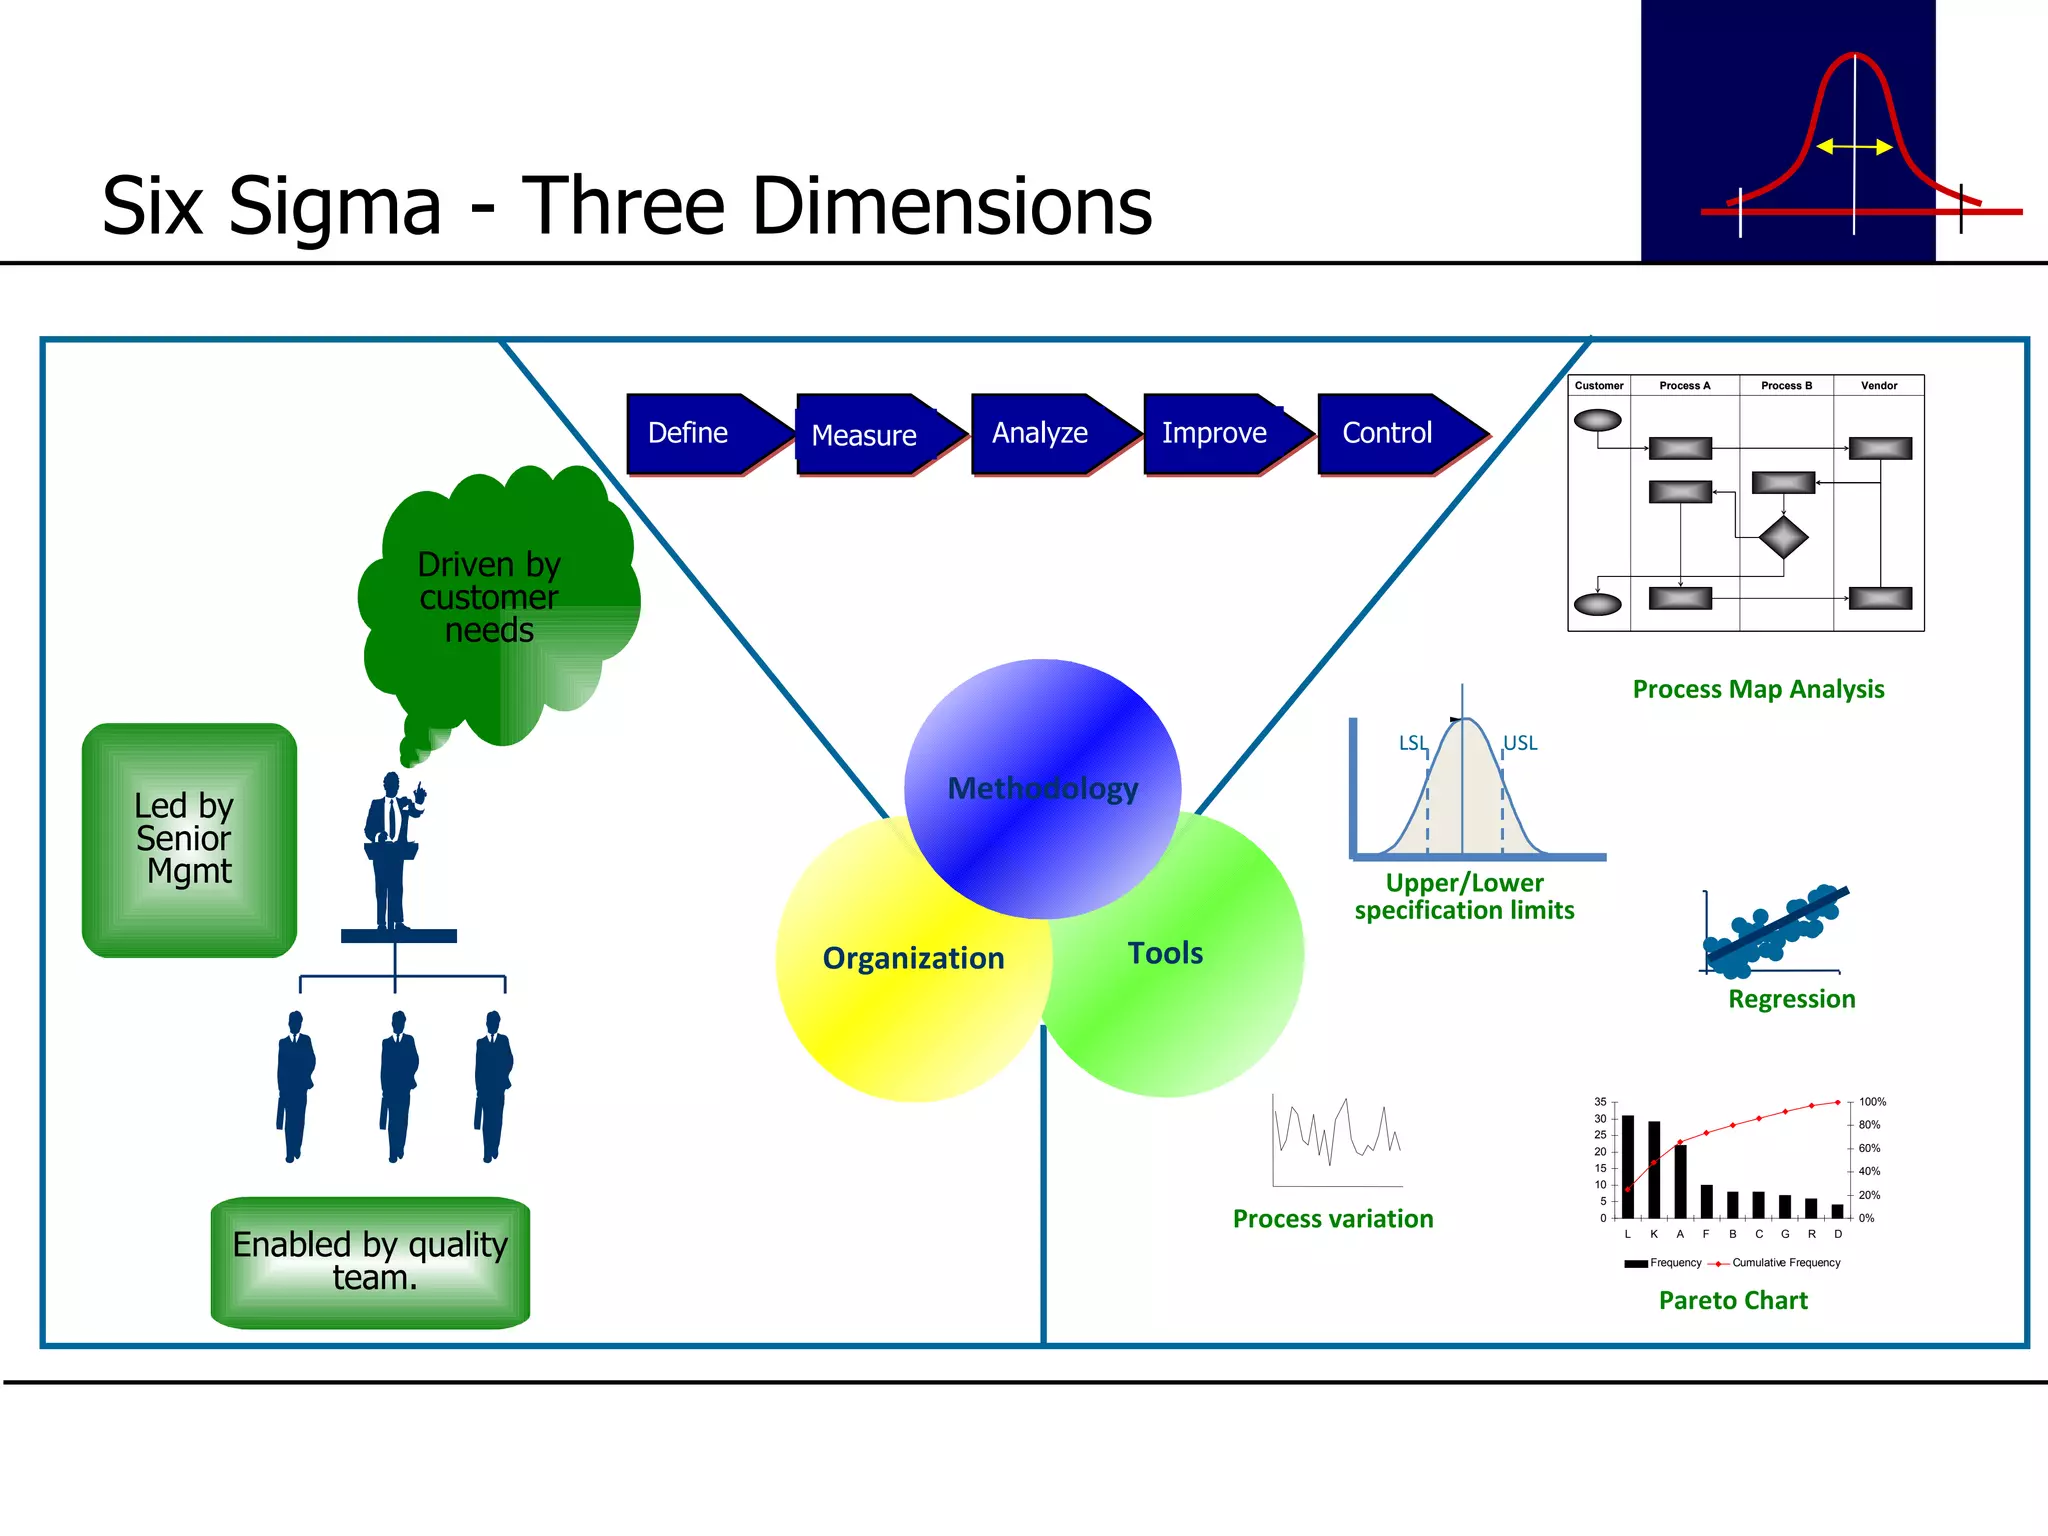
Six Sigma -Three Dimensions Tools Organization Methodology Driven by customer needs Enabled by quality team. Led by Senior Mgmt Define Measure Analyze Improve Control Process Map Analysis Pareto Chart Process variation LSL USL Upper/Lower specification limits Regression • • • • • • • • • • • • • • • • • • • • • • • • • • • • • • • • • • • • • • • • • • • • • •
33.
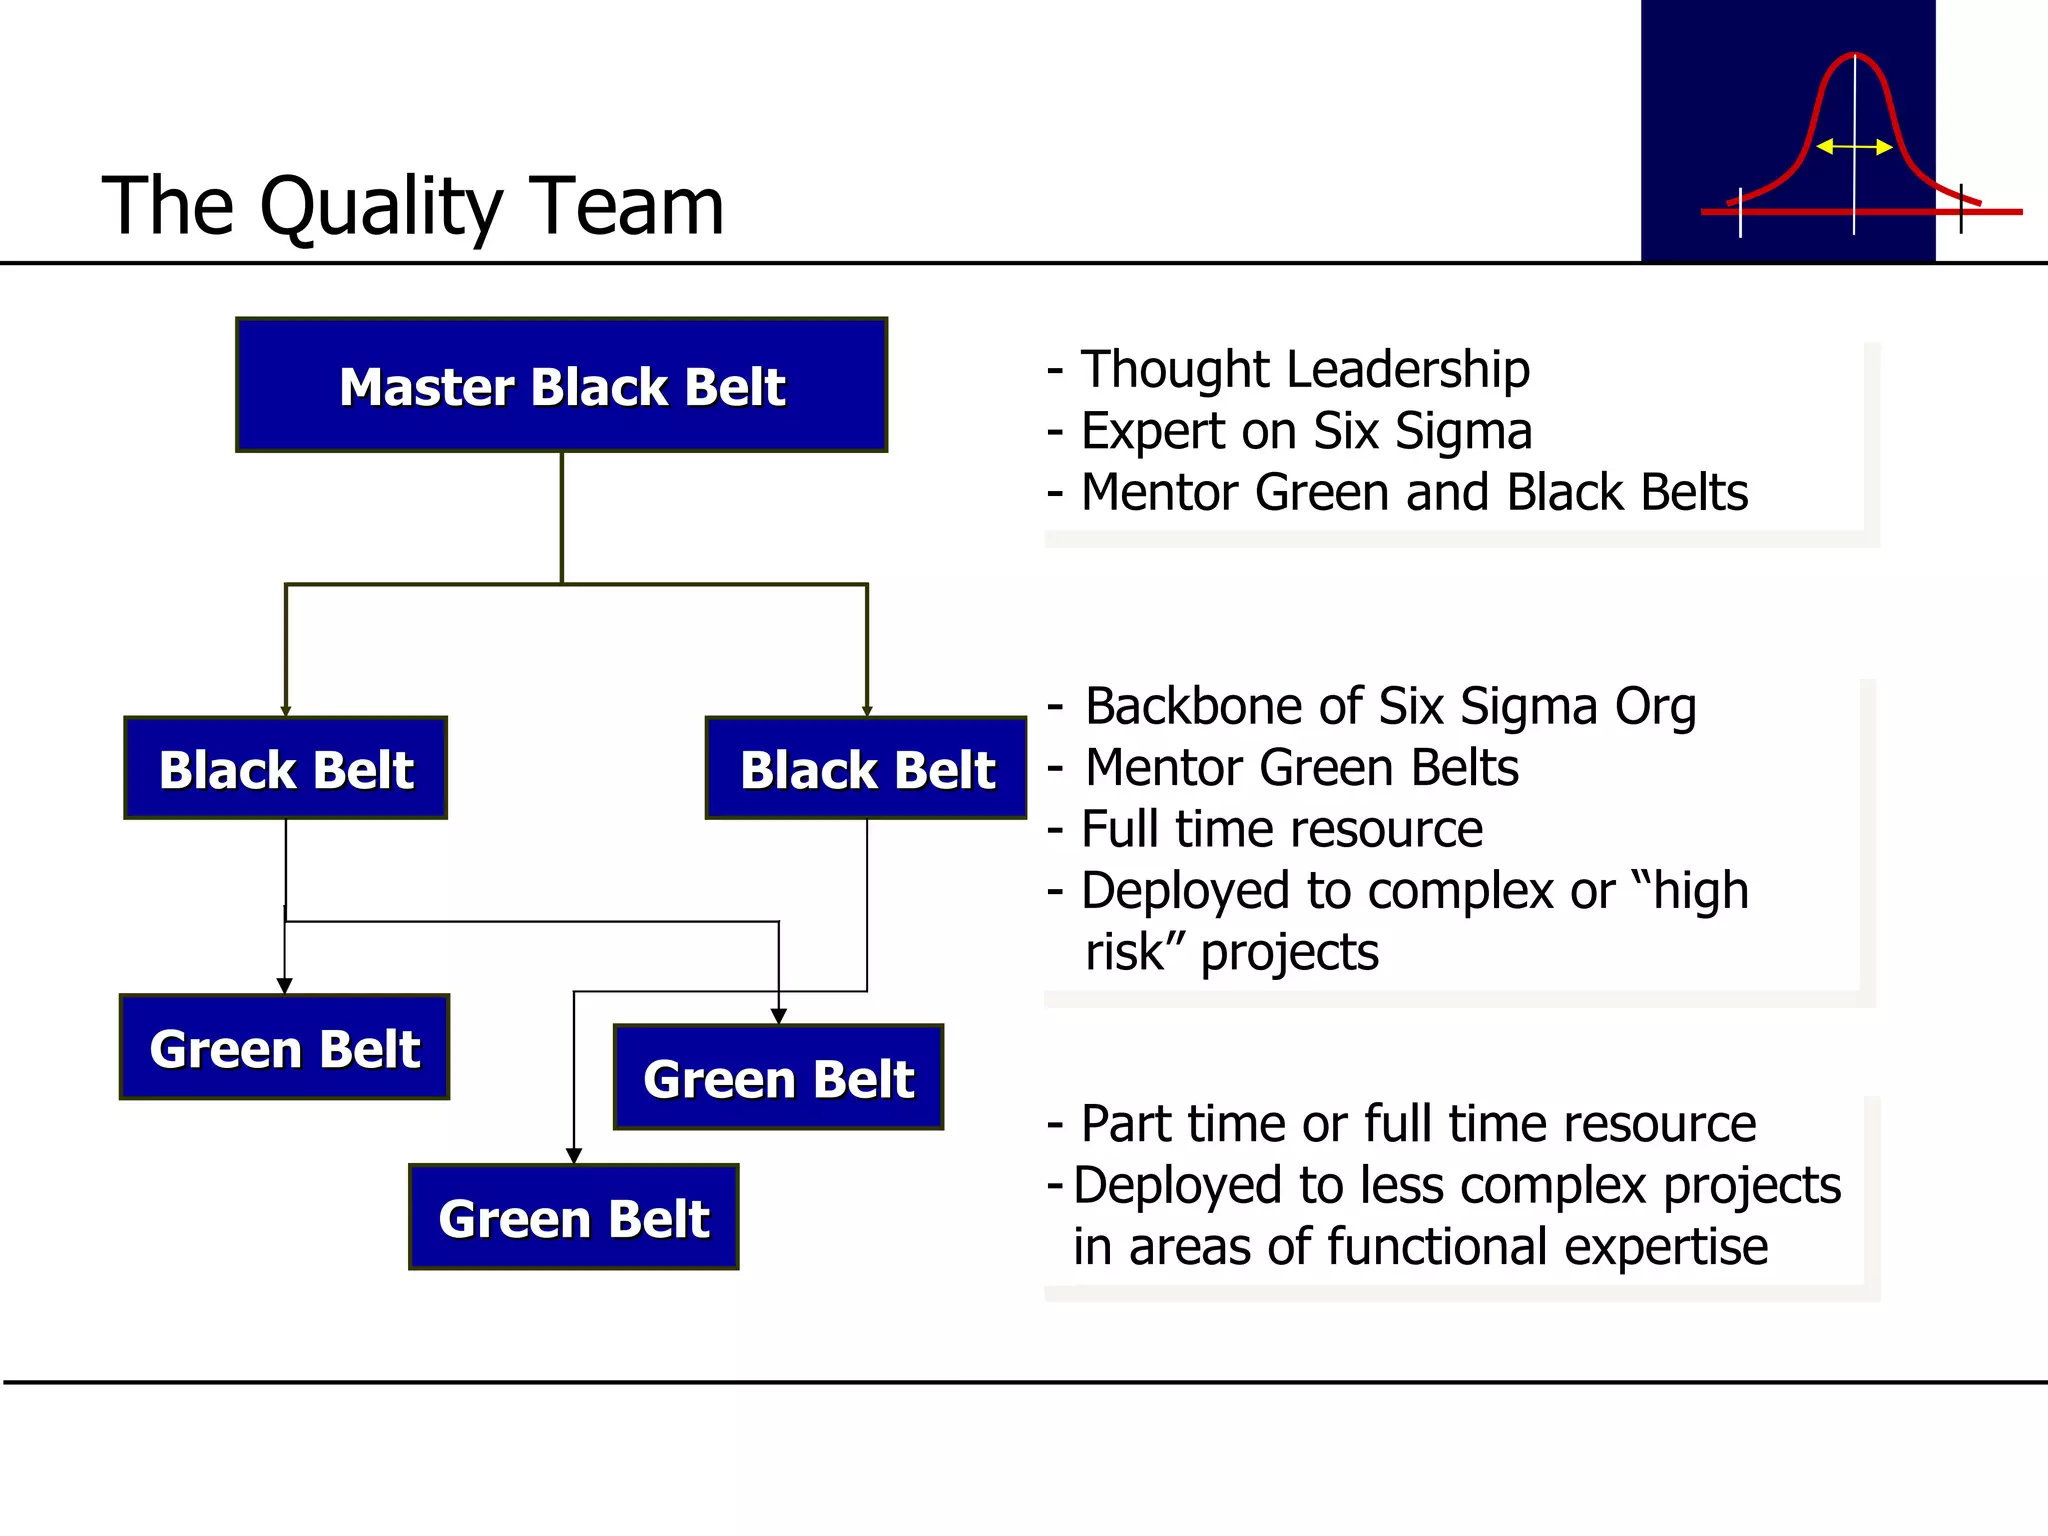
The Quality TeamMaster Black Belt Black Belt Black Belt Green Belt Green Belt Green Belt - Thought Leadership - Expert on Six Sigma - Mentor Green and Black Belts Backbone of Six Sigma Org Mentor Green Belts - Full time resource - Deployed to complex or “high risk” projects - Part time or full time resource Deployed to less complex projects in areas of functional expertise