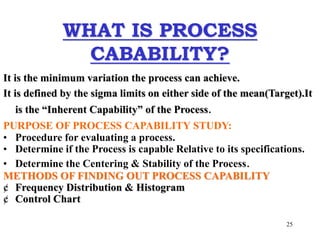
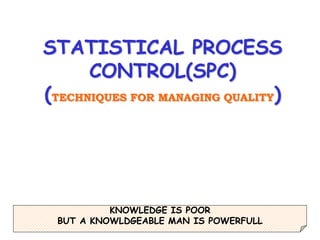
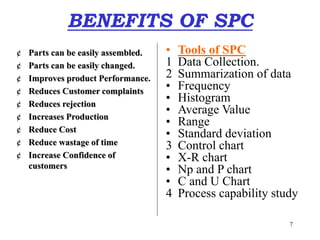
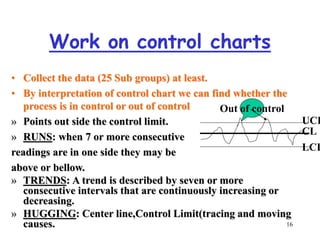
This document discusses statistical process control (SPC) techniques for managing quality. It covers various SPC methods including error detection, error prevention, and process control systems. The benefits of SPC include controlling processes, predicting behavior, avoiding waste, and achieving defect prevention. Key SPC tools include data collection, summarization using charts, histograms, and control charts to monitor processes and detect issues. The document also discusses process capability, measurement of variation, and using frequency distributions and histograms to analyze process capability.
Dear All, I have prepared this presentation to get a better understanding of Statistical Process Control (SPC). This is a very informative presentation and giving information about the History of SPC, the basics of SPC, the PDCA approach, the Benefits of SPC, application of 7-QC tools for problem-solving. You can follow this technique in your day to day business working to solve the problems. Thanking you.
The presentation is about basic statistical techniques and how statistics can be used effectively in the quality control and process control. It also presents statistical package Minitab version 16 and some of its applications in the field of statistical process control.
More https://quality.eqms.co.uk/blog/introduction-to-apqp
New to the advanced product quality planning framework?
Don't despair. In this article, Mike Bendall, Business Mentor at Qualsys, explains APQP, provides a checklist for each APQP phase, and there is a link to download his APQP training course for beginners.
Statistical process control is defined as and use of statistical technique to control a process or production method .It is used in manufacturing or production process to measure how consistently a product perform according to its design specification.
Using recycled concrete aggregates (RCA) for pavements is crucial to achieving sustainability. Implementing RCA for new pavement can minimize carbon footprint, conserve natural resources, reduce harmful emissions, and lower life cycle costs. Compared to natural aggregate (NA), RCA pavement has fewer comprehensive studies and sustainability assessments.
Saudi Arabia stands as a titan in the global energy landscape, renowned for its abundant oil and gas resources. It's the largest exporter of petroleum and holds some of the world's most significant reserves. Let's delve into the top 10 oil and gas projects shaping Saudi Arabia's energy future in 2024.
We have compiled the most important slides from each speaker's presentation. This year’s compilation, available for free, captures the key insights and contributions shared during the DfMAy 2024 conference.
HEAP SORT ILLUSTRATED WITH HEAPIFY, BUILD HEAP FOR DYNAMIC ARRAYS.
Heap sort is a comparison-based sorting technique based on Binary Heap data structure. It is similar to the selection sort where we first find the minimum element and place the minimum element at the beginning. Repeat the same process for the remaining elements.
NUMERICAL SIMULATIONS OF HEAT AND MASS TRANSFER IN CONDENSING HEAT EXCHANGERS...ssuser7dcef0
Power plants release a large amount of water vapor into the
atmosphere through the stack. The flue gas can be a potential
source for obtaining much needed cooling water for a power
plant. If a power plant could recover and reuse a portion of this
moisture, it could reduce its total cooling water intake
requirement. One of the most practical way to recover water
from flue gas is to use a condensing heat exchanger. The power
plant could also recover latent heat due to condensation as well
as sensible heat due to lowering the flue gas exit temperature.
Additionally, harmful acids released from the stack can be
reduced in a condensing heat exchanger by acid condensation. reduced in a condensing heat exchanger by acid condensation.
Condensation of vapors in flue gas is a complicated
phenomenon since heat and mass transfer of water vapor and
various acids simultaneously occur in the presence of noncondensable
gases such as nitrogen and oxygen. Design of a
condenser depends on the knowledge and understanding of the
heat and mass transfer processes. A computer program for
numerical simulations of water (H2O) and sulfuric acid (H2SO4)
condensation in a flue gas condensing heat exchanger was
developed using MATLAB. Governing equations based on
mass and energy balances for the system were derived to
predict variables such as flue gas exit temperature, cooling
water outlet temperature, mole fraction and condensation rates
of water and sulfuric acid vapors. The equations were solved
using an iterative solution technique with calculations of heat
and mass transfer coefficients and physical properties.
Student information management system project report ii.pdfKamal Acharya
Our project explains about the student management. This project mainly explains the various actions related to student details. This project shows some ease in adding, editing and deleting the student details. It also provides a less time consuming process for viewing, adding, editing and deleting the marks of the students.
Cosmetic shop management system project report.pdfKamal Acharya
Buying new cosmetic products is difficult. It can even be scary for those who have sensitive skin and are prone to skin trouble. The information needed to alleviate this problem is on the back of each product, but it's thought to interpret those ingredient lists unless you have a background in chemistry.
Instead of buying and hoping for the best, we can use data science to help us predict which products may be good fits for us. It includes various function programs to do the above mentioned tasks.
Data file handling has been effectively used in the program.
The automated cosmetic shop management system should deal with the automation of general workflow and administration process of the shop. The main processes of the system focus on customer's request where the system is able to search the most appropriate products and deliver it to the customers. It should help the employees to quickly identify the list of cosmetic product that have reached the minimum quantity and also keep a track of expired date for each cosmetic product. It should help the employees to find the rack number in which the product is placed.It is also Faster and more efficient way.
About
Indigenized remote control interface card suitable for MAFI system CCR equipment. Compatible for IDM8000 CCR. Backplane mounted serial and TCP/Ethernet communication module for CCR remote access. IDM 8000 CCR remote control on serial and TCP protocol.
• Remote control: Parallel or serial interface.
• Compatible with MAFI CCR system.
• Compatible with IDM8000 CCR.
• Compatible with Backplane mount serial communication.
• Compatible with commercial and Defence aviation CCR system.
• Remote control system for accessing CCR and allied system over serial or TCP.
• Indigenized local Support/presence in India.
• Easy in configuration using DIP switches.
Technical Specifications
Indigenized remote control interface card suitable for MAFI system CCR equipment. Compatible for IDM8000 CCR. Backplane mounted serial and TCP/Ethernet communication module for CCR remote access. IDM 8000 CCR remote control on serial and TCP protocol.
Key Features
Indigenized remote control interface card suitable for MAFI system CCR equipment. Compatible for IDM8000 CCR. Backplane mounted serial and TCP/Ethernet communication module for CCR remote access. IDM 8000 CCR remote control on serial and TCP protocol.
• Remote control: Parallel or serial interface
• Compatible with MAFI CCR system
• Copatiable with IDM8000 CCR
• Compatible with Backplane mount serial communication.
• Compatible with commercial and Defence aviation CCR system.
• Remote control system for accessing CCR and allied system over serial or TCP.
• Indigenized local Support/presence in India.
Application
• Remote control: Parallel or serial interface.
• Compatible with MAFI CCR system.
• Compatible with IDM8000 CCR.
• Compatible with Backplane mount serial communication.
• Compatible with commercial and Defence aviation CCR system.
• Remote control system for accessing CCR and allied system over serial or TCP.
• Indigenized local Support/presence in India.
• Easy in configuration using DIP switches.
2. 2
METHODS OF SPC
• ERROR DETECTION
(After the event)Tolerate Waste
ADJUST
• ERROR PREVENTION
(Before the event)Avoids wastage
Monitor adjust
Process Not OK
OK
InspectionMachine
Materials
Methods
Man
Process Not OK
OK
InspectionMachine
Materials
Methods
Man
Samples collected
/measured & analyzed
3. 3
What is Statistical
Process Control(SPC)?
• STATISTICAL: Taking of
measurements and arrangement
of those measurements in clear
pattern to allow prediction to be
made on performance.
» Data collection
» Data Presentation
» Data Analysis
» Data Interpretation /Drawing
Conclusions.
• PROCESS: Transformation
of input(4M & 1E) to desired
output through logical & inter-
linked Sequence of cause.
• CONTROL: Making
something to behave in way we
want it to behave.
» Define target
» Compare with target
» Measure actual performance
SPC is a technique of managing THE Quality Through error prevention.
(THE total performance of the process depends on Communication between customer & Supplier)
4. 4
Process
• About Process Performance :-
» By studying the process Output.
» By understanding the process itself
and its internal variability.
» Focus on process Characteristics.
• Action on the Process.:-
» Action on the process is frequently
Most Economical When Taken to
prevent the important
Characteristics (Process or output)
» Due to variation we
always problem, not
sleeping.
5. 5
Why use SPC?
¥ SPC is technique to control the Process .
¥ To know the special cause so as to Take corrective action.
¥ It gives Power to predict the behavior of the process .So as
to take corrective actions before actual happening (Gone out
of control).
¥ A more effective Method of working is to avoid waste by Not
Providing defective Parts in the First Place. This requires
everyone to concentrate on defect prevention Rather then
defect defection.
¥ SPC is a means by which to achieve the prevention Of
defects by highlighting situation when the output of process
is drifting.
¥ We can forecast things happening, Predict and take
corrective action I.e Preventive technique
¥ SPC is not superficial/ actual Req.. by customers.Generally
used on critical dimensions which directly may create
problem in our fitments and others.
6. 6
Process Control System
Statistical
Methods
THE way we work
/bending of resources Customers
Identifying
Changing, needs
and expectations
People
Equipment
Materials
Methods
Environment
Inputs Process/system Outputs
Voice of customers
Product/
services
Voice of
the process
1. Process control system is feed back system & SPCC is one type of that system.
2. It gives information about the performance,action on process,action on the output.
7. 7
BENEFITS OF SPC
¢ Parts can be easily assembled.
¢ Parts can be easily changed.
¢ Improves product Performance.
¢ Reduces Customer complaints
¢ Reduces rejection
¢ Increases Production
¢ Reduce Cost
¢ Reduce wastage of time
¢ Increase Confidence of
customers
• Tools of SPC
1 Data Collection.
2 Summarization of data
• Frequency
• Histogram
• Average Value
• Range
• Standard deviation
3 Control chart
• X-R chart
• Np and P chart
• C and U Chart
4 Process capability study
8. 8
BASIC CONCEPTS OF
STSTISTICS
• Variation is the LAW OF NATURE.As such No two
things are exactly alike.
• Variation in a Product or process can be measured.
• Things vary According to a definite Pattern.
• Whenever things of the same things are measured,A
large Group of the measurements Will tend to cluster
around the Middle.
• It is possible to determine the Shape Of THE
Distribution Curve for parts produced by any process.
9. 9
Nature of Variation
• There are two types of variation in a
process:
1 Due to large number of unknown causes
(Natural/Common Causes).
2 Due to special Causes(Assignable Causes).
10. 10
Assignable (Special)
Causes are Those Which:
• Are Unrelated to THE intended Design of
process.
• Do not Affect everyone.
• Are Unpredictable & Temporary.
Examples:-
Material Variation
Poor Maintenance
Electrical Power surge
New Methods/Procedures
Untrained Operator
11. 11
NATURAL (COMMON CUASES)
• Common causes of variations are inherently
part of the System/Process.
• Affect everyone associated with process.
• Predictable
Examples:-
• Procedure & Method used
• Education & Training given
• Machine Movement
12. 12
Preconditions for collecting
attribute data .
• Establish a clear reference standards (limit samples)
• Visual reference to demonstrate .”acceptable or non
acceptable”.
• Communicate the standards to appropriate personnel.
• Ensure that assessment Personal have appropriate
faculty & aptitudes .
• Train & develop Personal.
• Ensure correct environment for the task
• Verifying the gauging equipment.
• Encourage everyone to keep to the standard.
13. 13
CONTROL CHARTS
• It is a special type of trend chart
with limits specifically used to
assess and maintain stability of the
process
• This indicates whether the process
variation is natural and expected
(chance variation) or due to special
causes.
• Control limit theorem :it states
even if the outcome of the process/total
population is not normally distribution
but samples /average is always
distribution charts.
CL(Control limit)
OUT OF CONTROL PROCESS
UCL(UPPER Control lim
LCL(Lower Control limit)
1 2 3 4 5 6 7 8
ITEM NO.
5.25
5
4.75
cm.
14. 14
ADVANTAGE OF CONTROL CHART
• It gives a pictorial view of the process or
performance.
• It tells at a glance if a process is behaving
naturally or not.
• It is a tool to detect the pressure of assignable
cause in a process.
• It tells when a process should be corrected &
when it should be left alone.
15. 15
TYPES OF CONTROL CHARTS
• VARIABLE DATA: Which can
take up any value
example:Length,Weight,Temp,etc.
• Data collection is done by
measurements.
• TYPE OF CHART USED:
X-R CHART
• ATTRIBUTE DATA:
Which are classified as good
or bad,OK or Not OK
• data collection is
done by counting.
• FOR DEFFECTIVE
: P AND Np
• FOR DEFECTS : C
OR U
A DEFECT is a blemish flaw or non -conformity which causes an item to be rejected.e.g. dent, Paint
blemish, Scratch,Blow Holes. It is possible to have more than one defect on one single item.
A DEFCETIVE is a component or item which is unacceptable to use.
16. 16
Work on control charts
• Collect the data (25 Sub groups) at least.
• By interpretation of control chart we can find whether the
process is in control or out of control
» Points out side the control limit.
» RUNS: when 7 or more consecutive
readings are in one side they may be
above or bellow.
» TRENDS: A trend is described by seven or more
consecutive intervals that are continuously increasing or
decreasing.
» HUGGING: Center line,Control Limit(tracing and moving
causes.
CL
UCL
LCL
Out of control
17. 17
Benefits Of Control Charts
• Easier to understand by any person what is going on process.
• Help the process Performance Consistently,Predictability for
Quality And Cost.
• Allow the Process to Achieve.
• Higher Quality
• Lower Quality
• Lower Unit Cost
• Higher Effective Capacity
• Providing A common language for discussing the performance of
the project.
• Distinguish between Special & common Causes.
18. 18
STEPS FOR X-R CHART
• Determine the size of sample group.
• Design a suitable tally sheet.
• Collect data under standard operating
conditions(without adjustments)
• Calculate the average (x) and range(R,
the difference between the largest &
the smallest value in the group)
• Calculate the average of average-x
• Calculate the average range -R
• Calculate the control limits for for the x
chart using the formula
UCL=X + A2*R
LCL=X - A2*R
* Values of A2 for more common group size
are
• Calculate the control limits for the
R_Chart Using.
UCL = D3 * XR
UCL = D4 * XR
Values of D3,D4 for common sample group
sizes are given in the table.
• Divide the graph into two portions for 1) X
Chart & 2) R Chart
• Periodic observation are taken on X-axis and X
& R on Y-axis
• Select Appropriate scales and draw central lines
and control limits.
• Plot the observation and look out for indication
of the process going out of control or other
trends.
The steps involved in setting up control chart for variable X & R charts are:
19. 19
VALUES OF A2,D3 AND D4
NO OF
INSPECTION
TAKEN
A2 D3 D4
4 0.729 0 2.282
5 0.577 0 2.115
6 0.483 0 2.004
8 0.373 0.136 1.864
10 0.308 0.223 1.777
20. 20
PAND Np CHART
• P- Chart
C.L =P
P= Number of defectives
Total checked
UCL=P+3(P(1-P)/n)^2
LCL =P-3(P(1-P)/n)^2
Take LCL =0 when its value is negative
These charts are utilized for ‘Defective’ :
P Chart:when the sample is constant /Np Chart:When the sample size is varying
• Np- Chart
C.L =Np
Np= Number of defectives
No. of Samples Taken
UCL=Np+[3Np(1-Np)/n]^2
UCL=Np- [3Np(1-Np)/n]^2
Take LCL =0 when its value is
negative
21. 21
C And U - CHART
• C Chart:
C.L.=C
C =Total no of defects
Total Number of Samples(n)
UCL=C+(3C)^2
LCL=C-(3C)^2
Take LCL =0 when its value is
negative
• U Chart
These Charts are utilized for controlling ‘Defects’
C: Charts are used for products of constant size .
U: Charts are used for products of Varying size
C.L.=U
U =Total no of defects
Number
Checked
UCL=U+3(U/n)^2
LCL=U-3(U/n)^2
Take LCL =0 when its value is
negative
22. 22
Variation is Measured By:
Range Value
Standard Deviation(Sigma)
1. Range = Max.(value) - Min.(value)
Data: 10$$$,11,10,12,13,10.6
Range: 13 - 10 = 3
2. Standard Deviation ($) = {sum of(x-x)^2/n}^.5
23. 23
Measurement of things of
THE same kind
34.13% 34.13%
13.6%13.6%
2.14%2.14%
0.13%
0.13% X-1$ +1$ +2$ +3$-2$-3$
Area showing
total population.
24. 24
Analysis of Curve
• If a part is taken out at THE random,THE chances are that
68.16 Out of 100 Measurements (34.13%+34.13%) will fall
within two mid-section of THE graph.
• THE chances are that 27.2 out of 100 PCs. (13.6%+13.6%)
will fall in THE next sections.
• THE chances are That 4.28 out of 100 PCs. (2.14%+2.14%)
will fall into THE subsequent two sections.
• And 0.26 out of 100 PCs. (0.13%+0.13%) will fall in outside
two sections.
25. 25
WHAT IS PROCESS
CABABILITY?
It is the minimum variation the process can achieve.
It is defined by the sigma limits on either side of the mean(Target).It
is the “Inherent Capability” of the Process.
PURPOSE OF PROCESS CAPABILITY STUDY:
• Procedure for evaluating a process.
• Determine if the Process is capable Relative to its specifications.
• Determine the Centering & Stability of the Process.
METHODS OF FINDING OUT PROCESS CAPABILITY
¢ Frequency Distribution & Histogram
¢ Control Chart
26. 26
Cp & Cpk process capability
Indices
• Cp
-COMPARE PROCESS SPREAD THE
SPECIFICATION WIDTH
-IS USED WITH TWO SIDED SPECI.
-WANT TO FIT AT LEAST 8$
Cp = (Usl-Lsl)/6$
WANT Cp > 1.67
Useful measures for management to assess “health” of process.
Need to know that the process is stable (in control), the Process center(x) the process variability $(sigma)
Cp & Cpk MEASURE THE PROCESS CAPABILITY W.R.T THE CUSTOMER REQD.
Lsl Usl
6$
8$
3$
Lsl Usl
• Cpk
-ADDRESSES BOTH CENTERING AND
SPREAD V/S SPEC.
WANT CENTER AT LEAST 3-S FROM
SPEC.
Cpk = MINIMUM OF (Usl-X)/3S,(X-
Lsl)/3S
WANT Cpk > 1.33
27. 27
Methods of finding out
process capability
• FREQUENCY DISTRIBUTION &
HISTOGRAM
• CONTROL CHART
28. 28
Frequency Distribution
and Histogram
STEPS:
• Collect 50 consecutive samples From a running Process &
Record THE measured value of Quality Characteristics.
• Make frequency Distribution Chart and Histogram & check if
the Distribution is normal or Not.
• If distribution is not normal analyze the process Find out the
root cause of the problem and eliminate the root cause.
• Take fresh data of consecutive 50 Samples & repeat steps 2 & 3
stated above
• When distribution is normal calculate value of 6$,and also Cp
and Cpk.
• It can be characterized by
Location:-> Most frequently occurring value.
Spread :-> Span of values form smallest to largest.
Shape :->THE pattern of variation.
TIR:->Total indicating reading.
29. 29
• Definition:
THE voice of THE customers into
Engg.(D/G) Requirements & Measurements
Parts requirements & Measurements
Processes requirements & Measurements
Prod. Requirements & Measurements.
Quality Function
Deployment (QFD)
(Product planning)
(Per system identification)
(Process planning)
(Production planning)
Benefits:-
•Higher customer satisfaction & Excitement.
•Quick Transfer of knowledge to new Engineer's.
•Makes Good Engineer’s into excellent Engineer’s.