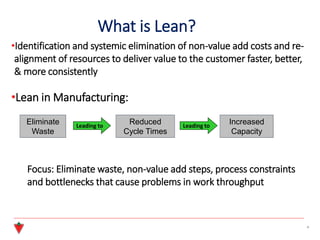
What is Lean?
•Identificationand systemic elimination of non-value add costs and re-
alignment of resources to deliver value to the customer faster, better,
& more consistently
•Lean in Manufacturing:
Focus: Eliminate waste, non-value add steps, process constraints
and bottlenecks that cause problems in work throughput
4
Leading to Leading to
Eliminate
Waste
Reduced
Cycle Times
Increased
Capacity
5.
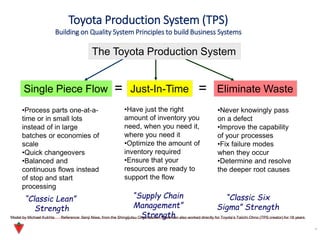
Toyota Production System(TPS)
Building on Quality System Principles to build Business Systems
5
Single Piece Flow Just-In-Time Eliminate Waste
•Process parts one-at-a-
time or in small lots
instead of in large
batches or economies of
scale
•Quick changeovers
•Balanced and
continuous flows instead
of stop and start
processing
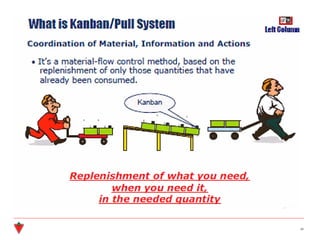
•Have just the right
amount of inventory you
need, when you need it,
where you need it
•Optimize the amount of
inventory required
•Ensure that your
resources are ready to
support the flow
•Never knowingly pass
on a defect
•Improve the capability
of your processes
•Fix failure modes
when they occur
•Determine and resolve
the deeper root causes
= =
The Toyota Production System
Model by Michael Kukhta Reference: Senji Niwa, from the Shingijutsu Organization. Niwa-san also worked directly for Toyota’s Taiichi Ohno (TPS creator) for 18 years.
“Classic Lean”
Strength
“Supply Chain
Management”
Strength
“Classic Six
Sigma” Strength
6.
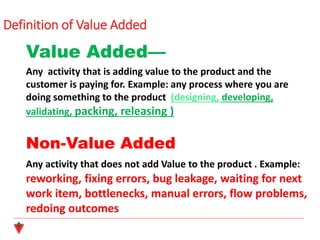
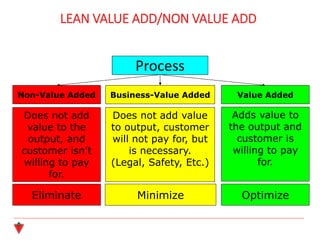
Definition of ValueAdded
Value Added—
Any activity that is adding value to the product and the
customer is paying for. Example: any process where you are
doing something to the product (designing, developing,
validating, packing, releasing )
Non-Value Added
Any activity that does not add Value to the product . Example:
reworking, fixing errors, bug leakage, waiting for next
work item, bottlenecks, manual errors, flow problems,
redoing outcomes
7.
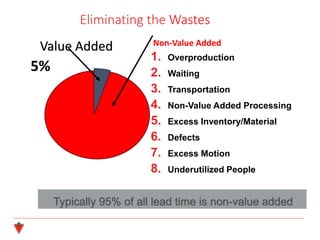
Eliminating the Wastes
ValueAdded
Typically 95% of all lead time is non-value added
1. Overproduction
2. Waiting
3. Transportation
4. Non-Value Added Processing
5. Excess Inventory/Material
6. Defects
7. Excess Motion
8. Underutilized People
Non-Value Added
5%
8.
| | 8
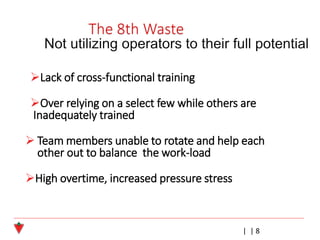
➢Lackof cross-functional training
➢Over relying on a select few while others are
Inadequately trained
➢ Team members unable to rotate and help each
other out to balance the work-load
➢High overtime, increased pressure stress
9.
Process
Value Added
Adds valueto
the output and
customer is
willing to pay
for.
Optimize
Non-Value Added
Does not add
value to the
output, and
customer isn’t
willing to pay
for.
Eliminate
Business-Value Added
Does not add value
to output, customer
will not pay for, but
is necessary.
(Legal, Safety, Etc.)
Minimize
LEAN VALUE ADD/NON VALUE ADD
10.
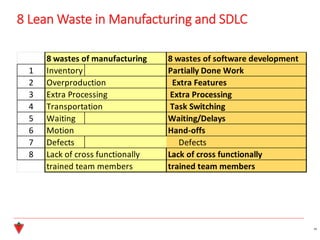
8 Lean Wastein Manufacturing and SDLC
10
8 wastes of manufacturing 8 wastes of software development
1 Inventory Partially Done Work
2 Overproduction Extra Features
3 Extra Processing Extra Processing
4 Transportation Task Switching
5 Waiting Waiting/Delays
6 Motion Hand-offs
7 Defects Defects
8 Lack of cross functionally Lack of cross functionally
trained team members trained team members
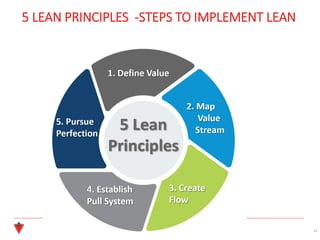
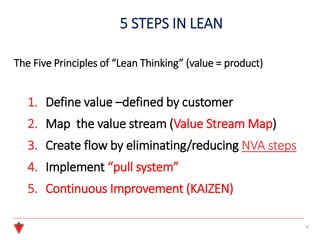
5 STEPS INLEAN
The Five Principles of “Lean Thinking” (value = product)
1. Define value –defined by customer
2. Map the value stream (Value Stream Map)
3. Create flow by eliminating/reducing NVA steps
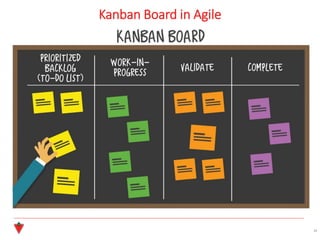
4. Implement “pull system”
5. Continuous Improvement (KAIZEN)
12
13.
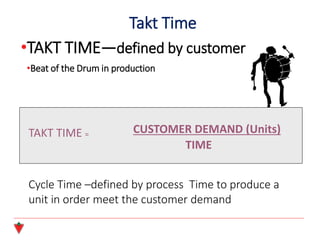
Takt Time
•TAKT TIME—definedby customer
•Beat of the Drum in production
CUSTOMER DEMAND (Units)
TIME
TAKT TIME =
Cycle Time –defined by process Time to produce a
unit in order meet the customer demand
14.
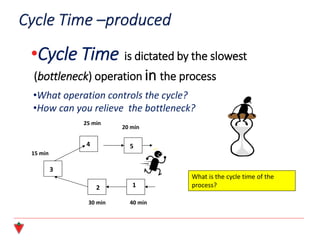
•Cycle Time isdictated by the slowest
(bottleneck) operation in the process
40 min
20 min
25 min
15 min
30 min
1
5
4
3
2
•What operation controls the cycle?
•How can you relieve the bottleneck?
What is the cycle time of the
process?
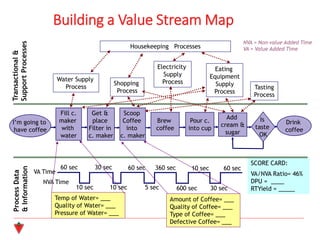
VA/NVA Ratio= 46%
DPU= ____
RTYield = _____
SCORE CARD:
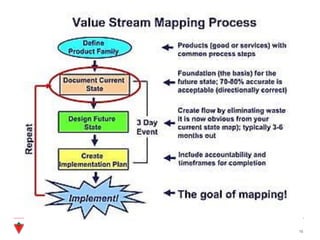
Building a Value Stream Map
I’m going to
have coffee
Fill c.
maker
with
water
Scoop
Coffee
into
c. maker
Get &
place
Filter in
c. maker
Drink
coffee
Is
taste
OK
Brew
coffee
Pour c.
into cup
Add
cream &
sugar
Water Supply
Process
Shopping
Process
Electricity
Supply
Process
Eating
Equipment
Supply
Process
Tasting
Process
Housekeeping Processes
Transactional
&
Support
Processes
Process
Data
&
Information
NVA = Non-value Added Time
VA = Value Added Time
VA Time
NVA Time
Temp of Water= ___
Quality of Water= ___
Pressure of Water= ___
Amount of Coffee= ___
Quality of Coffee= ___
Type of Coffee= ___
Defective Coffee= ___
60 sec 30 sec 60 sec 360 sec 10 sec 60 sec
10 sec 10 sec 5 sec 600 sec 30 sec
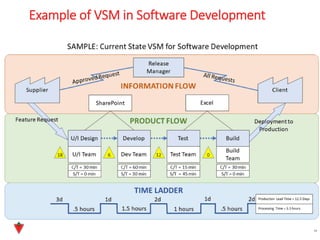
Example of VSMin Software Development
19
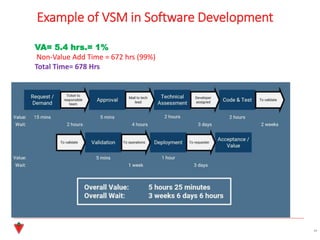
VA= 5.4 hrs.= 1%
Non-Value Add Time = 672 hrs (99%)
Total Time= 678 Hrs
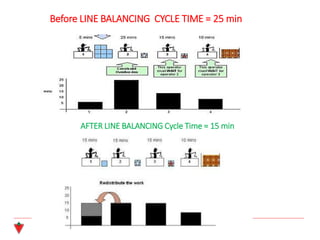
20.
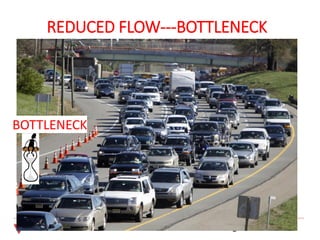
•Bottleneck
•Slowest process step,slows down the entire line
•Has the longest cycle time
•Bottleneck reduces FLOW , create delays
•A bottleneck WILL exist in every process
•Increased WIP is leading indicator of bottleneck
•Bottlenecks can be improved by line balancing
splitting the workload for that station, (next
slide)
Bottleneck Management
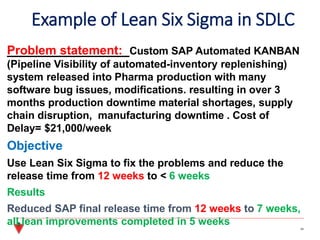
Example of LeanSix Sigma in SDLC
Problem statement: Custom SAP Automated KANBAN
(Pipeline Visibility of automated-inventory replenishing)
system released into Pharma production with many
software bug issues, modifications. resulting in over 3
months production downtime material shortages, supply
chain disruption, manufacturing downtime . Cost of
Delay= $21,000/week
Objective
Use Lean Six Sigma to fix the problems and reduce the
release time from 12 weeks to < 6 weeks
Results
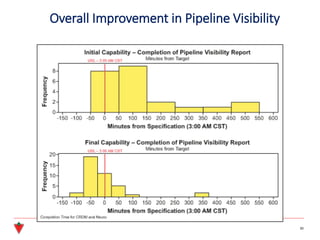
Reduced SAP final release time from 12 weeks to 7 weeks,
all lean improvements completed in 5 weeks 24
25.
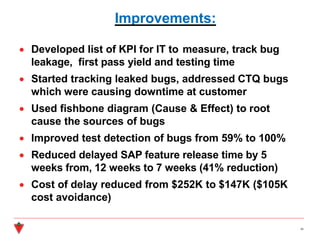
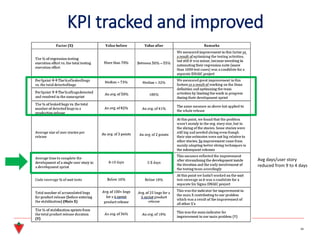
Improvements:
• Developed listof KPI for IT to measure, track bug
leakage, first pass yield and testing time
• Started tracking leaked bugs, addressed CTQ bugs
which were causing downtime at customer
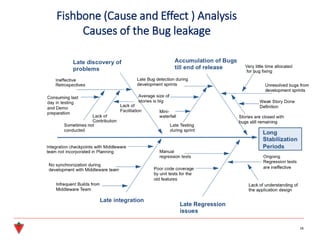
• Used fishbone diagram (Cause & Effect) to root
cause the sources of bugs
• Improved test detection of bugs from 59% to 100%
• Reduced delayed SAP feature release time by 5
weeks from, 12 weeks to 7 weeks (41% reduction)
• Cost of delay reduced from $252K to $147K ($105K
cost avoidance)
25
26.
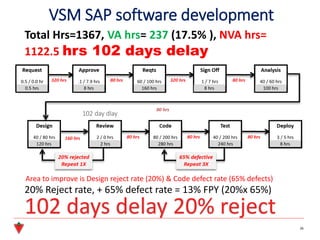
VSM SAP softwaredevelopment
26
20% Reject rate, + 65% defect rate = 13% FPY (20%x 65%)
Total Hrs=1367, VA hrs= 237 (17.5% ), NVA hrs=
1122.5 hrs 102 days delay
Area to improve is Design reject rate (20%) & Code defect rate (65% defects)
102 day dlay
102 days delay 20% reject
27.
27
Date :
24 24
NO
QC
TestPass
24
0.1 VA 24.00 50.0 18 72
5.0 VA 4.0 3.0 8 8
48.0 NVA 48.0 4.0 24 2
53.1 76.00 57.00 50 82
Weeks=
NVATime 24 10 7.0 24 NVA (hrs)= 209.0
Hours Tota hrs = 319.1
VA Time 50.0 1 VA (hrs)= 110.1
Hours
Total Time =
Hours
74.0
Run live production tests
Process Time=
Demo customer
Packaging
53.1 76.00 203.1
Validate data
Run Bug Leak Test
48.0 48.0 48
5.1 28.0 26.0
Process Time= Process Time= Process Time=
8.0
Define Acceptance
Criteria
Create story UFI Test
Regression Test -fix bugs
Regression Test/
Fix Bugs
Environment test
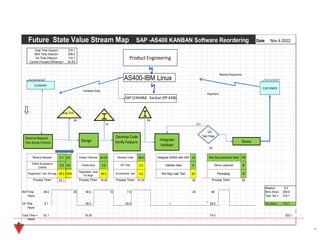
VA Time (Hours)= 110.1
Current Process Efficiency= 34.5%
Receive Request Design Features Develop Code Integrate AS400 with SAP
10
Future State Value Stream Map SAP -AS400 KANBAN Software Reordering Nov 4 2022
Total Time (hours)= 319.1
NVA Time (Hours)= 209.0
Customer
CUSTOMER
Product Engineering
Receive Request
Dev Accep Criteria Design
Develop Code
Verify Feature
Weekly Payments
Payment
Validate Date
Demo
AS400-IBM Linux
Bug Test
Integrate
Validate
SAP S/4HANA Kanban (PP-KAB)
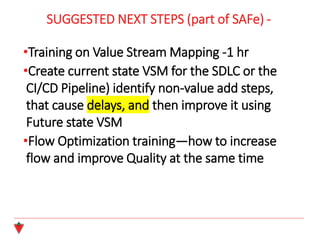
SUGGESTED NEXT STEPS(part of SAFe) -
•Training on Value Stream Mapping -1 hr
•Create current state VSM for the SDLC or the
CI/CD Pipeline) identify non-value add steps,
that cause delays, and then improve it using
Future state VSM
•Flow Optimization training—how to increase
flow and improve Quality at the same time