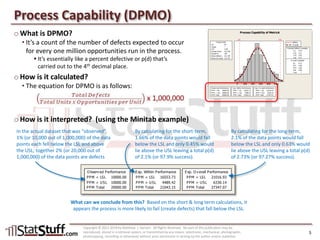
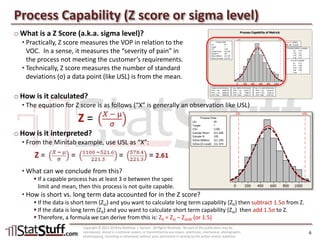
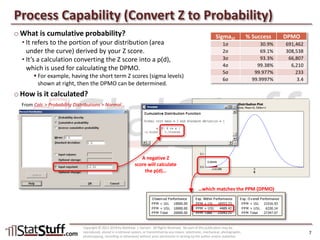
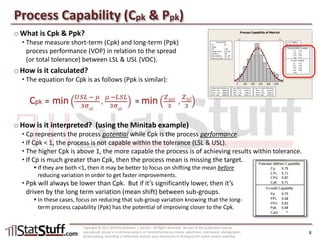
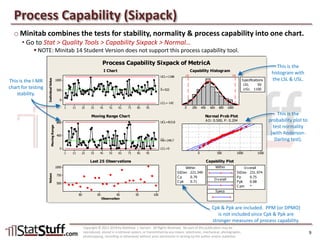
SlideShare a Scribd company logo
Section & Lesson #:
Pre-Requisite Lessons:
Complex Tools + Clear Teaching = Powerful Results
Process Capability: Step 4 (Normal Dist)
Six Sigma-Analyze โ€“ Lesson 5
As part of a series about process capability, this lesson shows how to assess
the capability of a process thatโ€™s based on a normal distribution.
Six Sigma-Analyze #04 โ€“ Process Capability: Steps 1 to 3
Copyright ยฉ 2011-2019 by Matthew J. Hansen. All Rights Reserved. No part of this publication may be reproduced, stored in a retrieval system, or transmitted by any means
(electronic, mechanical, photographic, photocopying, recording or otherwise) without prior permission in writing by the author and/or publisher.
Process Capability Review
o What is process capability?
โ€ข As the โ€œVoice of the Processโ€ (VOP), it
represents a standard set of metrics
that define how a process is performing
(its capability).
o How do we calculate the process capability?
โ€ข This illustration at right shows the
steps and tools you can use to
calculate process capability.
Copyright ยฉ 2011-2019 by Matthew J. Hansen. All Rights Reserved. No part of this publication may be
reproduced, stored in a retrieval system, or transmitted by any means (electronic, mechanical, photographic,
photocopying, recording or otherwise) without prior permission in writing by the author and/or publisher.
2
Process Capability
(Voiceof ProcessorVOP)
Customer Requirements
(Voiceof CustomerorVOC)
PerformanceGap
between VOC & VOP
Actual
Process
Performance
Define
(GetVOC)
Measure
(GetVOPData)
Analyze
(AnalyzeGap)
Improve
(Fix Gap)
Control
(Sustain Fix)
Capability Analysis (Normal Dist)
o Follow the next set of steps when the following conditions exist in the data:
โ€ข Data type = Continuous
โ€ข Process = Stable
โ€ข Distribution = Normal
o How do I calculate the process capability?
โ€ข The example below is run on โ€œMetricAโ€ field in the Minitab 15 Sample Data v1.MPJ file:
๏‚ง NOTE: Minitab 14 Student Version does not support this process capability calculation. Follow instructions
later on how to manually calculate the process capability.
Copyright ยฉ 2011-2019 by Matthew J. Hansen. All Rights Reserved. No part of this publication may be
reproduced, stored in a retrieval system, or transmitted by any means (electronic, mechanical, photographic,
photocopying, recording or otherwise) without prior permission in writing by the author and/or publisher.
3
From Stat > Quality Tools > Capability Analysis > Normalโ€ฆ
Identify the field used for measuring the
process (probably the project Y).
Use โ€œ1โ€ for subgroup size. See the Measure
phase lesson on โ€œRational Sub-Groupingโ€ for
more details.
Type in the customerโ€™s requirements (VOC) in
terms of an upper and/or lower spec limit.
An Example from Minitab
o Below is the output from Minitab.
โ€ข This output introduces several new HIGHLIGHTED terms & concepts that weโ€™ll begin to explore.
Copyright ยฉ 2011-2019 by Matthew J. Hansen. All Rights Reserved. No part of this publication may be
reproduced, stored in a retrieval system, or transmitted by any means (electronic, mechanical, photographic,
photocopying, recording or otherwise) without prior permission in writing by the author and/or publisher.
4
10008006004002000
LSL USL
LSL 50
Target *
USL 1100
Sample Mean 521.646
Sample N 100
StDev (Within) 221.349
StDev (O v erall) 231.974
Process Data
C p 0.79
C PL 0.71
C PU 0.87
C pk 0.71
Pp 0.75
PPL 0.68
PPU 0.83
Ppk 0.68
C pm *
O v erall C apability
Potential (Within) C apability
PPM < LSL 10000.00
PPM > USL 10000.00
PPM Total 20000.00
O bserv ed Performance
PPM < LSL 16553.73
PPM > USL 4489.42
PPM Total 21043.15
Exp. Within Performance
PPM < LSL 21016.93
PPM > USL 6330.14
PPM Total 27347.07
Exp. O v erall Performance
Within
Overall
Process Capability of MetricA
This is the
descriptive
statistics for
your data.
The LSL & USL
(which are the VOC)
are added the graph
PPM stands for โ€œParts Per
Millionโ€ which is used for
calculating DPMO (Defects
per Million Opportunities)
โ€œObservedโ€ is the
calculation for your
actual data.
โ€œWithinโ€ is the
SHORT-TERM
calculation for
your data.
โ€œOverallโ€ is the
LONG-TERM
calculation for
your data.
CPK and PPK are the
critical process
capability metrics.
Process Capability (DPMO)
o What is DPMO?
โ€ข Itโ€™s a count of the number of defects expected to occur
for every one million opportunities run in the process.
๏‚ง Itโ€™s essentially like a percent defective or p(d) thatโ€™s
carried out to the 4th decimal place.
o How is it calculated?
โ€ข The equation for DPMO is as follows:
o How is it interpreted? (using the Minitab example)
Copyright ยฉ 2011-2019 by Matthew J. Hansen. All Rights Reserved. No part of this publication may be
reproduced, stored in a retrieval system, or transmitted by any means (electronic, mechanical, photographic,
photocopying, recording or otherwise) without prior permission in writing by the author and/or publisher.
5
10008006004002000
LSL USL
LSL 50
Target *
USL 1100
Sample Mean 521.646
Sample N 100
StDev (Within) 221.349
StDev (O v erall) 231.974
Process Data
C p 0.79
C PL 0.71
C PU 0.87
C pk 0.71
Pp 0.75
PPL 0.68
PPU 0.83
Ppk 0.68
C pm *
O v erall C apability
Potential (Within) C apability
PPM < LSL 10000.00
PPM > USL 10000.00
PPM Total 20000.00
O bserv ed Performance
PPM < LSL 16553.73
PPM > USL 4489.42
PPM Total 21043.15
Exp. Within Performance
PPM < LSL 21016.93
PPM > USL 6330.14
PPM Total 27347.07
Exp. O v erall Performance
Within
Overall
Process Capability of MetricA
In the actual dataset that was โ€œobservedโ€,
1% (or 10,000 out of 1,000,000) of the data
points each fell below the LSL and above
the USL; together 2% (or 20,000 out of
1,000,000) of the data points are defects
By calculating for the short-term,
1.66% of the data points would fall
below the LSL and only 0.45% would
lie above the USL leaving a total p(d)
of 2.1% (or 97.9% success).
By calculating for the long-term,
2.1% of the data points would fall
below the LSL and only 0.63% would
lie above the USL leaving a total p(d)
of 2.73% (or 97.27% success).
What can we conclude from this? Based on the short & long term calculations, it
appears the process is more likely to fail (create defects) that fall below the LSL.
Process Capability (Z score or sigma level)
o What is a Z Score (a.k.a. sigma level)?
โ€ข Practically, Z score measures the VOP in relation to the
VOC. In a sense, it measures the โ€œseverity of painโ€ in
the process not meeting the customerโ€™s requirements.
โ€ข Technically, Z score measures the number of standard
deviations (ฯƒ) a data point (like USL) is from the mean.
o How is it calculated?
โ€ข The equation for Z score is as follows (โ€œXโ€ is generally an observation like USL)
o How is it interpreted?
โ€ข From the Minitab example, use USL as โ€œXโ€:
โ€ข What can we conclude from this?
๏‚ง If a capable process has at least 3 ฯƒ between the spec
limit and mean, then this process is not quite capable.
โ€ข How is short vs. long term data accounted for in the Z score?
๏‚ง If the data is short term (Zst) and you want to calculate long term capability (Zlt) then subtract 1.5ฯƒ from Z.
๏‚ง If the data is long term (Zlt) and you want to calculate short term capability (Zst) then add 1.5ฯƒ to Z.
๏‚ง Therefore, a formula we can derive from this is: Zlt = Zst โ€“ Zshift (or 1.5)
Copyright ยฉ 2011-2019 by Matthew J. Hansen. All Rights Reserved. No part of this publication may be
reproduced, stored in a retrieval system, or transmitted by any means (electronic, mechanical, photographic,
photocopying, recording or otherwise) without prior permission in writing by the author and/or publisher.
6
10008006004002000
LSL USL
LSL 50
Target *
USL 1100
Sample Mean 521.646
Sample N 100
StDev (Within) 221.349
StDev (O v erall) 231.974
Process Data
C p 0.79
C PL 0.71
C PU 0.87
C pk 0.71
Pp 0.75
PPL 0.68
PPU 0.83
Ppk 0.68
C pm *
O v erall C apability
Potential (Within) C apability
PPM < LSL 10000.00
PPM > USL 10000.00
PPM Total 20000.00
O bserv ed Performance
PPM < LSL 16553.73
PPM > USL 4489.42
PPM Total 21043.15
Exp. Within Performance
PPM < LSL 21016.93
PPM > USL 6330.14
PPM Total 27347.07
Exp. O v erall Performance
Within
Overall
Process Capability of MetricA
10008006004002000
LSL USL
LSL 50
Target *
USL 1100
Sample Mean 521.646
Sample N 100
StDev (Within) 221.349
StDev (O v erall) 231.974
Process Data
Pot
PPM < LSL 10000.00
PPM > USL 10000.00
PPM Total 20000.00
O bserv ed Performance
PPM < LSL 16553.73
PPM > USL 4489.42
PPM Total 21043.15
Exp. Within Performance
PPM < LSL 21016.93
PPM > USL 6330.14
PPM Total 27347.07
Exp. O v erall Performance
Process Capability of MetricA
10008006004002000
LSL USL
LSL 50
Target *
USL 1100
Sample Mean 521.646
Sample N 100
StDev (Within) 221.349
StDev (O v erall) 231.974
Process Data
C
C
C
C
Pp
PP
PP
Pp
C
O v er
Potential (
PPM < LSL 10000.00
PPM > USL 10000.00
PPM Total 20000.00
O bserv ed Performance
PPM < LSL 16553.73
PPM > USL 4489.42
PPM Total 21043.15
Exp. Within Performance
PPM < LSL 21016.93
PPM > USL 6330.14
PPM Total 27347.07
Exp. O v erall Performance
Wi
Ov
Process Capability of MetricA
Process Capability (Convert Z to Probability)
o What is cumulative probability?
โ€ข It refers to the portion of your distribution (area
under the curve) derived by your Z score.
โ€ข Itโ€™s a calculation converting the Z score into a p(d),
which is used for calculating the DPMO.
๏‚ง For example, having the short term Z scores (sigma levels)
shown at right, then the DPMO can be determined.
o How is it calculated?
Copyright ยฉ 2011-2019 by Matthew J. Hansen. All Rights Reserved. No part of this publication may be
reproduced, stored in a retrieval system, or transmitted by any means (electronic, mechanical, photographic,
photocopying, recording or otherwise) without prior permission in writing by the author and/or publisher.
7
0.4
0.3
0.2
0.1
0.0
X
Density
-2.61286 0
0.00449
Distribution Plot
Normal, Mean=0, StDev=1
SigmaST % Success DPMO
1ฯƒ 30.9% 691,462
2ฯƒ 69.1% 308,538
3ฯƒ 93.3% 66,807
4ฯƒ 99.38% 6,210
5ฯƒ 99.977% 233
6ฯƒ 99.9997% 3.4
From Calc > Probability Distributions > Normalโ€ฆ
A negative Z
score will calculate
the p(d)โ€ฆ
โ€ฆwhich matches the PPM (DPMO)
Process Capability (Cpk & Ppk)
o What is Cpk & Ppk?
โ€ข These measure short-term (Cpk) and long-term (Ppk)
process performance (VOP) in relation to the spread
(or total tolerance) between LSL & USL (VOC).
o How is it calculated?
โ€ข The equation for Cpk is as follows (Ppk is similar):
o How is it interpreted? (using the Minitab example)
โ€ข Cp represents the process potential while Cpk is the process performance.
โ€ข If Cpk < 1, the process is not capable within the tolerance (LSL & USL).
โ€ข The higher Cpk is above 1, the more capable the process is of achieving results within tolerance.
โ€ข If Cp is much greater than Cpk, then the process mean is missing the target.
๏‚ง If they are both <1, then it may be better to focus on shifting the mean before
reducing variation in order to get faster improvements.
โ€ข Ppk will always be lower than Cpk. But if itโ€™s significantly lower, then itโ€™s
driven by the long term variation (mean shift) between sub-groups.
๏‚ง In these cases, focus on reducing that sub-group variation knowing that the long-
term process capability (Ppk) has the potential of improving closer to the Cpk.
Copyright ยฉ 2011-2019 by Matthew J. Hansen. All Rights Reserved. No part of this publication may be
reproduced, stored in a retrieval system, or transmitted by any means (electronic, mechanical, photographic,
photocopying, recording or otherwise) without prior permission in writing by the author and/or publisher.
8
10008006004002000
LSL USL
LSL 50
Target *
USL 1100
Sample Mean 521.646
Sample N 100
StDev (Within) 221.349
StDev (O v erall) 231.974
Process Data
C p 0.79
C PL 0.71
C PU 0.87
C pk 0.71
Pp 0.75
PPL 0.68
PPU 0.83
Ppk 0.68
C pm *
O v erall C apability
Potential (Within) C apability
PPM < LSL 10000.00
PPM > USL 10000.00
PPM Total 20000.00
O bserv ed Performance
PPM < LSL 16553.73
PPM > USL 4489.42
PPM Total 21043.15
Exp. Within Performance
PPM < LSL 21016.93
PPM > USL 6330.14
PPM Total 27347.07
Exp. O v erall Performance
Within
Overall
Process Capability of MetricA
10008006004002000
LSL USL
LSL 50
Target *
USL 1100
Sample Mean 521.646
Sample N 100
StDev (Within) 221.349
StDev (O v erall) 231.974
Process Data
C p 0.79
C PL 0.71
C PU 0.87
C pk 0.71
Pp 0.75
PPL 0.68
PPU 0.83
Ppk 0.68
C pm *
O v erall C apability
Potential (Within) C apability
Within
Overall
Process Capability of MetricA
Process Capability (Sixpack)
o Minitab combines the tests for stability, normality & process capability into one chart.
โ€ข Go to Stat > Quality Tools > Capability Sixpack > Normalโ€ฆ
๏‚ง NOTE: Minitab 14 Student Version does not support this process capability tool.
Copyright ยฉ 2011-2019 by Matthew J. Hansen. All Rights Reserved. No part of this publication may be
reproduced, stored in a retrieval system, or transmitted by any means (electronic, mechanical, photographic,
photocopying, recording or otherwise) without prior permission in writing by the author and/or publisher.
9
9181716151413121111
1000
500
0
IndividualValue
_
X=522
UCL=1186
LCL=-142
9181716151413121111
800
400
0
MovingRange
__
MR=249.7
UCL=815.8
LCL=0
10095908580
1000
750
500
Observation
Values
10008006004002000
LSL USL
LSL 50
USL 1100
Specifications
150010005000
Within
O v erall
Specs
StDev 221.349
C p 0.79
C pk 0.71
Within
StDev 231.974
Pp 0.75
Ppk 0.68
C pm *
O v erall
Process Capability Sixpack of MetricA
I Chart
Moving Range Chart
Last 25 Observations
Capability Histogram
Normal Prob Plot
A D: 0.500, P: 0.204
Capability Plot
This is the I-MR
chart for testing
stability.
This is the
histogram with
the LSL & USL.
This is the
probability plot to
test normality
(with Anderson-
Darling test).
Cpk & Ppk are included. PPM (or DPMO)
is not included since Cpk & Ppk are
stronger measures of process capability.
Practical Application
o Refer to the 2 continuous metrics identified in the first lesson about process capability.
โ€ข For each metric, answer the following:
๏‚ง Was the metric a continuous value, from a stable process having a normal distribution?
โ€“ These attributes are based on the first 3 steps of the process capability calculation method.
๏‚ง If so, then run a capability analysis for a normal distribution and answer the following:
โ€“ What is the DPMO?
โ€“ What is the Z score?
โ€“ What is the cumulative probability or p(d)?
โ€“ What are the Cpk and Ppk?
๏‚ง Based on the above findings, is the process capable?
Copyright ยฉ 2011-2019 by Matthew J. Hansen. All Rights Reserved. No part of this publication may be
reproduced, stored in a retrieval system, or transmitted by any means (electronic, mechanical, photographic,
photocopying, recording or otherwise) without prior permission in writing by the author and/or publisher.
10

More Related Content

What's hot

Variation Over Time (Short/Long Term Data)
Variation Over Time (Short/Long Term Data)Variation Over Time (Short/Long Term Data)
Variation Over Time (Short/Long Term Data)Matt Hansen
ย 
MSA โ€“ Gage R&R Test
MSA โ€“ Gage R&R TestMSA โ€“ Gage R&R Test
MSA โ€“ Gage R&R TestMatt Hansen
ย 
Defining the VOC and Defects
Defining the VOC and DefectsDefining the VOC and Defects
Defining the VOC and DefectsMatt Hansen
ย 
Process Capability: Overview
Process Capability: OverviewProcess Capability: Overview
Process Capability: OverviewMatt Hansen
ย 
MSA โ€“ Attribute ARR Test
MSA โ€“ Attribute ARR TestMSA โ€“ Attribute ARR Test
MSA โ€“ Attribute ARR TestMatt Hansen
ย 
Process Capability: Steps 1 to 3
Process Capability: Steps 1 to 3Process Capability: Steps 1 to 3
Process Capability: Steps 1 to 3Matt Hansen
ย 
Defining Performance Objectives
Defining Performance ObjectivesDefining Performance Objectives
Defining Performance ObjectivesMatt Hansen
ย 
Hypothesis Testing: Relationships (Compare 2+ Factors)
Hypothesis Testing: Relationships (Compare 2+ Factors)Hypothesis Testing: Relationships (Compare 2+ Factors)
Hypothesis Testing: Relationships (Compare 2+ Factors)Matt Hansen
ย 
Identify Root Causes โ€“ C&E Diagram
Identify Root Causes โ€“ C&E DiagramIdentify Root Causes โ€“ C&E Diagram
Identify Root Causes โ€“ C&E DiagramMatt Hansen
ย 
MSA โ€“ Overview
MSA โ€“ OverviewMSA โ€“ Overview
MSA โ€“ OverviewMatt Hansen
ย 
Analyze Phase Roadmap (Level 3)
Analyze Phase Roadmap (Level 3)Analyze Phase Roadmap (Level 3)
Analyze Phase Roadmap (Level 3)Matt Hansen
ย 
Comparing Distributions and Using the Graphical Summary
Comparing Distributions and Using the Graphical SummaryComparing Distributions and Using the Graphical Summary
Comparing Distributions and Using the Graphical SummaryMatt Hansen
ย 
Identify Root Causes โ€“ Combining the C&E Diagram and 5 Whys
Identify Root Causes โ€“ Combining the C&E Diagram and 5 WhysIdentify Root Causes โ€“ Combining the C&E Diagram and 5 Whys
Identify Root Causes โ€“ Combining the C&E Diagram and 5 WhysMatt Hansen
ย 
Statistical Process Control (SPC)
Statistical Process Control (SPC)Statistical Process Control (SPC)
Statistical Process Control (SPC)Matt Hansen
ย 
Identify Root Causes โ€“ DCP Overview
Identify Root Causes โ€“ DCP OverviewIdentify Root Causes โ€“ DCP Overview
Identify Root Causes โ€“ DCP OverviewMatt Hansen
ย 
Building a Scorecard
Building a ScorecardBuilding a Scorecard
Building a ScorecardMatt Hansen
ย 
Control Charts: Recalculating Control Limits
Control Charts: Recalculating Control LimitsControl Charts: Recalculating Control Limits
Control Charts: Recalculating Control LimitsMatt Hansen
ย 
Control Charts: U Chart
Control Charts: U ChartControl Charts: U Chart
Control Charts: U ChartMatt Hansen
ย 
Hypothesis Testing: Formal and Informal Sub-Processes
Hypothesis Testing: Formal and Informal Sub-ProcessesHypothesis Testing: Formal and Informal Sub-Processes
Hypothesis Testing: Formal and Informal Sub-ProcessesMatt Hansen
ย 
Control Charts: P Chart
Control Charts: P ChartControl Charts: P Chart
Control Charts: P ChartMatt Hansen
ย 

What's hot (20)

Variation Over Time (Short/Long Term Data)
Variation Over Time (Short/Long Term Data)Variation Over Time (Short/Long Term Data)
Variation Over Time (Short/Long Term Data)
ย 
MSA โ€“ Gage R&R Test
MSA โ€“ Gage R&R TestMSA โ€“ Gage R&R Test
MSA โ€“ Gage R&R Test
ย 
Defining the VOC and Defects
Defining the VOC and DefectsDefining the VOC and Defects
Defining the VOC and Defects
ย 
Process Capability: Overview
Process Capability: OverviewProcess Capability: Overview
Process Capability: Overview
ย 
MSA โ€“ Attribute ARR Test
MSA โ€“ Attribute ARR TestMSA โ€“ Attribute ARR Test
MSA โ€“ Attribute ARR Test
ย 
Process Capability: Steps 1 to 3
Process Capability: Steps 1 to 3Process Capability: Steps 1 to 3
Process Capability: Steps 1 to 3
ย 
Defining Performance Objectives
Defining Performance ObjectivesDefining Performance Objectives
Defining Performance Objectives
ย 
Hypothesis Testing: Relationships (Compare 2+ Factors)
Hypothesis Testing: Relationships (Compare 2+ Factors)Hypothesis Testing: Relationships (Compare 2+ Factors)
Hypothesis Testing: Relationships (Compare 2+ Factors)
ย 
Identify Root Causes โ€“ C&E Diagram
Identify Root Causes โ€“ C&E DiagramIdentify Root Causes โ€“ C&E Diagram
Identify Root Causes โ€“ C&E Diagram
ย 
MSA โ€“ Overview
MSA โ€“ OverviewMSA โ€“ Overview
MSA โ€“ Overview
ย 
Analyze Phase Roadmap (Level 3)
Analyze Phase Roadmap (Level 3)Analyze Phase Roadmap (Level 3)
Analyze Phase Roadmap (Level 3)
ย 
Comparing Distributions and Using the Graphical Summary
Comparing Distributions and Using the Graphical SummaryComparing Distributions and Using the Graphical Summary
Comparing Distributions and Using the Graphical Summary
ย 
Identify Root Causes โ€“ Combining the C&E Diagram and 5 Whys
Identify Root Causes โ€“ Combining the C&E Diagram and 5 WhysIdentify Root Causes โ€“ Combining the C&E Diagram and 5 Whys
Identify Root Causes โ€“ Combining the C&E Diagram and 5 Whys
ย 
Statistical Process Control (SPC)
Statistical Process Control (SPC)Statistical Process Control (SPC)
Statistical Process Control (SPC)
ย 
Identify Root Causes โ€“ DCP Overview
Identify Root Causes โ€“ DCP OverviewIdentify Root Causes โ€“ DCP Overview
Identify Root Causes โ€“ DCP Overview
ย 
Building a Scorecard
Building a ScorecardBuilding a Scorecard
Building a Scorecard
ย 
Control Charts: Recalculating Control Limits
Control Charts: Recalculating Control LimitsControl Charts: Recalculating Control Limits
Control Charts: Recalculating Control Limits
ย 
Control Charts: U Chart
Control Charts: U ChartControl Charts: U Chart
Control Charts: U Chart
ย 
Hypothesis Testing: Formal and Informal Sub-Processes
Hypothesis Testing: Formal and Informal Sub-ProcessesHypothesis Testing: Formal and Informal Sub-Processes
Hypothesis Testing: Formal and Informal Sub-Processes
ย 
Control Charts: P Chart
Control Charts: P ChartControl Charts: P Chart
Control Charts: P Chart
ย 

Similar to Process Capability: Step 4 (Normal Distributions)

Javier Garcia - Verdugo Sanchez - Six Sigma Training - W1 Process Capability
Javier Garcia - Verdugo Sanchez - Six Sigma Training - W1 Process CapabilityJavier Garcia - Verdugo Sanchez - Six Sigma Training - W1 Process Capability
Javier Garcia - Verdugo Sanchez - Six Sigma Training - W1 Process CapabilityJ. Garcรญa - Verdugo
ย 
Lean6sigma Project Template
Lean6sigma Project TemplateLean6sigma Project Template
Lean6sigma Project TemplateTaco Bakker
ย 
Basics of Capability.ppt
Basics of Capability.pptBasics of Capability.ppt
Basics of Capability.pptValentinoDhiyu1
ย 
Process capability relation between yield and number of parts in assembly und...
Process capability relation between yield and number of parts in assembly und...Process capability relation between yield and number of parts in assembly und...
Process capability relation between yield and number of parts in assembly und...REXMATTHEW1
ย 
Statistical Process Control - SPC
Statistical Process Control - SPCStatistical Process Control - SPC
Statistical Process Control - SPCPrasenjit Puri
ย 
Hฤฑzlฤฑ Ozet - Istatistiksel Proses Kontrol
Hฤฑzlฤฑ Ozet - Istatistiksel Proses KontrolHฤฑzlฤฑ Ozet - Istatistiksel Proses Kontrol
Hฤฑzlฤฑ Ozet - Istatistiksel Proses Kontrolmetallicaslayer
ย 
Six sigma11
Six sigma11Six sigma11
Six sigma11Jitesh Gaurav
ย 
Control phase lean six sigma tollgate template
Control phase   lean six sigma tollgate templateControl phase   lean six sigma tollgate template
Control phase lean six sigma tollgate templateSteven Bonacorsi
ย 
Control phase lean six sigma tollgate template
Control phase   lean six sigma tollgate templateControl phase   lean six sigma tollgate template
Control phase lean six sigma tollgate templateSteven Bonacorsi
ย 
cp cpk lean manufacturingggggggggggggg.pdf
cp cpk lean manufacturingggggggggggggg.pdfcp cpk lean manufacturingggggggggggggg.pdf
cp cpk lean manufacturingggggggggggggg.pdfHilmiNurRaharja2
ย 
Six sigma full report
Six sigma full reportSix sigma full report
Six sigma full reporttapan27591
ย 
Lean six sigma executive overview (case study) templates
Lean six sigma executive overview (case study) templatesLean six sigma executive overview (case study) templates
Lean six sigma executive overview (case study) templatesSteven Bonacorsi
ย 
Process Capability.ppt related to quality
Process Capability.ppt related to qualityProcess Capability.ppt related to quality
Process Capability.ppt related to qualitynikhilyadav365577
ย 
Cpk guide 0211_tech1
Cpk guide 0211_tech1Cpk guide 0211_tech1
Cpk guide 0211_tech1Piyush Bose
ย 
Production & Operation Management Chapter9[1]
Production & Operation Management Chapter9[1]Production & Operation Management Chapter9[1]
Production & Operation Management Chapter9[1]Hariharan Ponnusamy
ย 

Similar to Process Capability: Step 4 (Normal Distributions) (20)

Javier Garcia - Verdugo Sanchez - Six Sigma Training - W1 Process Capability
Javier Garcia - Verdugo Sanchez - Six Sigma Training - W1 Process CapabilityJavier Garcia - Verdugo Sanchez - Six Sigma Training - W1 Process Capability
Javier Garcia - Verdugo Sanchez - Six Sigma Training - W1 Process Capability
ย 
TQM
TQMTQM
TQM
ย 
Lean6sigma Project Template
Lean6sigma Project TemplateLean6sigma Project Template
Lean6sigma Project Template
ย 
Basics of Capability.ppt
Basics of Capability.pptBasics of Capability.ppt
Basics of Capability.ppt
ย 
Process capability relation between yield and number of parts in assembly und...
Process capability relation between yield and number of parts in assembly und...Process capability relation between yield and number of parts in assembly und...
Process capability relation between yield and number of parts in assembly und...
ย 
Statistical Process Control - SPC
Statistical Process Control - SPCStatistical Process Control - SPC
Statistical Process Control - SPC
ย 
Hฤฑzlฤฑ Ozet - Istatistiksel Proses Kontrol
Hฤฑzlฤฑ Ozet - Istatistiksel Proses KontrolHฤฑzlฤฑ Ozet - Istatistiksel Proses Kontrol
Hฤฑzlฤฑ Ozet - Istatistiksel Proses Kontrol
ย 
Six sigma11
Six sigma11Six sigma11
Six sigma11
ย 
Basics of Process Capability
Basics of Process CapabilityBasics of Process Capability
Basics of Process Capability
ย 
Cpk problem solving_pcba smt machine
Cpk problem solving_pcba smt machineCpk problem solving_pcba smt machine
Cpk problem solving_pcba smt machine
ย 
Control phase lean six sigma tollgate template
Control phase   lean six sigma tollgate templateControl phase   lean six sigma tollgate template
Control phase lean six sigma tollgate template
ย 
Control phase lean six sigma tollgate template
Control phase   lean six sigma tollgate templateControl phase   lean six sigma tollgate template
Control phase lean six sigma tollgate template
ย 
cp cpk lean manufacturingggggggggggggg.pdf
cp cpk lean manufacturingggggggggggggg.pdfcp cpk lean manufacturingggggggggggggg.pdf
cp cpk lean manufacturingggggggggggggg.pdf
ย 
Six sigma full report
Six sigma full reportSix sigma full report
Six sigma full report
ย 
Lean six sigma executive overview (case study) templates
Lean six sigma executive overview (case study) templatesLean six sigma executive overview (case study) templates
Lean six sigma executive overview (case study) templates
ย 
Process Capability.ppt related to quality
Process Capability.ppt related to qualityProcess Capability.ppt related to quality
Process Capability.ppt related to quality
ย 
Cpk guide 0211_tech1
Cpk guide 0211_tech1Cpk guide 0211_tech1
Cpk guide 0211_tech1
ย 
Process Quality Control Training
Process Quality Control TrainingProcess Quality Control Training
Process Quality Control Training
ย 
Production & Operation Management Chapter9[1]
Production & Operation Management Chapter9[1]Production & Operation Management Chapter9[1]
Production & Operation Management Chapter9[1]
ย 
Chapter9[1]
Chapter9[1]Chapter9[1]
Chapter9[1]
ย 

More from Matt Hansen

Getting Feedback with a Plus/Delta Tool
Getting Feedback with a Plus/Delta ToolGetting Feedback with a Plus/Delta Tool
Getting Feedback with a Plus/Delta ToolMatt Hansen
ย 
Closing a Project
Closing a ProjectClosing a Project
Closing a ProjectMatt Hansen
ย 
Documenting a New Process with SOPs
Documenting a New Process with SOPsDocumenting a New Process with SOPs
Documenting a New Process with SOPsMatt Hansen
ย 
Building a Control Plan
Building a Control PlanBuilding a Control Plan
Building a Control PlanMatt Hansen
ย 
Control Charts: Xbar-S Chart
Control Charts: Xbar-S ChartControl Charts: Xbar-S Chart
Control Charts: Xbar-S ChartMatt Hansen
ย 
Control Charts: I-MR Chart
Control Charts: I-MR ChartControl Charts: I-MR Chart
Control Charts: I-MR ChartMatt Hansen
ย 
Control Charts: Finding the Right Control Chart
Control Charts: Finding the Right Control ChartControl Charts: Finding the Right Control Chart
Control Charts: Finding the Right Control ChartMatt Hansen
ย 
Control Phase Roadmap (Level 3)
Control Phase Roadmap (Level 3)Control Phase Roadmap (Level 3)
Control Phase Roadmap (Level 3)Matt Hansen
ย 
Piloting Solutions: Build the Pilot Plan
Piloting Solutions: Build the Pilot PlanPiloting Solutions: Build the Pilot Plan
Piloting Solutions: Build the Pilot PlanMatt Hansen
ย 
Piloting Solutions: The Process
Piloting Solutions: The ProcessPiloting Solutions: The Process
Piloting Solutions: The ProcessMatt Hansen
ย 
Risk Assessment with a FMEA Tool
Risk Assessment with a FMEA ToolRisk Assessment with a FMEA Tool
Risk Assessment with a FMEA ToolMatt Hansen
ย 
Prioritize Solutions with an Impact Matrix
Prioritize Solutions with an Impact MatrixPrioritize Solutions with an Impact Matrix
Prioritize Solutions with an Impact MatrixMatt Hansen
ย 
Brainstorm Solutions with an Affinity Diagram
Brainstorm Solutions with an Affinity DiagramBrainstorm Solutions with an Affinity Diagram
Brainstorm Solutions with an Affinity DiagramMatt Hansen
ย 
Brainstorm & Prioritize Solutions with a Workout
Brainstorm & Prioritize Solutions with a WorkoutBrainstorm & Prioritize Solutions with a Workout
Brainstorm & Prioritize Solutions with a WorkoutMatt Hansen
ย 
Testing for Multicollinearity
Testing for MulticollinearityTesting for Multicollinearity
Testing for MulticollinearityMatt Hansen
ย 
Compiling Analysis Results
Compiling Analysis ResultsCompiling Analysis Results
Compiling Analysis ResultsMatt Hansen
ย 
Improve Phase Roadmap (Level 3)
Improve Phase Roadmap (Level 3)Improve Phase Roadmap (Level 3)
Improve Phase Roadmap (Level 3)Matt Hansen
ย 
Hypothesis Testing: Relationships (Compare 1:1)
Hypothesis Testing: Relationships (Compare 1:1)Hypothesis Testing: Relationships (Compare 1:1)
Hypothesis Testing: Relationships (Compare 1:1)Matt Hansen
ย 
Hypothesis Testing: Relationships (Overview)
Hypothesis Testing: Relationships (Overview)Hypothesis Testing: Relationships (Overview)
Hypothesis Testing: Relationships (Overview)Matt Hansen
ย 
Hypothesis Testing: Spread (Compare 2+ Factors)
Hypothesis Testing: Spread (Compare 2+ Factors)Hypothesis Testing: Spread (Compare 2+ Factors)
Hypothesis Testing: Spread (Compare 2+ Factors)Matt Hansen
ย 

More from Matt Hansen (20)

Getting Feedback with a Plus/Delta Tool
Getting Feedback with a Plus/Delta ToolGetting Feedback with a Plus/Delta Tool
Getting Feedback with a Plus/Delta Tool
ย 
Closing a Project
Closing a ProjectClosing a Project
Closing a Project
ย 
Documenting a New Process with SOPs
Documenting a New Process with SOPsDocumenting a New Process with SOPs
Documenting a New Process with SOPs
ย 
Building a Control Plan
Building a Control PlanBuilding a Control Plan
Building a Control Plan
ย 
Control Charts: Xbar-S Chart
Control Charts: Xbar-S ChartControl Charts: Xbar-S Chart
Control Charts: Xbar-S Chart
ย 
Control Charts: I-MR Chart
Control Charts: I-MR ChartControl Charts: I-MR Chart
Control Charts: I-MR Chart
ย 
Control Charts: Finding the Right Control Chart
Control Charts: Finding the Right Control ChartControl Charts: Finding the Right Control Chart
Control Charts: Finding the Right Control Chart
ย 
Control Phase Roadmap (Level 3)
Control Phase Roadmap (Level 3)Control Phase Roadmap (Level 3)
Control Phase Roadmap (Level 3)
ย 
Piloting Solutions: Build the Pilot Plan
Piloting Solutions: Build the Pilot PlanPiloting Solutions: Build the Pilot Plan
Piloting Solutions: Build the Pilot Plan
ย 
Piloting Solutions: The Process
Piloting Solutions: The ProcessPiloting Solutions: The Process
Piloting Solutions: The Process
ย 
Risk Assessment with a FMEA Tool
Risk Assessment with a FMEA ToolRisk Assessment with a FMEA Tool
Risk Assessment with a FMEA Tool
ย 
Prioritize Solutions with an Impact Matrix
Prioritize Solutions with an Impact MatrixPrioritize Solutions with an Impact Matrix
Prioritize Solutions with an Impact Matrix
ย 
Brainstorm Solutions with an Affinity Diagram
Brainstorm Solutions with an Affinity DiagramBrainstorm Solutions with an Affinity Diagram
Brainstorm Solutions with an Affinity Diagram
ย 
Brainstorm & Prioritize Solutions with a Workout
Brainstorm & Prioritize Solutions with a WorkoutBrainstorm & Prioritize Solutions with a Workout
Brainstorm & Prioritize Solutions with a Workout
ย 
Testing for Multicollinearity
Testing for MulticollinearityTesting for Multicollinearity
Testing for Multicollinearity
ย 
Compiling Analysis Results
Compiling Analysis ResultsCompiling Analysis Results
Compiling Analysis Results
ย 
Improve Phase Roadmap (Level 3)
Improve Phase Roadmap (Level 3)Improve Phase Roadmap (Level 3)
Improve Phase Roadmap (Level 3)
ย 
Hypothesis Testing: Relationships (Compare 1:1)
Hypothesis Testing: Relationships (Compare 1:1)Hypothesis Testing: Relationships (Compare 1:1)
Hypothesis Testing: Relationships (Compare 1:1)
ย 
Hypothesis Testing: Relationships (Overview)
Hypothesis Testing: Relationships (Overview)Hypothesis Testing: Relationships (Overview)
Hypothesis Testing: Relationships (Overview)
ย 
Hypothesis Testing: Spread (Compare 2+ Factors)
Hypothesis Testing: Spread (Compare 2+ Factors)Hypothesis Testing: Spread (Compare 2+ Factors)
Hypothesis Testing: Spread (Compare 2+ Factors)
ย 

Recently uploaded

What are the main advantages of using HR recruiter services.pdf
What are the main advantages of using HR recruiter services.pdfWhat are the main advantages of using HR recruiter services.pdf
What are the main advantages of using HR recruiter services.pdfHumanResourceDimensi1
ย 
chapter 10 - excise tax of transfer and business taxation
chapter 10 - excise tax of transfer and business taxationchapter 10 - excise tax of transfer and business taxation
chapter 10 - excise tax of transfer and business taxationAUDIJEAngelo
ย 
anas about venice for grade 6f about venice
anas about venice for grade 6f about veniceanas about venice for grade 6f about venice
anas about venice for grade 6f about veniceanasabutalha2013
ย 
RMD24 | Retail media: hoe zet je dit in als je geen AH of Unilever bent? Heid...
RMD24 | Retail media: hoe zet je dit in als je geen AH of Unilever bent? Heid...RMD24 | Retail media: hoe zet je dit in als je geen AH of Unilever bent? Heid...
RMD24 | Retail media: hoe zet je dit in als je geen AH of Unilever bent? Heid...BBPMedia1
ย 
Accpac to QuickBooks Conversion Navigating the Transition with Online Account...
Accpac to QuickBooks Conversion Navigating the Transition with Online Account...Accpac to QuickBooks Conversion Navigating the Transition with Online Account...
Accpac to QuickBooks Conversion Navigating the Transition with Online Account...PaulBryant58
ย 
20240425_ TJ Communications Credentials_compressed.pdf
20240425_ TJ Communications Credentials_compressed.pdf20240425_ TJ Communications Credentials_compressed.pdf
20240425_ TJ Communications Credentials_compressed.pdftjcomstrang
ย 
FINAL PRESENTATION.pptx12143241324134134
FINAL PRESENTATION.pptx12143241324134134FINAL PRESENTATION.pptx12143241324134134
FINAL PRESENTATION.pptx12143241324134134LR1709MUSIC
ย 
Matt Conway - Attorney - A Knowledgeable Professional - Kentucky.pdf
Matt Conway - Attorney - A Knowledgeable Professional - Kentucky.pdfMatt Conway - Attorney - A Knowledgeable Professional - Kentucky.pdf
Matt Conway - Attorney - A Knowledgeable Professional - Kentucky.pdfMatt Conway - Attorney
ย 
Using Generative AI for Content Marketing
Using Generative AI for Content MarketingUsing Generative AI for Content Marketing
Using Generative AI for Content MarketingChuck Aikens
ย 
falcon-invoice-discounting-a-premier-platform-for-investors-in-india
falcon-invoice-discounting-a-premier-platform-for-investors-in-indiafalcon-invoice-discounting-a-premier-platform-for-investors-in-india
falcon-invoice-discounting-a-premier-platform-for-investors-in-indiaFalcon Invoice Discounting
ย 
Cree_Rey_BrandIdentityKit.PDF_PersonalBd
Cree_Rey_BrandIdentityKit.PDF_PersonalBdCree_Rey_BrandIdentityKit.PDF_PersonalBd
Cree_Rey_BrandIdentityKit.PDF_PersonalBdcreerey
ย 
Get Bad Credit Loans with Guaranteed Approval
Get Bad Credit Loans with Guaranteed ApprovalGet Bad Credit Loans with Guaranteed Approval
Get Bad Credit Loans with Guaranteed ApprovalDollarLoan Hub
ย 
Lookback Analysis
Lookback AnalysisLookback Analysis
Lookback AnalysisSafe PaaS
ย 
University of Connecticut Fees, Courses, Acceptance Rate, Admission deadline,...
University of Connecticut Fees, Courses, Acceptance Rate, Admission deadline,...University of Connecticut Fees, Courses, Acceptance Rate, Admission deadline,...
University of Connecticut Fees, Courses, Acceptance Rate, Admission deadline,...dvividconsultant15
ย 
Meaningful Technology for Humans: How Strategy Helps to Deliver Real Value fo...
Meaningful Technology for Humans: How Strategy Helps to Deliver Real Value fo...Meaningful Technology for Humans: How Strategy Helps to Deliver Real Value fo...
Meaningful Technology for Humans: How Strategy Helps to Deliver Real Value fo...Bjรถrn Rohles
ย 
Pitch Deck Teardown: RAW Dating App's $3M Angel deck
Pitch Deck Teardown: RAW Dating App's $3M Angel deckPitch Deck Teardown: RAW Dating App's $3M Angel deck
Pitch Deck Teardown: RAW Dating App's $3M Angel deckHajeJanKamps
ย 
PETAVIT SIP-01.pdfAAAAAAAAAAAAAAAAAAAAAAAAAAA
PETAVIT SIP-01.pdfAAAAAAAAAAAAAAAAAAAAAAAAAAAPETAVIT SIP-01.pdfAAAAAAAAAAAAAAAAAAAAAAAAAAA
PETAVIT SIP-01.pdfAAAAAAAAAAAAAAAAAAAAAAAAAAAlawrenceads01
ย 
Team-Spandex-Northern University-CS1035.
Team-Spandex-Northern University-CS1035.Team-Spandex-Northern University-CS1035.
Team-Spandex-Northern University-CS1035.smalmahmud11
ย 
Premium MEAN Stack Development Solutions for Modern Businesses
Premium MEAN Stack Development Solutions for Modern BusinessesPremium MEAN Stack Development Solutions for Modern Businesses
Premium MEAN Stack Development Solutions for Modern BusinessesSynapseIndia
ย 
RMD24 | Debunking the non-endemic revenue myth Marvin Vacquier Droop | First ...
RMD24 | Debunking the non-endemic revenue myth Marvin Vacquier Droop | First ...RMD24 | Debunking the non-endemic revenue myth Marvin Vacquier Droop | First ...
RMD24 | Debunking the non-endemic revenue myth Marvin Vacquier Droop | First ...BBPMedia1
ย 

Recently uploaded (20)

What are the main advantages of using HR recruiter services.pdf
What are the main advantages of using HR recruiter services.pdfWhat are the main advantages of using HR recruiter services.pdf
What are the main advantages of using HR recruiter services.pdf
ย 
chapter 10 - excise tax of transfer and business taxation
chapter 10 - excise tax of transfer and business taxationchapter 10 - excise tax of transfer and business taxation
chapter 10 - excise tax of transfer and business taxation
ย 
anas about venice for grade 6f about venice
anas about venice for grade 6f about veniceanas about venice for grade 6f about venice
anas about venice for grade 6f about venice
ย 
RMD24 | Retail media: hoe zet je dit in als je geen AH of Unilever bent? Heid...
RMD24 | Retail media: hoe zet je dit in als je geen AH of Unilever bent? Heid...RMD24 | Retail media: hoe zet je dit in als je geen AH of Unilever bent? Heid...
RMD24 | Retail media: hoe zet je dit in als je geen AH of Unilever bent? Heid...
ย 
Accpac to QuickBooks Conversion Navigating the Transition with Online Account...
Accpac to QuickBooks Conversion Navigating the Transition with Online Account...Accpac to QuickBooks Conversion Navigating the Transition with Online Account...
Accpac to QuickBooks Conversion Navigating the Transition with Online Account...
ย 
20240425_ TJ Communications Credentials_compressed.pdf
20240425_ TJ Communications Credentials_compressed.pdf20240425_ TJ Communications Credentials_compressed.pdf
20240425_ TJ Communications Credentials_compressed.pdf
ย 
FINAL PRESENTATION.pptx12143241324134134
FINAL PRESENTATION.pptx12143241324134134FINAL PRESENTATION.pptx12143241324134134
FINAL PRESENTATION.pptx12143241324134134
ย 
Matt Conway - Attorney - A Knowledgeable Professional - Kentucky.pdf
Matt Conway - Attorney - A Knowledgeable Professional - Kentucky.pdfMatt Conway - Attorney - A Knowledgeable Professional - Kentucky.pdf
Matt Conway - Attorney - A Knowledgeable Professional - Kentucky.pdf
ย 
Using Generative AI for Content Marketing
Using Generative AI for Content MarketingUsing Generative AI for Content Marketing
Using Generative AI for Content Marketing
ย 
falcon-invoice-discounting-a-premier-platform-for-investors-in-india
falcon-invoice-discounting-a-premier-platform-for-investors-in-indiafalcon-invoice-discounting-a-premier-platform-for-investors-in-india
falcon-invoice-discounting-a-premier-platform-for-investors-in-india
ย 
Cree_Rey_BrandIdentityKit.PDF_PersonalBd
Cree_Rey_BrandIdentityKit.PDF_PersonalBdCree_Rey_BrandIdentityKit.PDF_PersonalBd
Cree_Rey_BrandIdentityKit.PDF_PersonalBd
ย 
Get Bad Credit Loans with Guaranteed Approval
Get Bad Credit Loans with Guaranteed ApprovalGet Bad Credit Loans with Guaranteed Approval
Get Bad Credit Loans with Guaranteed Approval
ย 
Lookback Analysis
Lookback AnalysisLookback Analysis
Lookback Analysis
ย 
University of Connecticut Fees, Courses, Acceptance Rate, Admission deadline,...
University of Connecticut Fees, Courses, Acceptance Rate, Admission deadline,...University of Connecticut Fees, Courses, Acceptance Rate, Admission deadline,...
University of Connecticut Fees, Courses, Acceptance Rate, Admission deadline,...
ย 
Meaningful Technology for Humans: How Strategy Helps to Deliver Real Value fo...
Meaningful Technology for Humans: How Strategy Helps to Deliver Real Value fo...Meaningful Technology for Humans: How Strategy Helps to Deliver Real Value fo...
Meaningful Technology for Humans: How Strategy Helps to Deliver Real Value fo...
ย 
Pitch Deck Teardown: RAW Dating App's $3M Angel deck
Pitch Deck Teardown: RAW Dating App's $3M Angel deckPitch Deck Teardown: RAW Dating App's $3M Angel deck
Pitch Deck Teardown: RAW Dating App's $3M Angel deck
ย 
PETAVIT SIP-01.pdfAAAAAAAAAAAAAAAAAAAAAAAAAAA
PETAVIT SIP-01.pdfAAAAAAAAAAAAAAAAAAAAAAAAAAAPETAVIT SIP-01.pdfAAAAAAAAAAAAAAAAAAAAAAAAAAA
PETAVIT SIP-01.pdfAAAAAAAAAAAAAAAAAAAAAAAAAAA
ย 
Team-Spandex-Northern University-CS1035.
Team-Spandex-Northern University-CS1035.Team-Spandex-Northern University-CS1035.
Team-Spandex-Northern University-CS1035.
ย 
Premium MEAN Stack Development Solutions for Modern Businesses
Premium MEAN Stack Development Solutions for Modern BusinessesPremium MEAN Stack Development Solutions for Modern Businesses
Premium MEAN Stack Development Solutions for Modern Businesses
ย 
RMD24 | Debunking the non-endemic revenue myth Marvin Vacquier Droop | First ...
RMD24 | Debunking the non-endemic revenue myth Marvin Vacquier Droop | First ...RMD24 | Debunking the non-endemic revenue myth Marvin Vacquier Droop | First ...
RMD24 | Debunking the non-endemic revenue myth Marvin Vacquier Droop | First ...
ย 

Process Capability: Step 4 (Normal Distributions)

  • 1. Section & Lesson #: Pre-Requisite Lessons: Complex Tools + Clear Teaching = Powerful Results Process Capability: Step 4 (Normal Dist) Six Sigma-Analyze โ€“ Lesson 5 As part of a series about process capability, this lesson shows how to assess the capability of a process thatโ€™s based on a normal distribution. Six Sigma-Analyze #04 โ€“ Process Capability: Steps 1 to 3 Copyright ยฉ 2011-2019 by Matthew J. Hansen. All Rights Reserved. No part of this publication may be reproduced, stored in a retrieval system, or transmitted by any means (electronic, mechanical, photographic, photocopying, recording or otherwise) without prior permission in writing by the author and/or publisher.
  • 2. Process Capability Review o What is process capability? โ€ข As the โ€œVoice of the Processโ€ (VOP), it represents a standard set of metrics that define how a process is performing (its capability). o How do we calculate the process capability? โ€ข This illustration at right shows the steps and tools you can use to calculate process capability. Copyright ยฉ 2011-2019 by Matthew J. Hansen. All Rights Reserved. No part of this publication may be reproduced, stored in a retrieval system, or transmitted by any means (electronic, mechanical, photographic, photocopying, recording or otherwise) without prior permission in writing by the author and/or publisher. 2 Process Capability (Voiceof ProcessorVOP) Customer Requirements (Voiceof CustomerorVOC) PerformanceGap between VOC & VOP Actual Process Performance Define (GetVOC) Measure (GetVOPData) Analyze (AnalyzeGap) Improve (Fix Gap) Control (Sustain Fix)
  • 3. Capability Analysis (Normal Dist) o Follow the next set of steps when the following conditions exist in the data: โ€ข Data type = Continuous โ€ข Process = Stable โ€ข Distribution = Normal o How do I calculate the process capability? โ€ข The example below is run on โ€œMetricAโ€ field in the Minitab 15 Sample Data v1.MPJ file: ๏‚ง NOTE: Minitab 14 Student Version does not support this process capability calculation. Follow instructions later on how to manually calculate the process capability. Copyright ยฉ 2011-2019 by Matthew J. Hansen. All Rights Reserved. No part of this publication may be reproduced, stored in a retrieval system, or transmitted by any means (electronic, mechanical, photographic, photocopying, recording or otherwise) without prior permission in writing by the author and/or publisher. 3 From Stat > Quality Tools > Capability Analysis > Normalโ€ฆ Identify the field used for measuring the process (probably the project Y). Use โ€œ1โ€ for subgroup size. See the Measure phase lesson on โ€œRational Sub-Groupingโ€ for more details. Type in the customerโ€™s requirements (VOC) in terms of an upper and/or lower spec limit.
  • 4. An Example from Minitab o Below is the output from Minitab. โ€ข This output introduces several new HIGHLIGHTED terms & concepts that weโ€™ll begin to explore. Copyright ยฉ 2011-2019 by Matthew J. Hansen. All Rights Reserved. No part of this publication may be reproduced, stored in a retrieval system, or transmitted by any means (electronic, mechanical, photographic, photocopying, recording or otherwise) without prior permission in writing by the author and/or publisher. 4 10008006004002000 LSL USL LSL 50 Target * USL 1100 Sample Mean 521.646 Sample N 100 StDev (Within) 221.349 StDev (O v erall) 231.974 Process Data C p 0.79 C PL 0.71 C PU 0.87 C pk 0.71 Pp 0.75 PPL 0.68 PPU 0.83 Ppk 0.68 C pm * O v erall C apability Potential (Within) C apability PPM < LSL 10000.00 PPM > USL 10000.00 PPM Total 20000.00 O bserv ed Performance PPM < LSL 16553.73 PPM > USL 4489.42 PPM Total 21043.15 Exp. Within Performance PPM < LSL 21016.93 PPM > USL 6330.14 PPM Total 27347.07 Exp. O v erall Performance Within Overall Process Capability of MetricA This is the descriptive statistics for your data. The LSL & USL (which are the VOC) are added the graph PPM stands for โ€œParts Per Millionโ€ which is used for calculating DPMO (Defects per Million Opportunities) โ€œObservedโ€ is the calculation for your actual data. โ€œWithinโ€ is the SHORT-TERM calculation for your data. โ€œOverallโ€ is the LONG-TERM calculation for your data. CPK and PPK are the critical process capability metrics.
  • 5. Process Capability (DPMO) o What is DPMO? โ€ข Itโ€™s a count of the number of defects expected to occur for every one million opportunities run in the process. ๏‚ง Itโ€™s essentially like a percent defective or p(d) thatโ€™s carried out to the 4th decimal place. o How is it calculated? โ€ข The equation for DPMO is as follows: o How is it interpreted? (using the Minitab example) Copyright ยฉ 2011-2019 by Matthew J. Hansen. All Rights Reserved. No part of this publication may be reproduced, stored in a retrieval system, or transmitted by any means (electronic, mechanical, photographic, photocopying, recording or otherwise) without prior permission in writing by the author and/or publisher. 5 10008006004002000 LSL USL LSL 50 Target * USL 1100 Sample Mean 521.646 Sample N 100 StDev (Within) 221.349 StDev (O v erall) 231.974 Process Data C p 0.79 C PL 0.71 C PU 0.87 C pk 0.71 Pp 0.75 PPL 0.68 PPU 0.83 Ppk 0.68 C pm * O v erall C apability Potential (Within) C apability PPM < LSL 10000.00 PPM > USL 10000.00 PPM Total 20000.00 O bserv ed Performance PPM < LSL 16553.73 PPM > USL 4489.42 PPM Total 21043.15 Exp. Within Performance PPM < LSL 21016.93 PPM > USL 6330.14 PPM Total 27347.07 Exp. O v erall Performance Within Overall Process Capability of MetricA 10008006004002000 LSL USL LSL 50 Target * USL 1100 Sample Mean 521.646 Sample N 100 StDev (Within) 221.349 StDev (O v erall) 231.974 Process Data C p 0.79 C PL 0.71 C PU 0.87 C pk 0.71 Pp 0.75 PPL 0.68 PPU 0.83 Ppk 0.68 C pm * O v erall C apability Potential (Within) C apability PPM < LSL 10000.00 PPM > USL 10000.00 PPM Total 20000.00 O bserv ed Performance PPM < LSL 16553.73 PPM > USL 4489.42 PPM Total 21043.15 Exp. Within Performance PPM < LSL 21016.93 PPM > USL 6330.14 PPM Total 27347.07 Exp. O v erall Performance Within Overall Process Capability of MetricA In the actual dataset that was โ€œobservedโ€, 1% (or 10,000 out of 1,000,000) of the data points each fell below the LSL and above the USL; together 2% (or 20,000 out of 1,000,000) of the data points are defects By calculating for the short-term, 1.66% of the data points would fall below the LSL and only 0.45% would lie above the USL leaving a total p(d) of 2.1% (or 97.9% success). By calculating for the long-term, 2.1% of the data points would fall below the LSL and only 0.63% would lie above the USL leaving a total p(d) of 2.73% (or 97.27% success). What can we conclude from this? Based on the short & long term calculations, it appears the process is more likely to fail (create defects) that fall below the LSL.
  • 6. Process Capability (Z score or sigma level) o What is a Z Score (a.k.a. sigma level)? โ€ข Practically, Z score measures the VOP in relation to the VOC. In a sense, it measures the โ€œseverity of painโ€ in the process not meeting the customerโ€™s requirements. โ€ข Technically, Z score measures the number of standard deviations (ฯƒ) a data point (like USL) is from the mean. o How is it calculated? โ€ข The equation for Z score is as follows (โ€œXโ€ is generally an observation like USL) o How is it interpreted? โ€ข From the Minitab example, use USL as โ€œXโ€: โ€ข What can we conclude from this? ๏‚ง If a capable process has at least 3 ฯƒ between the spec limit and mean, then this process is not quite capable. โ€ข How is short vs. long term data accounted for in the Z score? ๏‚ง If the data is short term (Zst) and you want to calculate long term capability (Zlt) then subtract 1.5ฯƒ from Z. ๏‚ง If the data is long term (Zlt) and you want to calculate short term capability (Zst) then add 1.5ฯƒ to Z. ๏‚ง Therefore, a formula we can derive from this is: Zlt = Zst โ€“ Zshift (or 1.5) Copyright ยฉ 2011-2019 by Matthew J. Hansen. All Rights Reserved. No part of this publication may be reproduced, stored in a retrieval system, or transmitted by any means (electronic, mechanical, photographic, photocopying, recording or otherwise) without prior permission in writing by the author and/or publisher. 6 10008006004002000 LSL USL LSL 50 Target * USL 1100 Sample Mean 521.646 Sample N 100 StDev (Within) 221.349 StDev (O v erall) 231.974 Process Data C p 0.79 C PL 0.71 C PU 0.87 C pk 0.71 Pp 0.75 PPL 0.68 PPU 0.83 Ppk 0.68 C pm * O v erall C apability Potential (Within) C apability PPM < LSL 10000.00 PPM > USL 10000.00 PPM Total 20000.00 O bserv ed Performance PPM < LSL 16553.73 PPM > USL 4489.42 PPM Total 21043.15 Exp. Within Performance PPM < LSL 21016.93 PPM > USL 6330.14 PPM Total 27347.07 Exp. O v erall Performance Within Overall Process Capability of MetricA 10008006004002000 LSL USL LSL 50 Target * USL 1100 Sample Mean 521.646 Sample N 100 StDev (Within) 221.349 StDev (O v erall) 231.974 Process Data Pot PPM < LSL 10000.00 PPM > USL 10000.00 PPM Total 20000.00 O bserv ed Performance PPM < LSL 16553.73 PPM > USL 4489.42 PPM Total 21043.15 Exp. Within Performance PPM < LSL 21016.93 PPM > USL 6330.14 PPM Total 27347.07 Exp. O v erall Performance Process Capability of MetricA
  • 7. 10008006004002000 LSL USL LSL 50 Target * USL 1100 Sample Mean 521.646 Sample N 100 StDev (Within) 221.349 StDev (O v erall) 231.974 Process Data C C C C Pp PP PP Pp C O v er Potential ( PPM < LSL 10000.00 PPM > USL 10000.00 PPM Total 20000.00 O bserv ed Performance PPM < LSL 16553.73 PPM > USL 4489.42 PPM Total 21043.15 Exp. Within Performance PPM < LSL 21016.93 PPM > USL 6330.14 PPM Total 27347.07 Exp. O v erall Performance Wi Ov Process Capability of MetricA Process Capability (Convert Z to Probability) o What is cumulative probability? โ€ข It refers to the portion of your distribution (area under the curve) derived by your Z score. โ€ข Itโ€™s a calculation converting the Z score into a p(d), which is used for calculating the DPMO. ๏‚ง For example, having the short term Z scores (sigma levels) shown at right, then the DPMO can be determined. o How is it calculated? Copyright ยฉ 2011-2019 by Matthew J. Hansen. All Rights Reserved. No part of this publication may be reproduced, stored in a retrieval system, or transmitted by any means (electronic, mechanical, photographic, photocopying, recording or otherwise) without prior permission in writing by the author and/or publisher. 7 0.4 0.3 0.2 0.1 0.0 X Density -2.61286 0 0.00449 Distribution Plot Normal, Mean=0, StDev=1 SigmaST % Success DPMO 1ฯƒ 30.9% 691,462 2ฯƒ 69.1% 308,538 3ฯƒ 93.3% 66,807 4ฯƒ 99.38% 6,210 5ฯƒ 99.977% 233 6ฯƒ 99.9997% 3.4 From Calc > Probability Distributions > Normalโ€ฆ A negative Z score will calculate the p(d)โ€ฆ โ€ฆwhich matches the PPM (DPMO)
  • 8. Process Capability (Cpk & Ppk) o What is Cpk & Ppk? โ€ข These measure short-term (Cpk) and long-term (Ppk) process performance (VOP) in relation to the spread (or total tolerance) between LSL & USL (VOC). o How is it calculated? โ€ข The equation for Cpk is as follows (Ppk is similar): o How is it interpreted? (using the Minitab example) โ€ข Cp represents the process potential while Cpk is the process performance. โ€ข If Cpk < 1, the process is not capable within the tolerance (LSL & USL). โ€ข The higher Cpk is above 1, the more capable the process is of achieving results within tolerance. โ€ข If Cp is much greater than Cpk, then the process mean is missing the target. ๏‚ง If they are both <1, then it may be better to focus on shifting the mean before reducing variation in order to get faster improvements. โ€ข Ppk will always be lower than Cpk. But if itโ€™s significantly lower, then itโ€™s driven by the long term variation (mean shift) between sub-groups. ๏‚ง In these cases, focus on reducing that sub-group variation knowing that the long- term process capability (Ppk) has the potential of improving closer to the Cpk. Copyright ยฉ 2011-2019 by Matthew J. Hansen. All Rights Reserved. No part of this publication may be reproduced, stored in a retrieval system, or transmitted by any means (electronic, mechanical, photographic, photocopying, recording or otherwise) without prior permission in writing by the author and/or publisher. 8 10008006004002000 LSL USL LSL 50 Target * USL 1100 Sample Mean 521.646 Sample N 100 StDev (Within) 221.349 StDev (O v erall) 231.974 Process Data C p 0.79 C PL 0.71 C PU 0.87 C pk 0.71 Pp 0.75 PPL 0.68 PPU 0.83 Ppk 0.68 C pm * O v erall C apability Potential (Within) C apability PPM < LSL 10000.00 PPM > USL 10000.00 PPM Total 20000.00 O bserv ed Performance PPM < LSL 16553.73 PPM > USL 4489.42 PPM Total 21043.15 Exp. Within Performance PPM < LSL 21016.93 PPM > USL 6330.14 PPM Total 27347.07 Exp. O v erall Performance Within Overall Process Capability of MetricA 10008006004002000 LSL USL LSL 50 Target * USL 1100 Sample Mean 521.646 Sample N 100 StDev (Within) 221.349 StDev (O v erall) 231.974 Process Data C p 0.79 C PL 0.71 C PU 0.87 C pk 0.71 Pp 0.75 PPL 0.68 PPU 0.83 Ppk 0.68 C pm * O v erall C apability Potential (Within) C apability Within Overall Process Capability of MetricA
  • 9. Process Capability (Sixpack) o Minitab combines the tests for stability, normality & process capability into one chart. โ€ข Go to Stat > Quality Tools > Capability Sixpack > Normalโ€ฆ ๏‚ง NOTE: Minitab 14 Student Version does not support this process capability tool. Copyright ยฉ 2011-2019 by Matthew J. Hansen. All Rights Reserved. No part of this publication may be reproduced, stored in a retrieval system, or transmitted by any means (electronic, mechanical, photographic, photocopying, recording or otherwise) without prior permission in writing by the author and/or publisher. 9 9181716151413121111 1000 500 0 IndividualValue _ X=522 UCL=1186 LCL=-142 9181716151413121111 800 400 0 MovingRange __ MR=249.7 UCL=815.8 LCL=0 10095908580 1000 750 500 Observation Values 10008006004002000 LSL USL LSL 50 USL 1100 Specifications 150010005000 Within O v erall Specs StDev 221.349 C p 0.79 C pk 0.71 Within StDev 231.974 Pp 0.75 Ppk 0.68 C pm * O v erall Process Capability Sixpack of MetricA I Chart Moving Range Chart Last 25 Observations Capability Histogram Normal Prob Plot A D: 0.500, P: 0.204 Capability Plot This is the I-MR chart for testing stability. This is the histogram with the LSL & USL. This is the probability plot to test normality (with Anderson- Darling test). Cpk & Ppk are included. PPM (or DPMO) is not included since Cpk & Ppk are stronger measures of process capability.
  • 10. Practical Application o Refer to the 2 continuous metrics identified in the first lesson about process capability. โ€ข For each metric, answer the following: ๏‚ง Was the metric a continuous value, from a stable process having a normal distribution? โ€“ These attributes are based on the first 3 steps of the process capability calculation method. ๏‚ง If so, then run a capability analysis for a normal distribution and answer the following: โ€“ What is the DPMO? โ€“ What is the Z score? โ€“ What is the cumulative probability or p(d)? โ€“ What are the Cpk and Ppk? ๏‚ง Based on the above findings, is the process capable? Copyright ยฉ 2011-2019 by Matthew J. Hansen. All Rights Reserved. No part of this publication may be reproduced, stored in a retrieval system, or transmitted by any means (electronic, mechanical, photographic, photocopying, recording or otherwise) without prior permission in writing by the author and/or publisher. 10