Downloaded 677 times

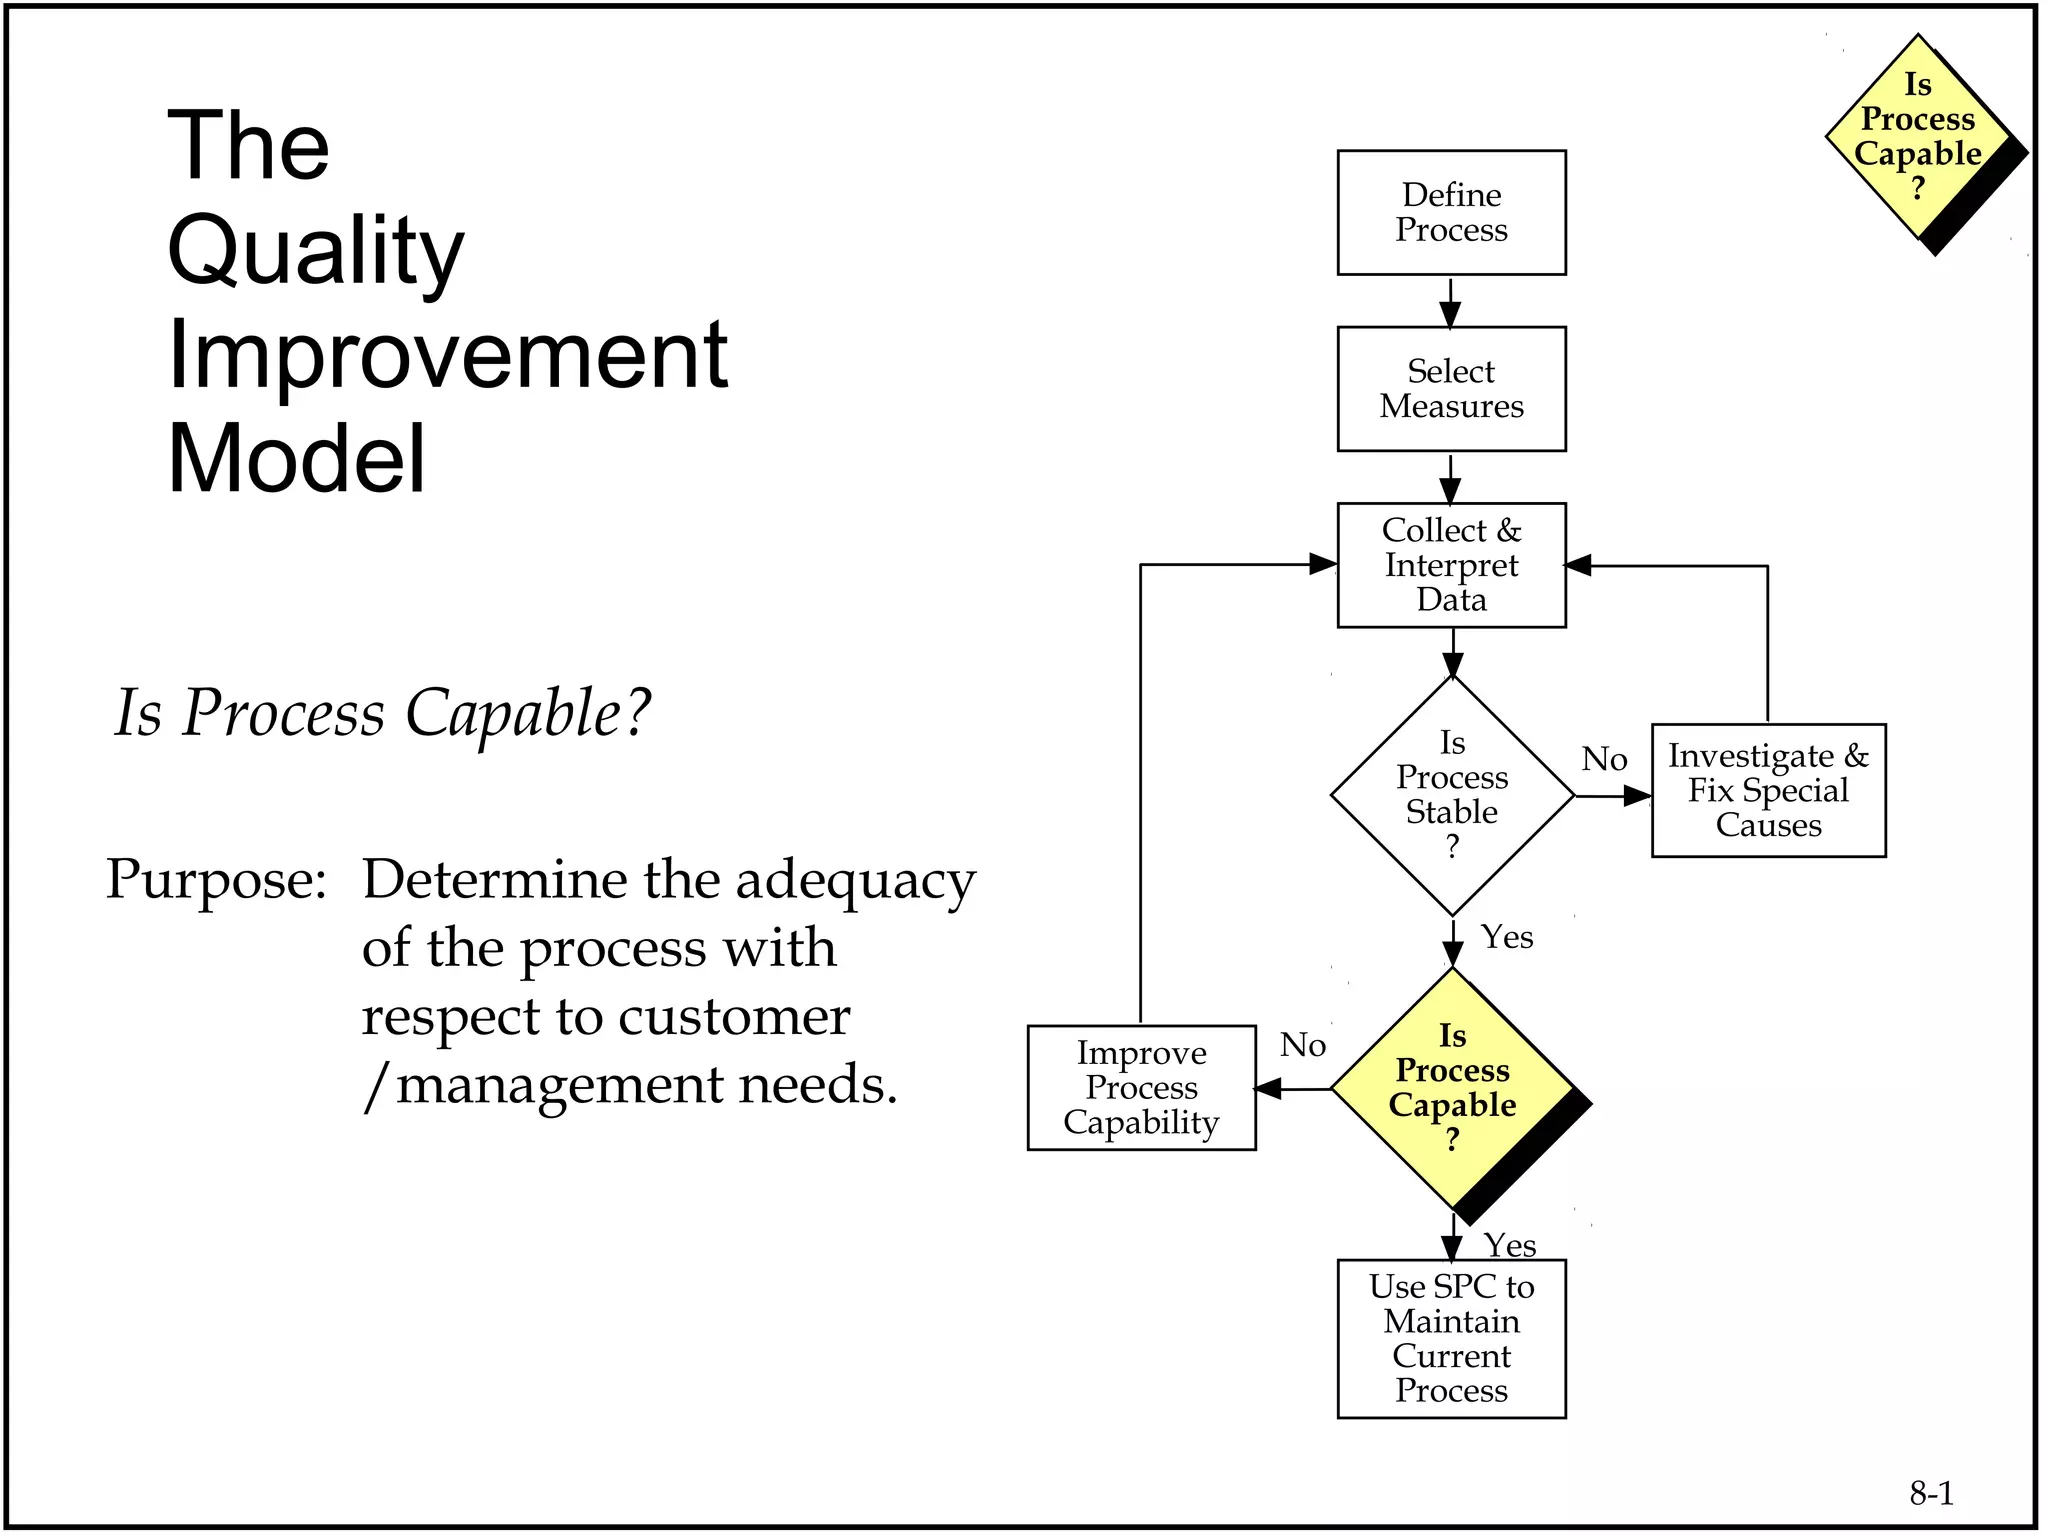
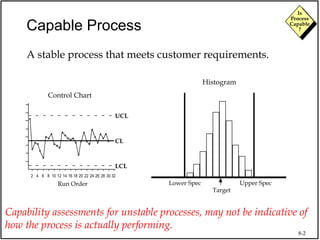
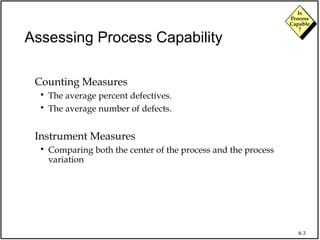
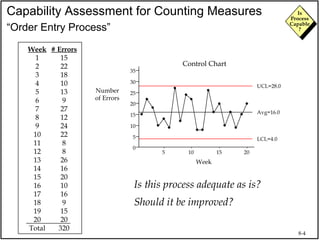
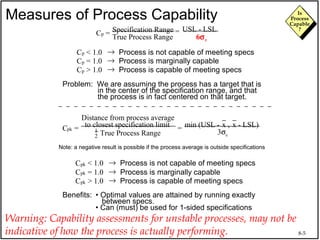
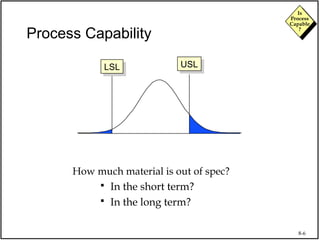
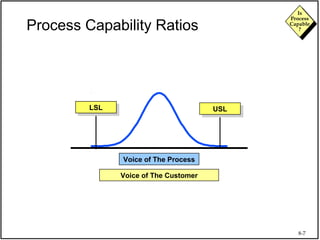
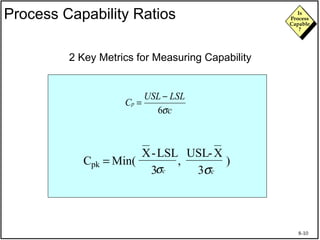
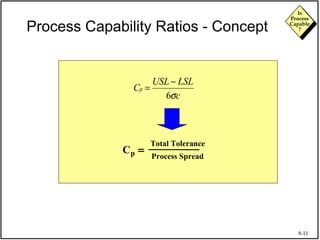
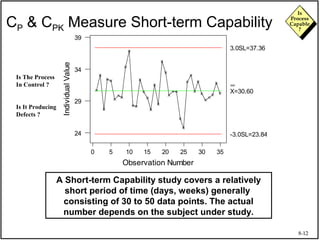
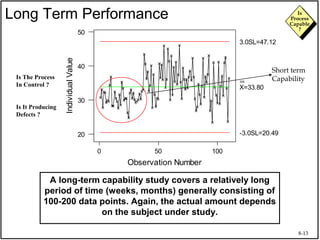
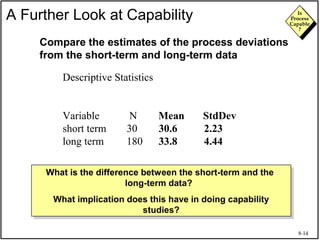
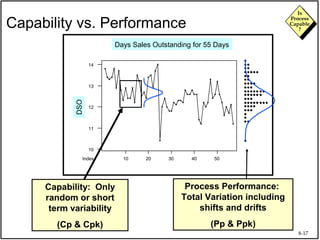
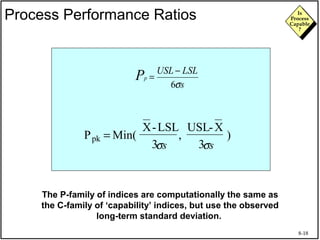
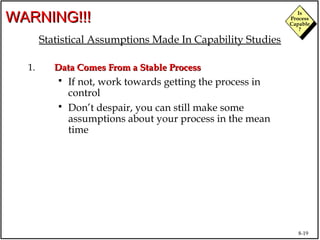

The document discusses process capability and assessing whether a process is capable of meeting customer requirements. It provides definitions of key terms like capable process, process capability ratios (Cp and Cpk), and discusses the differences between short-term and long-term capability studies. Short-term studies look at random variation over days/weeks using 30-50 data points, while long-term studies examine non-random sources of variation over weeks/months using 100-200 data points. The document warns that capability assessments only indicate potential performance if the process is stable and in control.


![Process Capability[1]](https://cdn.slidesharecdn.com/ss_thumbnails/processcapability1-1226090261326164-9-thumbnail.jpg?width=640&height=640&fit=bounds)


