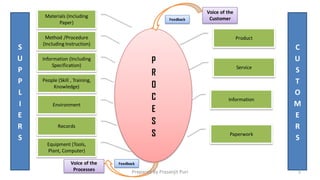
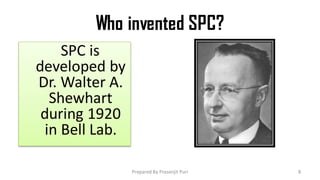
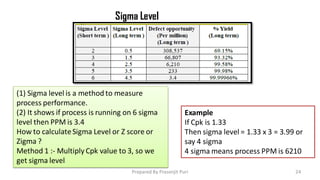
Quality Core Tool
What is a SPC?
Controlling the process variation by
using statistics is called SPC
(Statistical Process Control)
Basic principal of SPC is to reduce
variation.
2
Prepared By Prasenjit Puri
What is a Statistics?
The set of information derived
from the sample data to
estimate the process
(Population) are called statistics.
3
Prepared By Prasenjit Puri
What is a process?
A process is any activity or set
of activities that use
resources to transform inputs
into outputs
4
Prepared By Prasenjit Puri
P
R
O
C
E
S
S
S
U
P
P
L
I
E
R
S
C
U
S
T
O
M
E
R
S
Materials (Including
Paper)
Method /Procedure
(Including Instruction)
Information (Including
Specification)
People (Skill , Training,
Knowledge)
Environment
Records
Equipment (Tools,
Plant, Computer)
Product
Service
Information
Paperwork
Feedback
Voice of the
Processes
Feedback
Voice of the
Customer
5
Prepared By Prasenjit Puri
Capability
Can we
do the job
correctly?
Control
Are we
doing the
job
correctly?
Quality
Assurance
Have we
done the
job
correctly?
improvement
Could we
do the job
better?
6
Prepared By Prasenjit Puri
What is a Control?
Ensuring to make a variable to
be with in the stated limit.
Controlling process & comparing actual performance against
set target then identifying when & what corrective actions
are necessary to achieve the target.
7
Prepared By Prasenjit Puri
Who invented SPC?
SPC is
developed by
Dr. Walter A.
Shewhart
during 1920
in Bell Lab.
8
Prepared By Prasenjit Puri
Why we Use SPC?
 In ever-increasing competition, companies must make an effort for
continuous improvement in quality, efficiency & cost reduction.
 Many companies still follow inspection after production for
detecting quality related issues.
SPC helps to company to move
towards prevention based quality
controls instead of detection based
quality control. By monitoring the
graph we can easily predict behavior
of the process & we can get good
quality of product.
9
Prepared By Prasenjit Puri
Where to Use SPC?
 Apply where unnecessary waste is generated
like. Re-work, scrap & Re inspection time.
 We can implement SPC for the critical
Characteristics of the design or operation
mentioned in DFMEA or PFMEA.
10
Prepared By Prasenjit Puri
What is variation ?
Difference between actual output
and desired output is called
variation.
One problem with mother nature is , Everything is different, No two
things produces same in the world. By all efforts we can only reduce
the gap between the two. This gap is known as variation.
11
Prepared By Prasenjit Puri
Why do we want to reduce the variation ?
Variation can not be eliminate, only
we can minimize the variation.
Because variation is the main source of wastage, undesired reworks,
rejection, customer dissatisfaction and many hidden, un-coverable
costs.
12
Prepared By Prasenjit Puri
Measures of accuracy or centring
Process Location :- Mean of the process shows the location of process. It is
mean value or say average value.
Note :- How much our
process location is shift from
customer location
is tell that how much worst is
our process running.
Mean (or arithmetic average):This is simply the average of the observations,the sum
of all the measurementsdivided by the number of the observations.
13
Prepared By Prasenjit Puri
Measures of precision or spread
Range: The range is the difference between the highest and the lowest
observations and is the simplest possible measure of scatter. The Mean
Range , the average of all the sample ranges, may also be calculated:
14
Prepared By Prasenjit Puri
The average distance between the
individual numbers and the mean , it
is denoted by sigma.
Note :- To find total variation of process - Multiply 6 to Standard deviationor sigma.
Example :- Customer voice is 0.30
Sigma value is :- 0.04, Then 6 x 0.04 = 0.24 (Process voice) Process is in good
condition.
Note :- If our process spread is less than customer spread then our process is in good
condition.
Note :- It is thumb rule that if our process sigma value is less, then process is running in good
condition.Because sigma is process variation
15
Prepared By Prasenjit Puri
What is an SPC Chart?
The charts are selectedbased on
different two factors-
1.The data is attributeor Variable?
2.Sub group Size.
The X Bar & R Chart is one of the
most widely used charts for
Variable type.
X Bar chart displays the
variation in the sample averages
& Range Chart shows the
variations within sub group.
16
Prepared By Prasenjit Puri
X bar - R chart
Calculate process capability (Cp)
Cp = (USL-LSL) / 6σ
or
Cp = Customer specification(Voice of customer ) / Process specification(Voice of process )
Note :- 6σ is process specification
Example :- lets assume a dimension 20 ± 0.20
then USL is 20.20 and LSL is 19.80
Customer specification:- USL - LSL = 20.20 - 19.80 = 0.40
Process specification:- 6σ (lets assume σ is 0.04)
6σ = 6*0.04 = 0.24
Cp = USL-LSL / 6σ = 0.40/0.24 = 1.67
17
Prepared By Prasenjit Puri
Calculate process capability (Cp)
Requirement to find Cp ?
To find Cp we have required process
sigma only.
Limitations of Cp
Cp shows only spread of the process, It
doesn’t show the location of process
For a truly capable process
Process spread must be smaller to
customer specification
Compare voice of Process with Voice
of customer.
18
Prepared By Prasenjit Puri
What is the meaning of Cp = 1 ?
Lets assume our customer tolerance is 1mm and our
process tolerance
observed 1mm.
Then cp = Customer tolerance  process tolerance
= 1  1 =1 or 100%
Means we have used 100 % customer tolerance.
What is the meaning of Cp = 1.33 ?
Lets assume our customer tolerance is 1mm and our
process tolerance
observed 0.75 mm.
Then cp = Customer tolerance  process tolerance
= 1  0.75 =1.33
Means we have used 75 % of customer tolerance.
What is the
meaning of Cp =
1.67 ?
Lets assume our
customer tolerance
is 1mm and our
process tolerance
observed 0.60 mm.
Then cp = Customer
tolerance  process
tolerance
= 1  0.60 = 1.67
Means we have
used 60 % of
customer tolerance.
What is the meaning of Cp = 2 ?
Lets assume our customer tolerance is 1mm and our
process tolerance
observed 0.50 mm.
Then cp = Customer tolerance  process tolerance
= 1  0.50 = 2
Means we have used 50 % of customer tolerance.
What is the meaning of Cp = 0.50 ?
Lets assume our customer tolerance is 1mm and our
process tolerance
observed 2 mm.
Then cp = Customer tolerance  process tolerance
= 1  2 = 0.50
Means we have used 200 % of customer tolerance.
Conclusion :- If our Cp value lies between 1.33 to 2 then our process spread is good.
If our Cp is lies between 1 to 1.33 then immediate action is required.
If our Cp is less then 1 then our process is in worst condition, stop the
process and take high priority action.
Meaning of process capability (Cp)
19
Prepared By Prasenjit Puri
Calculate process standard deviation or sigmafor CP & CPK
σ = Ṝ/d₂
d₂ is constant varying as per sample size (n)
Calculate R (Range)
R = (Maximum value in a subgroup) -(MinimumValue in a
subgroup)
Calculate Ṝ(Range bar)
Ṝ =( R1 + R2 +……+ Rn) / k
Where , k = = Number of subgroups
There are two types of method to find sigma (σ)
(i) Root mean square method :- RMS method is used to find sigma in
Histogram , control charts, (Pp) Process performance & (Ppk) process
performance index.
(ii) σ = Ṝ/d₂ This method of find sigma is used for Cp and Cpk.
20
Prepared By Prasenjit Puri
21
Prepared By Prasenjit Puri
Calculate process capability index (Cpk)
Requirement to find Cpk ?
To find Cpk we have required
process sigma and location
(mean) of process.
Calculation for example
Suppose drawing dimension is 10±0.30 so USL = 10.30 & LSL = 9.70
Suppose process sigma = 0.1 & Mean ( ) is 10.10
Cpu = (USL - ) / 3σ = 10.30-10.10 / 3x0.10 = 0.667
Cpl = ( - LSL ) / 3σ = 10.10-9.70 / 3x0.10 = 1.33
0.667 is less then 1.33 so Cpk is 0.667
Conclusion :- If our Cpk value lies between 1.33 to 2 then our process mean is good.
If our Cpk is lies between 1 to 1.33 then immediate action is required.
If our Cpk is less then 1 then our process is in worst condition, stop the process and take high priority action.
22
Prepared By Prasenjit Puri
Note :-
(i) USL and LSL is customer limit
(ii) CL, UCL and LCL is found from
process.
(iii) If UCL and LCL is less then USL
and LSL then our process or
material is ok in opposite
condition vice versa.
(iv) If process is running on
common cause then we calculate
Cp and Cpk.
If there is any special cause in our
process then we have to first
removed
23
Prepared By Prasenjit Puri
Sigma Level
(1) Sigma level is a method to measure
process performance.
(2) It shows if process is running on 6 sigma
level then PPM is 3.4
How to calculateSigma Level or Z score or
Zigma ?
Method 1 :- Multiply Cpk value to 3, so we
get sigma level
Example
If Cpk is 1.33
Then sigma level = 1.33 x 3 = 3.99 or
say 4 sigma
4 sigma means process PPM is 6210
24
Prepared By Prasenjit Puri
Differencein process sigmaand sigma level?
(1) Sigma level is process performance. It is good for process if its value increase.
e.g. if process is running in 6 sigma level then PPM is 3.4 its good.
(2) Process sigma is Process variation. It is bad for process if its value is increase.
e.g. Cp = (USL-LSL) / 6σ
(a) lets assume USL - LSL value is 1 and sigma value is 1 then Cp = 1 / 1x6 = 0.166
We already know if Cp is less then 1 its very bad.
(b) lets assume USL - LSL value is 1 and sigma value is 0.1 then Cp = 1 / 0.1x6 = 1.66
We already know if Cp is greater then 1 then process is good.
Note :- If process sigma increase then Sigma level decrease and If process sigma
decrease then Sigma level increase which is good.
25
Prepared By Prasenjit Puri

Statistical Process Control - SPC

  • 1.
  • 2.
    What is aSPC? Controlling the process variation by using statistics is called SPC (Statistical Process Control) Basic principal of SPC is to reduce variation. 2 Prepared By Prasenjit Puri
  • 3.
    What is aStatistics? The set of information derived from the sample data to estimate the process (Population) are called statistics. 3 Prepared By Prasenjit Puri
  • 4.
    What is aprocess? A process is any activity or set of activities that use resources to transform inputs into outputs 4 Prepared By Prasenjit Puri
  • 5.
    P R O C E S S S U P P L I E R S C U S T O M E R S Materials (Including Paper) Method /Procedure (IncludingInstruction) Information (Including Specification) People (Skill , Training, Knowledge) Environment Records Equipment (Tools, Plant, Computer) Product Service Information Paperwork Feedback Voice of the Processes Feedback Voice of the Customer 5 Prepared By Prasenjit Puri
  • 6.
    Capability Can we do thejob correctly? Control Are we doing the job correctly? Quality Assurance Have we done the job correctly? improvement Could we do the job better? 6 Prepared By Prasenjit Puri
  • 7.
    What is aControl? Ensuring to make a variable to be with in the stated limit. Controlling process & comparing actual performance against set target then identifying when & what corrective actions are necessary to achieve the target. 7 Prepared By Prasenjit Puri
  • 8.
    Who invented SPC? SPCis developed by Dr. Walter A. Shewhart during 1920 in Bell Lab. 8 Prepared By Prasenjit Puri
  • 9.
    Why we UseSPC?  In ever-increasing competition, companies must make an effort for continuous improvement in quality, efficiency & cost reduction.  Many companies still follow inspection after production for detecting quality related issues. SPC helps to company to move towards prevention based quality controls instead of detection based quality control. By monitoring the graph we can easily predict behavior of the process & we can get good quality of product. 9 Prepared By Prasenjit Puri
  • 10.
    Where to UseSPC?  Apply where unnecessary waste is generated like. Re-work, scrap & Re inspection time.  We can implement SPC for the critical Characteristics of the design or operation mentioned in DFMEA or PFMEA. 10 Prepared By Prasenjit Puri
  • 11.
    What is variation? Difference between actual output and desired output is called variation. One problem with mother nature is , Everything is different, No two things produces same in the world. By all efforts we can only reduce the gap between the two. This gap is known as variation. 11 Prepared By Prasenjit Puri
  • 12.
    Why do wewant to reduce the variation ? Variation can not be eliminate, only we can minimize the variation. Because variation is the main source of wastage, undesired reworks, rejection, customer dissatisfaction and many hidden, un-coverable costs. 12 Prepared By Prasenjit Puri
  • 13.
    Measures of accuracyor centring Process Location :- Mean of the process shows the location of process. It is mean value or say average value. Note :- How much our process location is shift from customer location is tell that how much worst is our process running. Mean (or arithmetic average):This is simply the average of the observations,the sum of all the measurementsdivided by the number of the observations. 13 Prepared By Prasenjit Puri
  • 14.
    Measures of precisionor spread Range: The range is the difference between the highest and the lowest observations and is the simplest possible measure of scatter. The Mean Range , the average of all the sample ranges, may also be calculated: 14 Prepared By Prasenjit Puri
  • 15.
    The average distancebetween the individual numbers and the mean , it is denoted by sigma. Note :- To find total variation of process - Multiply 6 to Standard deviationor sigma. Example :- Customer voice is 0.30 Sigma value is :- 0.04, Then 6 x 0.04 = 0.24 (Process voice) Process is in good condition. Note :- If our process spread is less than customer spread then our process is in good condition. Note :- It is thumb rule that if our process sigma value is less, then process is running in good condition.Because sigma is process variation 15 Prepared By Prasenjit Puri
  • 16.
    What is anSPC Chart? The charts are selectedbased on different two factors- 1.The data is attributeor Variable? 2.Sub group Size. The X Bar & R Chart is one of the most widely used charts for Variable type. X Bar chart displays the variation in the sample averages & Range Chart shows the variations within sub group. 16 Prepared By Prasenjit Puri
  • 17.
    X bar -R chart Calculate process capability (Cp) Cp = (USL-LSL) / 6σ or Cp = Customer specification(Voice of customer ) / Process specification(Voice of process ) Note :- 6σ is process specification Example :- lets assume a dimension 20 ± 0.20 then USL is 20.20 and LSL is 19.80 Customer specification:- USL - LSL = 20.20 - 19.80 = 0.40 Process specification:- 6σ (lets assume σ is 0.04) 6σ = 6*0.04 = 0.24 Cp = USL-LSL / 6σ = 0.40/0.24 = 1.67 17 Prepared By Prasenjit Puri
  • 18.
    Calculate process capability(Cp) Requirement to find Cp ? To find Cp we have required process sigma only. Limitations of Cp Cp shows only spread of the process, It doesn’t show the location of process For a truly capable process Process spread must be smaller to customer specification Compare voice of Process with Voice of customer. 18 Prepared By Prasenjit Puri
  • 19.
    What is themeaning of Cp = 1 ? Lets assume our customer tolerance is 1mm and our process tolerance observed 1mm. Then cp = Customer tolerance process tolerance = 1 1 =1 or 100% Means we have used 100 % customer tolerance. What is the meaning of Cp = 1.33 ? Lets assume our customer tolerance is 1mm and our process tolerance observed 0.75 mm. Then cp = Customer tolerance process tolerance = 1 0.75 =1.33 Means we have used 75 % of customer tolerance. What is the meaning of Cp = 1.67 ? Lets assume our customer tolerance is 1mm and our process tolerance observed 0.60 mm. Then cp = Customer tolerance process tolerance = 1 0.60 = 1.67 Means we have used 60 % of customer tolerance. What is the meaning of Cp = 2 ? Lets assume our customer tolerance is 1mm and our process tolerance observed 0.50 mm. Then cp = Customer tolerance process tolerance = 1 0.50 = 2 Means we have used 50 % of customer tolerance. What is the meaning of Cp = 0.50 ? Lets assume our customer tolerance is 1mm and our process tolerance observed 2 mm. Then cp = Customer tolerance process tolerance = 1 2 = 0.50 Means we have used 200 % of customer tolerance. Conclusion :- If our Cp value lies between 1.33 to 2 then our process spread is good. If our Cp is lies between 1 to 1.33 then immediate action is required. If our Cp is less then 1 then our process is in worst condition, stop the process and take high priority action. Meaning of process capability (Cp) 19 Prepared By Prasenjit Puri
  • 20.
    Calculate process standarddeviation or sigmafor CP & CPK σ = Ṝ/d₂ d₂ is constant varying as per sample size (n) Calculate R (Range) R = (Maximum value in a subgroup) -(MinimumValue in a subgroup) Calculate Ṝ(Range bar) Ṝ =( R1 + R2 +……+ Rn) / k Where , k = = Number of subgroups There are two types of method to find sigma (σ) (i) Root mean square method :- RMS method is used to find sigma in Histogram , control charts, (Pp) Process performance & (Ppk) process performance index. (ii) σ = Ṝ/d₂ This method of find sigma is used for Cp and Cpk. 20 Prepared By Prasenjit Puri
  • 21.
  • 22.
    Calculate process capabilityindex (Cpk) Requirement to find Cpk ? To find Cpk we have required process sigma and location (mean) of process. Calculation for example Suppose drawing dimension is 10±0.30 so USL = 10.30 & LSL = 9.70 Suppose process sigma = 0.1 & Mean ( ) is 10.10 Cpu = (USL - ) / 3σ = 10.30-10.10 / 3x0.10 = 0.667 Cpl = ( - LSL ) / 3σ = 10.10-9.70 / 3x0.10 = 1.33 0.667 is less then 1.33 so Cpk is 0.667 Conclusion :- If our Cpk value lies between 1.33 to 2 then our process mean is good. If our Cpk is lies between 1 to 1.33 then immediate action is required. If our Cpk is less then 1 then our process is in worst condition, stop the process and take high priority action. 22 Prepared By Prasenjit Puri
  • 23.
    Note :- (i) USLand LSL is customer limit (ii) CL, UCL and LCL is found from process. (iii) If UCL and LCL is less then USL and LSL then our process or material is ok in opposite condition vice versa. (iv) If process is running on common cause then we calculate Cp and Cpk. If there is any special cause in our process then we have to first removed 23 Prepared By Prasenjit Puri
  • 24.
    Sigma Level (1) Sigmalevel is a method to measure process performance. (2) It shows if process is running on 6 sigma level then PPM is 3.4 How to calculateSigma Level or Z score or Zigma ? Method 1 :- Multiply Cpk value to 3, so we get sigma level Example If Cpk is 1.33 Then sigma level = 1.33 x 3 = 3.99 or say 4 sigma 4 sigma means process PPM is 6210 24 Prepared By Prasenjit Puri
  • 25.
    Differencein process sigmaandsigma level? (1) Sigma level is process performance. It is good for process if its value increase. e.g. if process is running in 6 sigma level then PPM is 3.4 its good. (2) Process sigma is Process variation. It is bad for process if its value is increase. e.g. Cp = (USL-LSL) / 6σ (a) lets assume USL - LSL value is 1 and sigma value is 1 then Cp = 1 / 1x6 = 0.166 We already know if Cp is less then 1 its very bad. (b) lets assume USL - LSL value is 1 and sigma value is 0.1 then Cp = 1 / 0.1x6 = 1.66 We already know if Cp is greater then 1 then process is good. Note :- If process sigma increase then Sigma level decrease and If process sigma decrease then Sigma level increase which is good. 25 Prepared By Prasenjit Puri