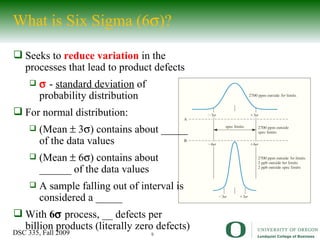
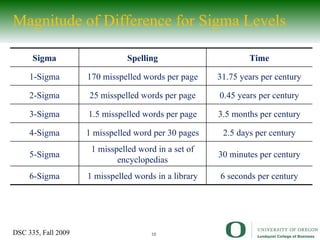
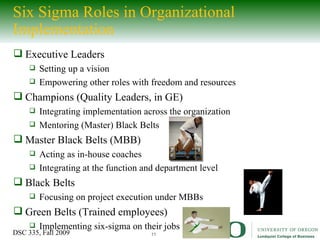
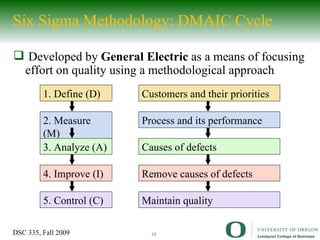
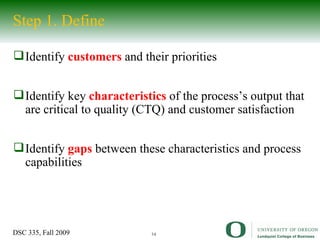
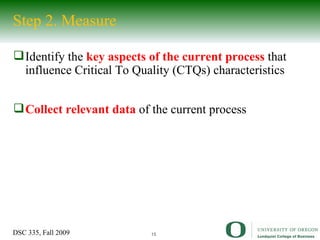
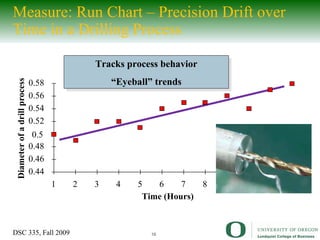
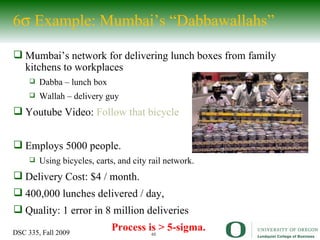
Quality and Capability DSC 335 Zhibin Yang, Assistant Professor Decision Sciences
DSC 335 Roadmap Operations Strategy Process Management Process strategy/analysis Capacity analysis/planning Quality management Lean systems Supply Chain Mgmt. Supply chain dynamics Inventory management Case: Kristen’s Cookie Case: Blanchard Littlefield Game 1 Littlefield Game 2 Case: A Pain in Chain Beer game Decision Making Tools
Quality and Capability – Outline Quality management 6-Sigma
What is Quality (quoted) Quality is hard to define and measure “… If no one knows what it is, then for all practical purposes it doesn’t exist at all. But for all practical purposes  it really does exist . What else are the grades based on? Why else would people pay for some things and throw others in the trash pile? Obviously some things are better than others – but what’s the ‘betterness’…?” --- From  Zen and the Art of Motorcycle Maintenance , by Robert Pirsig
What is Quality? Design quality : Inherent value of the product in the marketplace Dimensions  include: … Good quality does not mean luxury. Conformance quality : Degree to which the product or service design specifications are met
Total Quality Management (TQM) TQM – managing the  entire organization   so that it excels on  all dimensions  of products and services that are important as perceived by the customer Three principles of TQM Two fundamental operational goals of TQM
Quality and Capability – Outline Quality management 6-Sigma Philosophy Methodology (DMAIC) Statistics & Process Capability Index
What is Six Sigma (6  )? A philosophy and set of methods to  eliminate defects  in products and processes Developed by  Motorola   for manufacturing  Extended by  General Electric  to non-manufacturing sectors Practiced by many industrial leaders
What is Six Sigma (6  )? Seeks to  reduce variation  in the processes that lead to product defects    -  standard deviation  of probability distribution For normal distribution: (Mean     3  )  contains about _____ of the data values (Mean    6  )  contains about ______ of the data values A sample falling out of interval is considered a _____ With  6   process, __ defects per billion products (literally zero defects)
Magnitude of Difference for Sigma Levels Sigma Spelling Time 1-Sigma 170 misspelled words per page 31.75 years per century 2-Sigma 25 misspelled words per page 0.45 years per century 3-Sigma 1.5 misspelled words per page 3.5 months per century 4-Sigma 1 misspelled word per 30 pages 2.5 days per century 5-Sigma 1 misspelled word in a set of encyclopedias 30 minutes per century 6-Sigma 1 misspelled words in a library 6 seconds per century
Six Sigma Roles in Organizational Implementation Executive Leaders Setting up a vision Empowering other roles with freedom and resources Champions (Quality Leaders, in GE) Integrating implementation across the organization Mentoring (Master) Black Belts Master Black Belts (MBB) Acting as in-house coaches Integrating at the function and department level Black Belts Focusing on project execution under MBBs Green Belts (Trained employees) Implementing six-sigma on their jobs
Quality and Capability – Outline Quality management 6-Sigma Philosophy Methodology (DMAIC) Statistics & Process Capability Index
Six Sigma Methodology: DMAIC Cycle Developed by  General Electric  as a means of focusing effort on quality using a methodological approach 1. Define (D) 2. Measure (M) 3. Analyze (A) 4. Improve (I) 5. Control (C) Customers and their priorities Process and its performance Causes of defects Remove causes of defects Maintain quality
Step 1. Define Identify  customers  and their priorities Identify key  characteristics  of the process’s output that are critical to quality (CTQ) and customer satisfaction Identify  gaps  between these characteristics and process capabilities
Step 2. Measure Identify the  key aspects of the current process  that influence Critical To Quality (CTQs) characteristics  Collect relevant data  of the current process
Measure: Run Chart – Precision Drift over Time in a Drilling Process Tracks process behavior “ Eyeball” trends 0.44 0.46 0.48 0.5 0.52 0.54 0.56 0.58 1 2 3 4 5 6 7 8 9 10 11 12 Time (Hours) Diameter of a drill process
Measure: Pareto Charts Focus on most important problems using the 80/20 rule Assy. Instruc. Frequency Design Purch. Training Others 80%
Step 3. Analyze – Diagnose Root Cause  Effect Possible categories of causes Symptoms /effects Equipment Environment Materials Methods People  Fishbone Diagram
Analysis: 5 Whys A question-asking method used to explore the cause/effect relationships Example: My car will not start. (the problem) Why?  - The battery is dead. (first why) Why?  - The alternator is not functioning. (second why) Why?  - The alternator belt has broken. (third why) Why?  - The alternator belt was well beyond its useful service life and has never been replaced. (fourth why) Why?  - I have not been maintaining my car according to the recommended service schedule. (fifth why, a  root cause )
Step 5. Control Use tools such as statistical process control chart to maintain the level of quality
Quality and Capability – Outline Quality management 6-Sigma Philosophy Methodology (DMAIC) Statistics & Process Capability Index
Six Sigma Statistics Control charts and control limits Tolerance Limits and process capabilities
Control Charts and Control Limits Set  Upper Control Limits  (UCL) and  Lower Control Limits  (LCL) Example: Not too much or too little raisin in cereal On average a box of cereal contains 80 grams of raisin. The quality is considered good if the amount of raisin is more than 75 grams and less than 85 grams. Your control limits are  LCL = ___ and  UCL = ___ grams.
Control Charts and Control Limits  x  (central line): ______________________________ UCL and LCL define __________________________  x 970 980 990 1000 1010 1020 0 1 2 3 4 5 6 7 8 9 10 11 12 13 14 15 LCL UCL
Use Control Charts & Control Limits Plot your samples / observations of a process When observation falls outside control limits You must take action – ____________________________ A process is called “________”, if samples are reliably within the control limits  x 970 980 990 1000 1010 1020 0 1 2 3 4 5 6 7 8 9 10 11 12 13 14 15 LCL UCL
Typical Control Limits UCL =  x  +  3  ; UCL =  x  –  3   x  – Average of past sample means   –  standard deviation of a process distribution 3   is taken to be “natural variation” Covering 99.73% occurrences Only 3 in 1,000 are out of control limits Out of control observations do occur, but infrequently  x LCL =  x  –  3    UCL =  x  +  3    99.73%
Statistical Process Control (SPC) Charts Normal Behavior Possible problem, investigate UCL LCL 1  2  3  4  5  6 Time UCL LCL 1  2  3  4  5  6 Time
Tolerance Limits (a.k.a. specification in text) Example: Not too much or too little raisin (con ’ t) A  customer  might complain if there is more than 90 grams or less than 70 grams of raisin So, you obtain the  tolerance limits : LTL = ___ g UTL =  ___  g
Tolerance limits set performance target of a process Control limits characterize the current process Tolerance Limits vs Control Limits Tolerance Limits  Control Limits Who determines? What type of quality does it pertain to? What happens beyond limits?
Tolerance Limits vs Control Limits Ideally,   3σ control limits fall within tolerance limits. This makes the process easy to monitor and avoid defects. 970 980 990 1000 1010 1020 0 1 2 3 4 5 6 7 8 9 10 11 12 13 14 15 LCL=  X – 3 σ UCL=  X + 3 σ LTL UTL
(cont’d) But, we’re not always so lucky… Depends on the spread of the distribution We need to measure how well the process is satisfying customers (or the designer) LTL UTL 970 980 990 1000 1010 1020 0 1 2 3 4 5 6 7 8 9 10 11 12 13 14 15 LCL=  X – 3 σ UCL=  X + 3 σ
Process Capability Index,  C pk Process Capability Index  measures how well the process is  centered  as well as whether the  variability  is acceptable  Based on closest tolerance limit.
Cases of Process Capability Index C pk  >1, the process is _______ ___________ C pk  = 1 C pk  < 1, the process is _______ ____________ LTL UTL LTL UTL LTL UTL LCL UCL LCL UCL LCL UCL
Not too many or too few raisins in cereal (con’t) LTL = 70g, UTL = 90g,   x  = 80,    = 3 Process capability index C pk  = What is  x  shift to 84? C pk  = Example
Improving Process Capability by Variance Reduction LCL UCL 99.73 % LCL UCL 99.73 % 99.73 % Even if the process distribution is not centered LTL UTL σ  = 10 LTL UTL σ  = 5 σ  = 10 LTL UTL LTL UTL σ  = 5 99.73 %
A metal fabricator produces connecting rods with an outer diameter that has a 1  plus/minus 0.01 inch specification. A machine operator takes several sample measurements over time and determines the sample mean outer diameter to be 1.002 inches with a standard deviation of 0.003 inch. Calculate the  process capability index  for this example What does the index tell you about the process This process is  not capable at present  due to the process mean off the center. The process center should be adjusted. Exercise: Process Capability
(cont’d) Suppose the production manager can improve the process by reducing the standard deviation,   , of the process At what value of   , the process would be capable of process?
Effect of # of Parts / steps in a Process Quality drops as # processing steps increases 6   process remains high quality than a 6   process Probability that process meets specs 0.0% 0.05% 0.1% 1.0% 10.0% 100.0% 1 10 100 1000 10K 100K 1M # parts / steps 6 - sigma 5 - sigma 4 - sigma 3 - sigma
6   Example: Mumbai’s “Dabbawallahs” Mumbai’s network for delivering lunch boxes from family kitchens to workplaces Dabba – lunch box Wallah – delivery guy Youtube Video:  Follow that bicycle Employs 5000 people. Using bicycles, carts, and city rail network. Delivery Cost: $4 / month. 400,000 lunches delivered / day,  Quality: 1 error in 8 million deliveries Process is > 5-sigma.

Quality andc apability hand out 091123200010 Phpapp01

  • 1.
    Quality and CapabilityDSC 335 Zhibin Yang, Assistant Professor Decision Sciences
  • 2.
    DSC 335 RoadmapOperations Strategy Process Management Process strategy/analysis Capacity analysis/planning Quality management Lean systems Supply Chain Mgmt. Supply chain dynamics Inventory management Case: Kristen’s Cookie Case: Blanchard Littlefield Game 1 Littlefield Game 2 Case: A Pain in Chain Beer game Decision Making Tools
  • 3.
    Quality and Capability– Outline Quality management 6-Sigma
  • 4.
    What is Quality(quoted) Quality is hard to define and measure “… If no one knows what it is, then for all practical purposes it doesn’t exist at all. But for all practical purposes it really does exist . What else are the grades based on? Why else would people pay for some things and throw others in the trash pile? Obviously some things are better than others – but what’s the ‘betterness’…?” --- From Zen and the Art of Motorcycle Maintenance , by Robert Pirsig
  • 5.
    What is Quality?Design quality : Inherent value of the product in the marketplace Dimensions include: … Good quality does not mean luxury. Conformance quality : Degree to which the product or service design specifications are met
  • 6.
    Total Quality Management(TQM) TQM – managing the entire organization so that it excels on all dimensions of products and services that are important as perceived by the customer Three principles of TQM Two fundamental operational goals of TQM
  • 7.
    Quality and Capability– Outline Quality management 6-Sigma Philosophy Methodology (DMAIC) Statistics & Process Capability Index
  • 8.
    What is SixSigma (6  )? A philosophy and set of methods to eliminate defects in products and processes Developed by Motorola for manufacturing Extended by General Electric to non-manufacturing sectors Practiced by many industrial leaders
  • 9.
    What is SixSigma (6  )? Seeks to reduce variation in the processes that lead to product defects  - standard deviation of probability distribution For normal distribution: (Mean  3  ) contains about _____ of the data values (Mean  6  ) contains about ______ of the data values A sample falling out of interval is considered a _____ With 6  process, __ defects per billion products (literally zero defects)
  • 10.
    Magnitude of Differencefor Sigma Levels Sigma Spelling Time 1-Sigma 170 misspelled words per page 31.75 years per century 2-Sigma 25 misspelled words per page 0.45 years per century 3-Sigma 1.5 misspelled words per page 3.5 months per century 4-Sigma 1 misspelled word per 30 pages 2.5 days per century 5-Sigma 1 misspelled word in a set of encyclopedias 30 minutes per century 6-Sigma 1 misspelled words in a library 6 seconds per century
  • 11.
    Six Sigma Rolesin Organizational Implementation Executive Leaders Setting up a vision Empowering other roles with freedom and resources Champions (Quality Leaders, in GE) Integrating implementation across the organization Mentoring (Master) Black Belts Master Black Belts (MBB) Acting as in-house coaches Integrating at the function and department level Black Belts Focusing on project execution under MBBs Green Belts (Trained employees) Implementing six-sigma on their jobs
  • 12.
    Quality and Capability– Outline Quality management 6-Sigma Philosophy Methodology (DMAIC) Statistics & Process Capability Index
  • 13.
    Six Sigma Methodology:DMAIC Cycle Developed by General Electric as a means of focusing effort on quality using a methodological approach 1. Define (D) 2. Measure (M) 3. Analyze (A) 4. Improve (I) 5. Control (C) Customers and their priorities Process and its performance Causes of defects Remove causes of defects Maintain quality
  • 14.
    Step 1. DefineIdentify customers and their priorities Identify key characteristics of the process’s output that are critical to quality (CTQ) and customer satisfaction Identify gaps between these characteristics and process capabilities
  • 15.
    Step 2. MeasureIdentify the key aspects of the current process that influence Critical To Quality (CTQs) characteristics Collect relevant data of the current process
  • 16.
    Measure: Run Chart– Precision Drift over Time in a Drilling Process Tracks process behavior “ Eyeball” trends 0.44 0.46 0.48 0.5 0.52 0.54 0.56 0.58 1 2 3 4 5 6 7 8 9 10 11 12 Time (Hours) Diameter of a drill process
  • 17.
    Measure: Pareto ChartsFocus on most important problems using the 80/20 rule Assy. Instruc. Frequency Design Purch. Training Others 80%
  • 18.
    Step 3. Analyze– Diagnose Root Cause Effect Possible categories of causes Symptoms /effects Equipment Environment Materials Methods People Fishbone Diagram
  • 19.
    Analysis: 5 WhysA question-asking method used to explore the cause/effect relationships Example: My car will not start. (the problem) Why?  - The battery is dead. (first why) Why?  - The alternator is not functioning. (second why) Why?  - The alternator belt has broken. (third why) Why?  - The alternator belt was well beyond its useful service life and has never been replaced. (fourth why) Why?  - I have not been maintaining my car according to the recommended service schedule. (fifth why, a root cause )
  • 20.
    Step 5. ControlUse tools such as statistical process control chart to maintain the level of quality
  • 21.
    Quality and Capability– Outline Quality management 6-Sigma Philosophy Methodology (DMAIC) Statistics & Process Capability Index
  • 22.
    Six Sigma StatisticsControl charts and control limits Tolerance Limits and process capabilities
  • 23.
    Control Charts andControl Limits Set Upper Control Limits (UCL) and Lower Control Limits (LCL) Example: Not too much or too little raisin in cereal On average a box of cereal contains 80 grams of raisin. The quality is considered good if the amount of raisin is more than 75 grams and less than 85 grams. Your control limits are LCL = ___ and UCL = ___ grams.
  • 24.
    Control Charts andControl Limits  x (central line): ______________________________ UCL and LCL define __________________________  x 970 980 990 1000 1010 1020 0 1 2 3 4 5 6 7 8 9 10 11 12 13 14 15 LCL UCL
  • 25.
    Use Control Charts& Control Limits Plot your samples / observations of a process When observation falls outside control limits You must take action – ____________________________ A process is called “________”, if samples are reliably within the control limits  x 970 980 990 1000 1010 1020 0 1 2 3 4 5 6 7 8 9 10 11 12 13 14 15 LCL UCL
  • 26.
    Typical Control LimitsUCL =  x + 3  ; UCL =  x – 3   x – Average of past sample means  – standard deviation of a process distribution 3  is taken to be “natural variation” Covering 99.73% occurrences Only 3 in 1,000 are out of control limits Out of control observations do occur, but infrequently  x LCL =  x – 3  UCL =  x + 3  99.73%
  • 27.
    Statistical Process Control(SPC) Charts Normal Behavior Possible problem, investigate UCL LCL 1 2 3 4 5 6 Time UCL LCL 1 2 3 4 5 6 Time
  • 28.
    Statistical Process Control(SPC) Charts Normal Behavior Possible problem, investigate UCL LCL 1 2 3 4 5 6 Time UCL LCL 1 2 3 4 5 6 Time
  • 29.
    Tolerance Limits (a.k.a.specification in text) Example: Not too much or too little raisin (con ’ t) A customer might complain if there is more than 90 grams or less than 70 grams of raisin So, you obtain the tolerance limits : LTL = ___ g UTL = ___ g
  • 30.
    Tolerance limits setperformance target of a process Control limits characterize the current process Tolerance Limits vs Control Limits Tolerance Limits Control Limits Who determines? What type of quality does it pertain to? What happens beyond limits?
  • 31.
    Tolerance Limits vsControl Limits Ideally,  3σ control limits fall within tolerance limits. This makes the process easy to monitor and avoid defects. 970 980 990 1000 1010 1020 0 1 2 3 4 5 6 7 8 9 10 11 12 13 14 15 LCL=  X – 3 σ UCL=  X + 3 σ LTL UTL
  • 32.
    (cont’d) But, we’renot always so lucky… Depends on the spread of the distribution We need to measure how well the process is satisfying customers (or the designer) LTL UTL 970 980 990 1000 1010 1020 0 1 2 3 4 5 6 7 8 9 10 11 12 13 14 15 LCL=  X – 3 σ UCL=  X + 3 σ
  • 33.
    Process Capability Index, C pk Process Capability Index measures how well the process is centered as well as whether the variability is acceptable Based on closest tolerance limit.
  • 34.
    Cases of ProcessCapability Index C pk >1, the process is _______ ___________ C pk = 1 C pk < 1, the process is _______ ____________ LTL UTL LTL UTL LTL UTL LCL UCL LCL UCL LCL UCL
  • 35.
    Not too manyor too few raisins in cereal (con’t) LTL = 70g, UTL = 90g,  x = 80,  = 3 Process capability index C pk = What is  x shift to 84? C pk = Example
  • 36.
    Improving Process Capabilityby Variance Reduction LCL UCL 99.73 % LCL UCL 99.73 % 99.73 % Even if the process distribution is not centered LTL UTL σ = 10 LTL UTL σ = 5 σ = 10 LTL UTL LTL UTL σ = 5 99.73 %
  • 37.
    A metal fabricatorproduces connecting rods with an outer diameter that has a 1  plus/minus 0.01 inch specification. A machine operator takes several sample measurements over time and determines the sample mean outer diameter to be 1.002 inches with a standard deviation of 0.003 inch. Calculate the process capability index for this example What does the index tell you about the process This process is not capable at present due to the process mean off the center. The process center should be adjusted. Exercise: Process Capability
  • 38.
    (cont’d) Suppose theproduction manager can improve the process by reducing the standard deviation,  , of the process At what value of  , the process would be capable of process?
  • 39.
    Effect of #of Parts / steps in a Process Quality drops as # processing steps increases 6  process remains high quality than a 6  process Probability that process meets specs 0.0% 0.05% 0.1% 1.0% 10.0% 100.0% 1 10 100 1000 10K 100K 1M # parts / steps 6 - sigma 5 - sigma 4 - sigma 3 - sigma
  • 40.
    6  Example: Mumbai’s “Dabbawallahs” Mumbai’s network for delivering lunch boxes from family kitchens to workplaces Dabba – lunch box Wallah – delivery guy Youtube Video: Follow that bicycle Employs 5000 people. Using bicycles, carts, and city rail network. Delivery Cost: $4 / month. 400,000 lunches delivered / day, Quality: 1 error in 8 million deliveries Process is > 5-sigma.

Editor's Notes

  • #5 You know what quality is, yet you don’t know what it is That’s self-contradictory. Some things are better than others. That is, they have more quality. But when you try to say what the quality is, there’s nothing to talk about. But if you can’t say what quality is, how do you know what it is, or how do you know that it even exists?
  • #6 7
  • #7 3
  • #9 Since it was originally developed, Six Sigma has become an element of many Total Quality Management ( TQM ) initiatives. The process was pioneered by Bill Smith at Motorola in 1986[2] and was originally defined[3] as a metric for measuring defects and improving quality, and a methodology to reduce defect levels below 3.4 Defects Per (one) Million Opportunities (DPMO). Six Sigma is a registered service mark and trademark of Motorola , Inc.[4] Motorola has reported over US$17 billion in savings[5] from Six Sigma as of 2006 . If I am talking to you about six sigma, what is the first thing coming to your mind? Consider the hot-selling, super-slim Razr phone. A creative, innovative design, sure. Yet &amp;quot;Six Sigma&apos;s stamp is all over the Razr,&amp;quot; says Michael S. Potosky, Motorola&apos;s corporate director of Six Sigma. Engineers, for instance, applied the process to the phone&apos;s antenna, helping keep it hidden while maintaining call clarity. GE first began Six Sigma in 1995, after Motorola and Allied Signal blazed the trail. In 1996, Six Sigma cost GE USD 200 million with a ROI of USD 150 million. The following year it cost them USD 400 million with returns of USD 600 million. And then in 1998 they hit the jackpot ; the programme cost USD 400 million with returns of more than USD 1 billion. GE went on to estimated benefits in the order of USD 10 billion during the first five years of &apos;&apos; Six Sigma &apos; implementation. About 35% of U.S. companies have a Six Sigma program in place, according to a January, 2006, Bain &amp; Co. study.
  • #10 Say ss is about reducing variation. Walk to the bb, and draw the normal curves. Why &amp;quot;Sigma&amp;quot;? The word is a statistical term that measures how far a given process deviates from perfection. The central idea behind Six Sigma is that if you can measure how many &amp;quot;defects&amp;quot; you have in a process, you can systematically figure out how to eliminate them and get as close to &amp;quot;zero defects&amp;quot; as possible. To achieve Six Sigma Quality, a process must produce no more than 2 defects per billion opportunities
  • #11 6 sigma: 2 in a billion will be defective.
  • #15 4
  • #16 4
  • #18 12 Pareto Diagram - Focuses our efforts on the problems that have the greatest potential for improvement by showing relative frequency and/or size in a descending bar graph. Based on the proven Pareto principle: 20% of the sources cause 80% of any problems.
  • #19 17 Can be used to systematically track backwards to find a possible cause of a quality problem (or effect)
  • #23 28
  • #28 16
  • #29 16
  • #34 As process standard deviation goes up, or the mean of the process moves away from the center of the tolerance, the Process Capability sigma number goes down