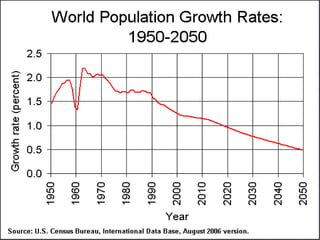
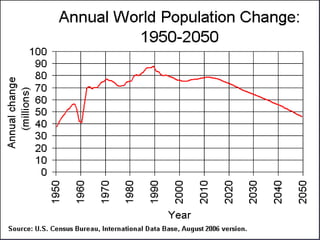
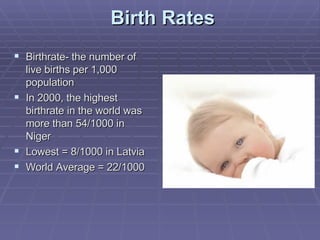
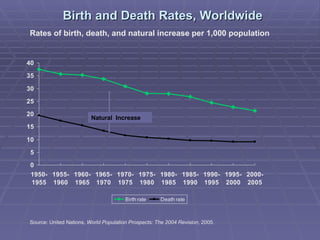
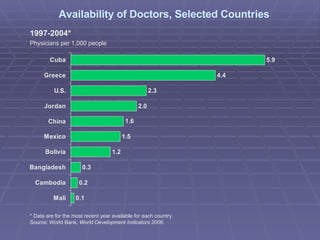
Population
What is Population? The collection of people living in a given geographic area, or space, usually measured by a census Demography The study of human populations Various aspects of human behavior in populations are studied in Sociology, Economics, and Geography The study of populations is almost always governed by the laws of probability  www.census.gov/main/www/popclock.html
 
World and Population Statistics World Population: 6.5 Billion-2006 World Population Information
World Population Clock 2005 Source: Population Reference Bureau,  2005 World Population Data Sheet . 137 151 2 154 Minute 197,004   217,971   3,383   221,354   Day 71,906,587   79,559,311   1,234,907   80,794,218   Year Less Developed Countries (less China) Less Developed Countries More Developed Countries World Natural Increase per
World Vital Events Per Time Unit: 2006 Births  Deaths Natural Increase Year    132,434,587  55,220,152  77,214,435   Month  11,036,216  4,601,679  6,434,536   Day  362,834  151,288  211,546   Hour  15,118  6,304  8,814   Minute  252  105  147   Second  4.2  1.8  2.4
Worldwide Population Growth Earth’s population hit 1 Billion in the early 1800’s As the world industrialized, people grew more and better food Also, people improved their sanitation methods This combination enabled the population to boom
World Population Growth, in Billions Number of years to add each billion (year) All of Human History (1800) 130 (1930) 30 (1960) 15 (1975) 12 (1987) 12 (1999) 14 (2013) 14 (2027) 21 (2048) Sources: First and second billion: Population Reference Bureau. Third through ninth billion: United Nations,  World Population Prospects: The 2004 Revision  (medium scenario), 2005.
 
World Population Growth Through History A.D. 2000 A.D. 1000 A.D. 1 1000 B.C. 2000 B.C. 3000 B.C. 4000 B.C. 5000 B.C. 6000 B.C. 7000 B.C. 1+ million  years 8 7 6 5 2 1 4 3 Old Stone Age New Stone Age Bronze Age Iron Age Middle Ages Modern Age Black Death — The Plague 9 10 11 12 A.D. 3000 A.D. 4000 A.D. 5000 1800 1900 1950 1975 2000 2100 Future Billions Source: Population Reference Bureau; and United Nations,  World Population Projections to 2100  (1998).
Population Growth What area of the world do you think has the highest rate and lowest rate of population growth from 2000-2005?  GeoHive List actual
 
Projected Population Change, by Country Source: Population Reference Bureau,  2005 World Population Data Sheet . Percent Population Change, 2005-2050
Source: United Nations,  World Population Prospects: The 2004 Revision  (2005). World population, 1950-2050 (projected) Global Population Growth: A Developing-Country Phenomenon
 
 
Trends in Population Growth Worldwide Population Increase and Growth Rate, Five-Year Periods Millions Percent increase per year Source: United Nations,  World Population Prospects: The 2004 Revision  (medium scenario), 2005.
Notes on Trends in Population Growth Worldwide Over the period 1985-1995, the population growth rate declined (a reflection of declining fertility), yet millions of people were added to the world’s population (which peaked around 1985, when 87 million people were added each year).  From 2000 on, the growth rate will continue to decline.  Between 2015 and 2020, we will still be adding 72 million people each year. Why?  Because the generation of women now having their children is very large as the result of high fertility in their mothers’ and grandmothers’ generations.
Birth Rates Birthrate- the number of live births per 1,000 population In 2000, the highest birthrate in the world was more than 54/1000 in Niger Lowest = 8/1000 in Latvia World Average = 22/1000
 
 
Birth and Death Rates, Worldwide Rates of birth, death, and natural increase per 1,000 population Natural  Increase Source: United Nations,  World Population Prospects: The 2004 Revision , 2005.
Fertility Rate Shows the average number of children a woman of childbearing years  would  have in her lifetime A fertility rate of 2.1 is necessary just to replace current population Today, the worldwide average fertility rate is about 2.59
Fertility Rates What do you think the average number of babies each woman has in the world? US? What do you think the highest average is? Where? CIA - The World  Factbook  - Guide to Country Profiles
 
10 Places With the Lowest Total Fertility Worldwide Average number of children per woman, 2000-2005 Source: United Nations,  World Population Prospects: The 2004 Revision , 2005.
Women of Childbearing Age Number of Women 15 to 49 Billions Source: United Nations,  World Population Prospects: The 2004 Revision  (medium scenario), 2005.
Women of Childbearing Age and Fertility Worldwide Source: United Nations,  World Population Prospects: The 2004 Revision  (medium scenario), 2005.
Diverging Trends in Fertility Reduction Average number of children per woman Source: United Nations,  World Population Prospects: The 2004 Revision , 2005.
Questions to Consider Why is the world’s population increasing but the growth rate is decreasing? Why is the world’s population growing so quickly? What problems/implications does this growth bring about?
Mortality Rate Also called the death rate Number of deaths per 1,000 people Generally, a society is considered healthy if it has a low mortality rate However, some healthy nations have higher mortality rates because they have large numbers of elderly people
Birth and Death Rates, Worldwide Rates of birth, death, and natural increase per 1,000 population Natural  Increase Source: United Nations,  World Population Prospects: The 2004 Revision , 2005.
Life Expectancy How long a person is expected to live Which countries do you think have the highest and lowest life expectancy at birth? GeoHive   List actual
Trends in Life Expectancy, by Region Life Expectancy at Birth, in Years Source: United Nations,  World Population Prospects: The 2004 Revision  (medium scenario), 2005.
Infant Mortality Rate For this reason, geographers also look at infant mortality rates  Infant Mortality Rate Shows the number of deaths among infants under age 1 per 1,000 live births In the 1800’s, the worldwide I.M.R. was 300/1,000
 
Rate of Natural Increase Birthrate – Death Rate B-D = R A.K.A. = Population Growth Rate
Birth and Death Rates, Worldwide Rates of birth, death, and natural increase per 1,000 population Natural  Increase Source: United Nations,  World Population Prospects: The 2004 Revision , 2005.
Human Population Growth Rate
Population Pyramid Another way to analyze populations is to use a population pyramid PP = a graphic device that shows sex & age distribution of a population Allows geographers to examine how events in society, such as wars, famine, or epidemics, affect the population of a country or region
Age Distribution of the World’s Population Population Structures by Age and Sex, 2005  Millions Less Developed Regions More Developed Regions Male Female Male Female 80+ 75-79 70-74 65-69 60-64 55-59 50-54 45-49 40-44 35-39 30-34 25-29 20-24 15-19 10-14 5-9 0-4 Age Source: United Nations,  World Population Prospects: The 2004 Revision , 2005.


Population Density The average number of people who live in a measurable area, such as a square mile The number is reached by dividing the number of inhabitants in an area by the total amount of land they occupy Geographers use this to understand how heavily populated an area is Which countries do you think are the most densely populated? GeoHive List actual
 
 
Population Density This number can be misleading for an entire nation Why? Example: U.S. P.D.    1990 Alaska = huge land area, small population  1 person per square mile New Jersey = small land area, large population 1,098 people per square mile Total U.S. Population Density = 70.3 people per square mile
Carrying Capacity The number of individuals an environment can support without significant negative impacts A region with fertile land may be able to support far more people than one with land of poor quality or with little land available for cultivation Technology Level of technology of a group living on the land may affect carrying capacity
Carrying Capacity
 
Land Area Write what you think the five largest countries(land area) are. GeoHive List actual
 
Population Distribution Of the billions of people in the world, most are not distributed equally across the earth Some lands are not suitable for human habitation Examples? Almost 90% of the world’s population lives in the Northern Hemisphere N.H.- ½ of the planets surface, which is north of the equator
 
Population Distribution 1 in 4 people in the world live in East Asia, and 1 in 2 people live in either East Asia or South Asia Factors: Climate Altitude Access to water All influence where people live
Urban-Rural Mix Currently, more than ½ of the world’s population lives in rural areas However, this number is changing rapidly More and more people are migrating to cities Particularly, cities with populations of more than one million people
Trends in Urbanization, by Region Urban Population Percent Source: United Nations,  World Urbanization Prospects: The 2003 Revision  (medium scenario), 2004.
 
World Population by Country List what you think the top ten populated countries in the world were/are/will be in 1950, 2006 and 2050. GeoHive GeoHive List actual
54 107,000,000          Mexico 11 337 127,000,000          Japan 10 139 131,530,000          Nigeria 9 8 142,800,000          Russia 8 1,002 145,000,000          Bangladesh 7 202 164,000,000          Pakistan 6 21 186,405,000          Brazil 5 126 222,781,000          Indonesia 4 30 300,000,000          United States 3 328 1,110,000,000          India 2 136 1,315,844,000          China 1 43 6,661,208,350 World — Density   (people/ km²) Population Country Rank
 
Population development of the largest countries from 1950 to 2050
 
Largest Metropolitan Areas List what you think the 10 largest metropolitan areas are in world. GeoHive List Actual GeoHive   --2015 Projected GeoHive   --1950-2015 Met. Areas
Megacities In 1950, New York City was the only World City with more than 10 million residents Today, 26 giant cities are home to a total of more than 250 million people The largest of these is Tokyo 34 million inhabitants These huge cities struggle with overcrowded conditions and immense demand for water & sanitation


Largest Cities List what you think the 10 largest cities are in world. GeoHive List actial
April 2007 Update http://www.census.gov/Press-Release/www/releases/archives/population/009865.html http://www.cnn.com/2007/US/04/05/metro.population.ap/index.html
 
 
Tokyo
Mexico City
Seoul, South Korea
Shanghai, China
Migration The large-scale migration of people from one location to another also alters the distribution of population Reasons for migrating are referred to as: Push-Pull Factors
 
Immigration Immigration- the movement of people from one nation-state to another Immigration implies long-term permanent residence by the immigrants Tourists are not considered immigrants All of our ancestors immigrated to America from a foreign country
 
Source: U.S. Census Bureau, 1990 decennial census. In 1990, Almost Half of All U.S. Counties Had Less Than 1% Foreign-Born, and Only One-Tenth Had 5% or More.
Source: U.S. Census Bureau, 2000 decennial census. By 2000, Only One-Fourth of U.S. Counties Had Less Than 1% Foreign-Born, and One in Five Had 5% or More.
Push Factors Push Factors-  those that cause people to leave their homeland & migrate or immigrate to another region or country Drought Natural Disasters Political – war, persecution Religious Reasons Economic Opportunity
Irish Potato Famine (1845-1849)
Natural Disasters
Hurricane Katrina Migration
Religious Persecution
 
Pull Factors Pull factors draw or attract people to another location Why would someone from Harlan, IA be “pulled” to Chicago or Kansas City? Why were our ancestors “pulled” to America? Countries with good economic opportunities & high salaries are the likely destinations of migrants & immigrants  Favorable Climate is another pull factor. “ Snow Birds”
 
 
GDP List the countries that you think have the top five GDP. GeoHive : GDP - Top 50 for 2004 & 2005 List actual
GDP—Per Capita Income List what you think the highest and lowest per capita income is in the world.  What do you think the per capita income is in the US? GeoHive
Imports/Exports Which countries have the most exports? GeoHive Which countries have the most imports? GeoHive Why is it important to have a trade balance? How does the US fair?
Internet and Computer Users GeoHive   --Computer users GeoHive   --Internet Users What does this info tell us?
Oil Reserves, Production and Consumption GeoHive  –Oil reserves GeoHive  –Oil production GeoHive  –Oil consumption
Energy Consumption GeoHive What conclusions can be made from the last two slides?
Millennium Development Goals
United Nations Millennium Development Goals Passed in 2000, the eight Millennium Development Goals form a blueprint agreed to by all the world’s countries and all the world’s leading development institutions  The target year to achieve these goals is 2015                                                
Goal #1: Eliminate Extreme Hunger and Poverty Reduce by half the proportion of people living on less than a dollar a day Reduce by half the proportion of people who suffer from hunger
% Living on less than $1/ Day
% of People Living in Poverty
 
Goal #2: Achieve Universal Primary Education Ensure that all boys and girls complete a full course of primary schooling
Goal #3: Promote Gender Equality and Empower Women Eliminate gender disparity in primary and secondary education preferably by 2005, and at all levels by 2015
Goal #4: Reduce Child Mortality Reduce by two thirds the mortality rate among children under five
Goal #5: Improve Maternal Health Reduce by three quarters the maternal mortality ratio
Goal #6: Combat HIV/AIDS, Malaria and Other Diseases Halt and begin to reverse the spread of HIV/AIDS Halt and begin to reverse the incidence of malaria and other major diseases
Goal #7: Ensure Environmental Sustainability Integrate the principles of sustainable development into country policies and programs; reverse loss of environmental resources  Reduce by half the proportion of people without sustainable access to safe drinking water Achieve significant improvement in lives of at least 100 million slum dwellers, by 2020
Goal #8: Develop a Global Partnership for Development Develop further an open trading and financial system that is rule-based, predictable and non-discriminatory, includes a commitment to good governance, development and poverty reduction— nationally and internationally Address the least developed countries' special needs. This includes tariff- and quota-free access for their exports; enhanced debt relief for heavily indebted poor countries; cancellation of official bilateral debt; and more generous official development assistance for countries committed to poverty reduction Address the special needs of landlocked and small island developing States
Deal comprehensively with developing countries' debt problems through national and international measures to make debt sustainable in the long term In cooperation with the developing countries, develop decent and productive work for youth In cooperation with pharmaceutical companies, provide access to affordable essential drugs in developing countries In cooperation with the private sector, make available the benefits of new technologies— especially information and communications technologies
Now that you have seen the eight goals, how are these goals coming along six years later(2006)? Using the MDG Goals Report-2006, discuss how the goals are being met or how they aren’t. http://unstats.un.org/unsd/mdg/Resources/Static/Products/Progress2006/MDGReport2006.pdf
1.
1
2
2
2
3
3
4
4
4
4
5
6
1997-2004* Physicians per 1,000 people Availability of Doctors, Selected Countries * Data are for the most recent year available for each country. Source: World Bank,  World Development Indicators 2006 .
6
6
6
7
7
7
7
7
7
7
8
8
8
8
8
Population Control

Population

  • 1.
  • 2.
    What is Population?The collection of people living in a given geographic area, or space, usually measured by a census Demography The study of human populations Various aspects of human behavior in populations are studied in Sociology, Economics, and Geography The study of populations is almost always governed by the laws of probability www.census.gov/main/www/popclock.html
  • 3.
  • 4.
    World and PopulationStatistics World Population: 6.5 Billion-2006 World Population Information
  • 5.
    World Population Clock2005 Source: Population Reference Bureau, 2005 World Population Data Sheet . 137 151 2 154 Minute 197,004 217,971 3,383 221,354 Day 71,906,587 79,559,311 1,234,907 80,794,218 Year Less Developed Countries (less China) Less Developed Countries More Developed Countries World Natural Increase per
  • 6.
    World Vital EventsPer Time Unit: 2006 Births Deaths Natural Increase Year 132,434,587 55,220,152 77,214,435 Month 11,036,216 4,601,679 6,434,536 Day 362,834 151,288 211,546 Hour 15,118 6,304 8,814 Minute 252 105 147 Second 4.2 1.8 2.4
  • 7.
    Worldwide Population GrowthEarth’s population hit 1 Billion in the early 1800’s As the world industrialized, people grew more and better food Also, people improved their sanitation methods This combination enabled the population to boom
  • 8.
    World Population Growth,in Billions Number of years to add each billion (year) All of Human History (1800) 130 (1930) 30 (1960) 15 (1975) 12 (1987) 12 (1999) 14 (2013) 14 (2027) 21 (2048) Sources: First and second billion: Population Reference Bureau. Third through ninth billion: United Nations, World Population Prospects: The 2004 Revision (medium scenario), 2005.
  • 9.
  • 10.
    World Population GrowthThrough History A.D. 2000 A.D. 1000 A.D. 1 1000 B.C. 2000 B.C. 3000 B.C. 4000 B.C. 5000 B.C. 6000 B.C. 7000 B.C. 1+ million years 8 7 6 5 2 1 4 3 Old Stone Age New Stone Age Bronze Age Iron Age Middle Ages Modern Age Black Death — The Plague 9 10 11 12 A.D. 3000 A.D. 4000 A.D. 5000 1800 1900 1950 1975 2000 2100 Future Billions Source: Population Reference Bureau; and United Nations, World Population Projections to 2100 (1998).
  • 11.
    Population Growth Whatarea of the world do you think has the highest rate and lowest rate of population growth from 2000-2005? GeoHive List actual
  • 12.
  • 13.
    Projected Population Change,by Country Source: Population Reference Bureau, 2005 World Population Data Sheet . Percent Population Change, 2005-2050
  • 14.
    Source: United Nations, World Population Prospects: The 2004 Revision (2005). World population, 1950-2050 (projected) Global Population Growth: A Developing-Country Phenomenon
  • 15.
  • 16.
  • 17.
    Trends in PopulationGrowth Worldwide Population Increase and Growth Rate, Five-Year Periods Millions Percent increase per year Source: United Nations, World Population Prospects: The 2004 Revision (medium scenario), 2005.
  • 18.
    Notes on Trendsin Population Growth Worldwide Over the period 1985-1995, the population growth rate declined (a reflection of declining fertility), yet millions of people were added to the world’s population (which peaked around 1985, when 87 million people were added each year). From 2000 on, the growth rate will continue to decline. Between 2015 and 2020, we will still be adding 72 million people each year. Why? Because the generation of women now having their children is very large as the result of high fertility in their mothers’ and grandmothers’ generations.
  • 19.
    Birth Rates Birthrate-the number of live births per 1,000 population In 2000, the highest birthrate in the world was more than 54/1000 in Niger Lowest = 8/1000 in Latvia World Average = 22/1000
  • 20.
  • 21.
  • 22.
    Birth and DeathRates, Worldwide Rates of birth, death, and natural increase per 1,000 population Natural Increase Source: United Nations, World Population Prospects: The 2004 Revision , 2005.
  • 23.
    Fertility Rate Showsthe average number of children a woman of childbearing years would have in her lifetime A fertility rate of 2.1 is necessary just to replace current population Today, the worldwide average fertility rate is about 2.59
  • 24.
    Fertility Rates Whatdo you think the average number of babies each woman has in the world? US? What do you think the highest average is? Where? CIA - The World Factbook - Guide to Country Profiles
  • 25.
  • 26.
    10 Places Withthe Lowest Total Fertility Worldwide Average number of children per woman, 2000-2005 Source: United Nations, World Population Prospects: The 2004 Revision , 2005.
  • 27.
    Women of ChildbearingAge Number of Women 15 to 49 Billions Source: United Nations, World Population Prospects: The 2004 Revision (medium scenario), 2005.
  • 28.
    Women of ChildbearingAge and Fertility Worldwide Source: United Nations, World Population Prospects: The 2004 Revision (medium scenario), 2005.
  • 29.
    Diverging Trends inFertility Reduction Average number of children per woman Source: United Nations, World Population Prospects: The 2004 Revision , 2005.
  • 30.
    Questions to ConsiderWhy is the world’s population increasing but the growth rate is decreasing? Why is the world’s population growing so quickly? What problems/implications does this growth bring about?
  • 31.
    Mortality Rate Alsocalled the death rate Number of deaths per 1,000 people Generally, a society is considered healthy if it has a low mortality rate However, some healthy nations have higher mortality rates because they have large numbers of elderly people
  • 32.
    Birth and DeathRates, Worldwide Rates of birth, death, and natural increase per 1,000 population Natural Increase Source: United Nations, World Population Prospects: The 2004 Revision , 2005.
  • 33.
    Life Expectancy Howlong a person is expected to live Which countries do you think have the highest and lowest life expectancy at birth? GeoHive List actual
  • 34.
    Trends in LifeExpectancy, by Region Life Expectancy at Birth, in Years Source: United Nations, World Population Prospects: The 2004 Revision (medium scenario), 2005.
  • 35.
    Infant Mortality RateFor this reason, geographers also look at infant mortality rates Infant Mortality Rate Shows the number of deaths among infants under age 1 per 1,000 live births In the 1800’s, the worldwide I.M.R. was 300/1,000
  • 36.
  • 37.
    Rate of NaturalIncrease Birthrate – Death Rate B-D = R A.K.A. = Population Growth Rate
  • 38.
    Birth and DeathRates, Worldwide Rates of birth, death, and natural increase per 1,000 population Natural Increase Source: United Nations, World Population Prospects: The 2004 Revision , 2005.
  • 39.
  • 40.
    Population Pyramid Anotherway to analyze populations is to use a population pyramid PP = a graphic device that shows sex & age distribution of a population Allows geographers to examine how events in society, such as wars, famine, or epidemics, affect the population of a country or region
  • 41.
    Age Distribution ofthe World’s Population Population Structures by Age and Sex, 2005 Millions Less Developed Regions More Developed Regions Male Female Male Female 80+ 75-79 70-74 65-69 60-64 55-59 50-54 45-49 40-44 35-39 30-34 25-29 20-24 15-19 10-14 5-9 0-4 Age Source: United Nations, World Population Prospects: The 2004 Revision , 2005.
  • 42.
  • 43.
  • 44.
  • 45.
  • 46.
    Population Density Theaverage number of people who live in a measurable area, such as a square mile The number is reached by dividing the number of inhabitants in an area by the total amount of land they occupy Geographers use this to understand how heavily populated an area is Which countries do you think are the most densely populated? GeoHive List actual
  • 47.
  • 48.
  • 49.
    Population Density Thisnumber can be misleading for an entire nation Why? Example: U.S. P.D.  1990 Alaska = huge land area, small population 1 person per square mile New Jersey = small land area, large population 1,098 people per square mile Total U.S. Population Density = 70.3 people per square mile
  • 50.
    Carrying Capacity Thenumber of individuals an environment can support without significant negative impacts A region with fertile land may be able to support far more people than one with land of poor quality or with little land available for cultivation Technology Level of technology of a group living on the land may affect carrying capacity
  • 51.
  • 52.
  • 53.
    Land Area Writewhat you think the five largest countries(land area) are. GeoHive List actual
  • 54.
  • 55.
    Population Distribution Ofthe billions of people in the world, most are not distributed equally across the earth Some lands are not suitable for human habitation Examples? Almost 90% of the world’s population lives in the Northern Hemisphere N.H.- ½ of the planets surface, which is north of the equator
  • 56.
  • 57.
    Population Distribution 1in 4 people in the world live in East Asia, and 1 in 2 people live in either East Asia or South Asia Factors: Climate Altitude Access to water All influence where people live
  • 58.
    Urban-Rural Mix Currently,more than ½ of the world’s population lives in rural areas However, this number is changing rapidly More and more people are migrating to cities Particularly, cities with populations of more than one million people
  • 59.
    Trends in Urbanization,by Region Urban Population Percent Source: United Nations, World Urbanization Prospects: The 2003 Revision (medium scenario), 2004.
  • 60.
  • 61.
    World Population byCountry List what you think the top ten populated countries in the world were/are/will be in 1950, 2006 and 2050. GeoHive GeoHive List actual
  • 62.
    54 107,000,000       Mexico 11 337 127,000,000       Japan 10 139 131,530,000       Nigeria 9 8 142,800,000       Russia 8 1,002 145,000,000       Bangladesh 7 202 164,000,000       Pakistan 6 21 186,405,000       Brazil 5 126 222,781,000       Indonesia 4 30 300,000,000       United States 3 328 1,110,000,000       India 2 136 1,315,844,000       China 1 43 6,661,208,350 World — Density (people/ km²) Population Country Rank
  • 63.
  • 64.
    Population development ofthe largest countries from 1950 to 2050
  • 65.
  • 66.
    Largest Metropolitan AreasList what you think the 10 largest metropolitan areas are in world. GeoHive List Actual GeoHive --2015 Projected GeoHive --1950-2015 Met. Areas
  • 67.
    Megacities In 1950,New York City was the only World City with more than 10 million residents Today, 26 giant cities are home to a total of more than 250 million people The largest of these is Tokyo 34 million inhabitants These huge cities struggle with overcrowded conditions and immense demand for water & sanitation
  • 68.
  • 69.
  • 70.
                                                                                                                                                                                                    
  • 71.
    Largest Cities Listwhat you think the 10 largest cities are in world. GeoHive List actial
  • 72.
    April 2007 Updatehttp://www.census.gov/Press-Release/www/releases/archives/population/009865.html http://www.cnn.com/2007/US/04/05/metro.population.ap/index.html
  • 73.
  • 74.
  • 75.
  • 76.
  • 77.
  • 78.
  • 79.
    Migration The large-scalemigration of people from one location to another also alters the distribution of population Reasons for migrating are referred to as: Push-Pull Factors
  • 80.
  • 81.
    Immigration Immigration- themovement of people from one nation-state to another Immigration implies long-term permanent residence by the immigrants Tourists are not considered immigrants All of our ancestors immigrated to America from a foreign country
  • 82.
  • 83.
    Source: U.S. CensusBureau, 1990 decennial census. In 1990, Almost Half of All U.S. Counties Had Less Than 1% Foreign-Born, and Only One-Tenth Had 5% or More.
  • 84.
    Source: U.S. CensusBureau, 2000 decennial census. By 2000, Only One-Fourth of U.S. Counties Had Less Than 1% Foreign-Born, and One in Five Had 5% or More.
  • 85.
    Push Factors PushFactors- those that cause people to leave their homeland & migrate or immigrate to another region or country Drought Natural Disasters Political – war, persecution Religious Reasons Economic Opportunity
  • 86.
  • 87.
  • 88.
  • 89.
  • 90.
  • 91.
    Pull Factors Pullfactors draw or attract people to another location Why would someone from Harlan, IA be “pulled” to Chicago or Kansas City? Why were our ancestors “pulled” to America? Countries with good economic opportunities & high salaries are the likely destinations of migrants & immigrants Favorable Climate is another pull factor. “ Snow Birds”
  • 92.
  • 93.
  • 94.
    GDP List thecountries that you think have the top five GDP. GeoHive : GDP - Top 50 for 2004 & 2005 List actual
  • 95.
    GDP—Per Capita IncomeList what you think the highest and lowest per capita income is in the world. What do you think the per capita income is in the US? GeoHive
  • 96.
    Imports/Exports Which countrieshave the most exports? GeoHive Which countries have the most imports? GeoHive Why is it important to have a trade balance? How does the US fair?
  • 97.
    Internet and ComputerUsers GeoHive --Computer users GeoHive --Internet Users What does this info tell us?
  • 98.
    Oil Reserves, Productionand Consumption GeoHive –Oil reserves GeoHive –Oil production GeoHive –Oil consumption
  • 99.
    Energy Consumption GeoHiveWhat conclusions can be made from the last two slides?
  • 100.
  • 101.
    United Nations MillenniumDevelopment Goals Passed in 2000, the eight Millennium Development Goals form a blueprint agreed to by all the world’s countries and all the world’s leading development institutions The target year to achieve these goals is 2015                                             
  • 102.
    Goal #1: EliminateExtreme Hunger and Poverty Reduce by half the proportion of people living on less than a dollar a day Reduce by half the proportion of people who suffer from hunger
  • 103.
    % Living onless than $1/ Day
  • 104.
    % of PeopleLiving in Poverty
  • 105.
  • 106.
    Goal #2: AchieveUniversal Primary Education Ensure that all boys and girls complete a full course of primary schooling
  • 107.
    Goal #3: PromoteGender Equality and Empower Women Eliminate gender disparity in primary and secondary education preferably by 2005, and at all levels by 2015
  • 108.
    Goal #4: ReduceChild Mortality Reduce by two thirds the mortality rate among children under five
  • 109.
    Goal #5: ImproveMaternal Health Reduce by three quarters the maternal mortality ratio
  • 110.
    Goal #6: CombatHIV/AIDS, Malaria and Other Diseases Halt and begin to reverse the spread of HIV/AIDS Halt and begin to reverse the incidence of malaria and other major diseases
  • 111.
    Goal #7: EnsureEnvironmental Sustainability Integrate the principles of sustainable development into country policies and programs; reverse loss of environmental resources Reduce by half the proportion of people without sustainable access to safe drinking water Achieve significant improvement in lives of at least 100 million slum dwellers, by 2020
  • 112.
    Goal #8: Developa Global Partnership for Development Develop further an open trading and financial system that is rule-based, predictable and non-discriminatory, includes a commitment to good governance, development and poverty reduction— nationally and internationally Address the least developed countries' special needs. This includes tariff- and quota-free access for their exports; enhanced debt relief for heavily indebted poor countries; cancellation of official bilateral debt; and more generous official development assistance for countries committed to poverty reduction Address the special needs of landlocked and small island developing States
  • 113.
    Deal comprehensively withdeveloping countries' debt problems through national and international measures to make debt sustainable in the long term In cooperation with the developing countries, develop decent and productive work for youth In cooperation with pharmaceutical companies, provide access to affordable essential drugs in developing countries In cooperation with the private sector, make available the benefits of new technologies— especially information and communications technologies
  • 114.
    Now that youhave seen the eight goals, how are these goals coming along six years later(2006)? Using the MDG Goals Report-2006, discuss how the goals are being met or how they aren’t. http://unstats.un.org/unsd/mdg/Resources/Static/Products/Progress2006/MDGReport2006.pdf
  • 115.
  • 116.
  • 117.
  • 118.
  • 119.
  • 120.
  • 121.
  • 122.
  • 123.
  • 124.
  • 125.
  • 126.
  • 127.
  • 128.
    1997-2004* Physicians per1,000 people Availability of Doctors, Selected Countries * Data are for the most recent year available for each country. Source: World Bank, World Development Indicators 2006 .
  • 129.
  • 130.
  • 131.
  • 132.
  • 133.
  • 134.
  • 135.
  • 136.
  • 137.
  • 138.
  • 139.
  • 140.
  • 141.
  • 142.
  • 143.
  • 144.