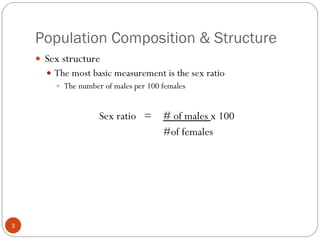
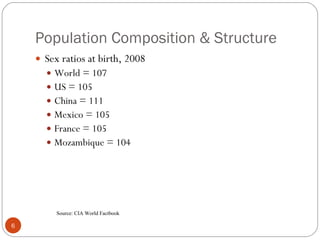
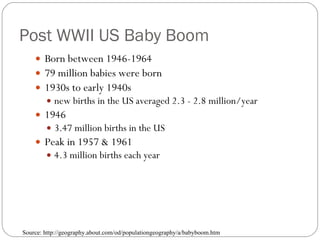
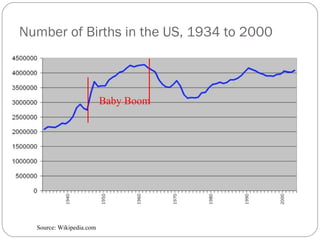
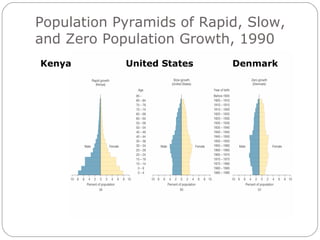
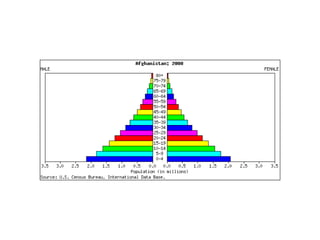
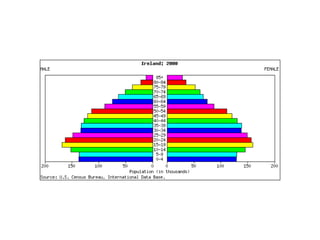
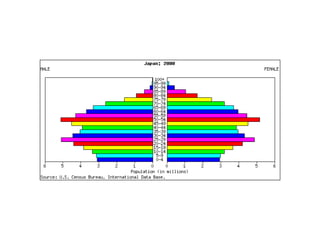
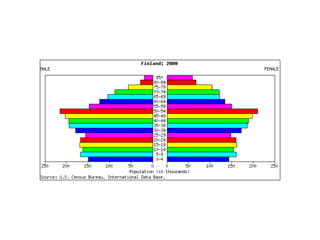
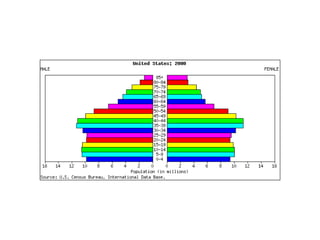
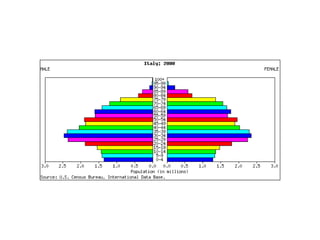
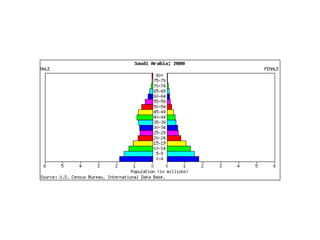
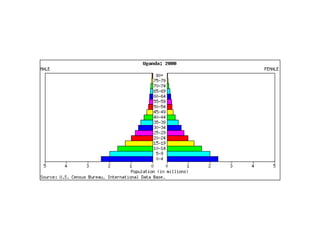
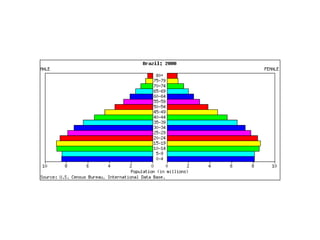
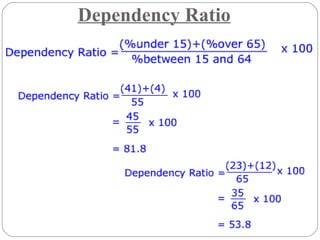
Population Composition & Structure
Population Composition & Structure The most basic elements of population composition are Sex structure Age structure
Population Composition & Structure Sex structure The most basic measurement is the sex ratio The number of males per 100 females Sex ratio  = # of males  x 100 #of females
Population Composition & Structure If  Sex ratio > 100, there are more males than females Sex ratio < 100, there are more females than males Sex ratio = 100, there are equal #s of both sexes
Population Composition & Structure Important factors that affect the sex ratio are: The differences in death rates between males and females The differences in net migration by gender The sex ratio of newborn infants
Population Composition & Structure Sex ratios at birth, 2008 World = 107 US = 105 China = 111 Mexico = 105 France = 105 Mozambique = 104 Source: CIA World Factbook
Population Composition & Structure Sex ratios change as age progresses Migration is a very significant factor
Population Composition & Structure Figures in the text, pp. 56-59 “ Frontier” Early factor Immigration magnets More recent
Sex Ratios by County, 2000
Population Composition & Structure Age Structure Affects economic and social behavior Primary determinant Birth rate Analysis of age structure Population pyramids
Population Composition & Structure Population pyramids 5 year age groups or cohorts A cohort is a group of people who share a  temporal  (time) experience Youth  Middle aged Old aged Baby Boomers Gen Xers Baby Boomerangs
Post WWII US Baby Boom Born between 1946-1964 79 million babies were born  1930s to early 1940s new births in the US averaged 2.3 - 2.8 million/year 1946 3.47 million births in the US Peak in 1957 & 1961 4.3 million births each year Source: http://geography.about.com/od/populationgeography/a/babyboom.htm
Number of Births in the US, 1934 to 2000 Source: Wikipedia.com Baby Boom
Population Pyramids of Rapid, Slow, and Zero Population Growth, 1990 Denmark United States Kenya


Population Composition & Structure Analysis of population structure is important because Future patterns of population growth Amongst which age cohorts Structure of dependent population relative to the working age/productive population Dependency ratio
Dependency Ratio Ratio of the dependent-age population (the young and the old) to the working age population The purpose of the dependency ratio is to measure the # of dependents that each 100 people in the productive years must support
Dependency Ratio

Population Composition & Structure

  • 1.
  • 2.
    Population Composition &Structure The most basic elements of population composition are Sex structure Age structure
  • 3.
    Population Composition &Structure Sex structure The most basic measurement is the sex ratio The number of males per 100 females Sex ratio = # of males x 100 #of females
  • 4.
    Population Composition &Structure If Sex ratio > 100, there are more males than females Sex ratio < 100, there are more females than males Sex ratio = 100, there are equal #s of both sexes
  • 5.
    Population Composition &Structure Important factors that affect the sex ratio are: The differences in death rates between males and females The differences in net migration by gender The sex ratio of newborn infants
  • 6.
    Population Composition &Structure Sex ratios at birth, 2008 World = 107 US = 105 China = 111 Mexico = 105 France = 105 Mozambique = 104 Source: CIA World Factbook
  • 7.
    Population Composition &Structure Sex ratios change as age progresses Migration is a very significant factor
  • 8.
    Population Composition &Structure Figures in the text, pp. 56-59 “ Frontier” Early factor Immigration magnets More recent
  • 9.
    Sex Ratios byCounty, 2000
  • 10.
    Population Composition &Structure Age Structure Affects economic and social behavior Primary determinant Birth rate Analysis of age structure Population pyramids
  • 11.
    Population Composition &Structure Population pyramids 5 year age groups or cohorts A cohort is a group of people who share a temporal (time) experience Youth Middle aged Old aged Baby Boomers Gen Xers Baby Boomerangs
  • 12.
    Post WWII USBaby Boom Born between 1946-1964 79 million babies were born 1930s to early 1940s new births in the US averaged 2.3 - 2.8 million/year 1946 3.47 million births in the US Peak in 1957 & 1961 4.3 million births each year Source: http://geography.about.com/od/populationgeography/a/babyboom.htm
  • 13.
    Number of Birthsin the US, 1934 to 2000 Source: Wikipedia.com Baby Boom
  • 14.
    Population Pyramids ofRapid, Slow, and Zero Population Growth, 1990 Denmark United States Kenya
  • 15.
  • 16.
  • 17.
  • 18.
  • 19.
  • 20.
  • 21.
  • 22.
  • 23.
  • 24.
    Population Composition &Structure Analysis of population structure is important because Future patterns of population growth Amongst which age cohorts Structure of dependent population relative to the working age/productive population Dependency ratio
  • 25.
    Dependency Ratio Ratioof the dependent-age population (the young and the old) to the working age population The purpose of the dependency ratio is to measure the # of dependents that each 100 people in the productive years must support
  • 26.