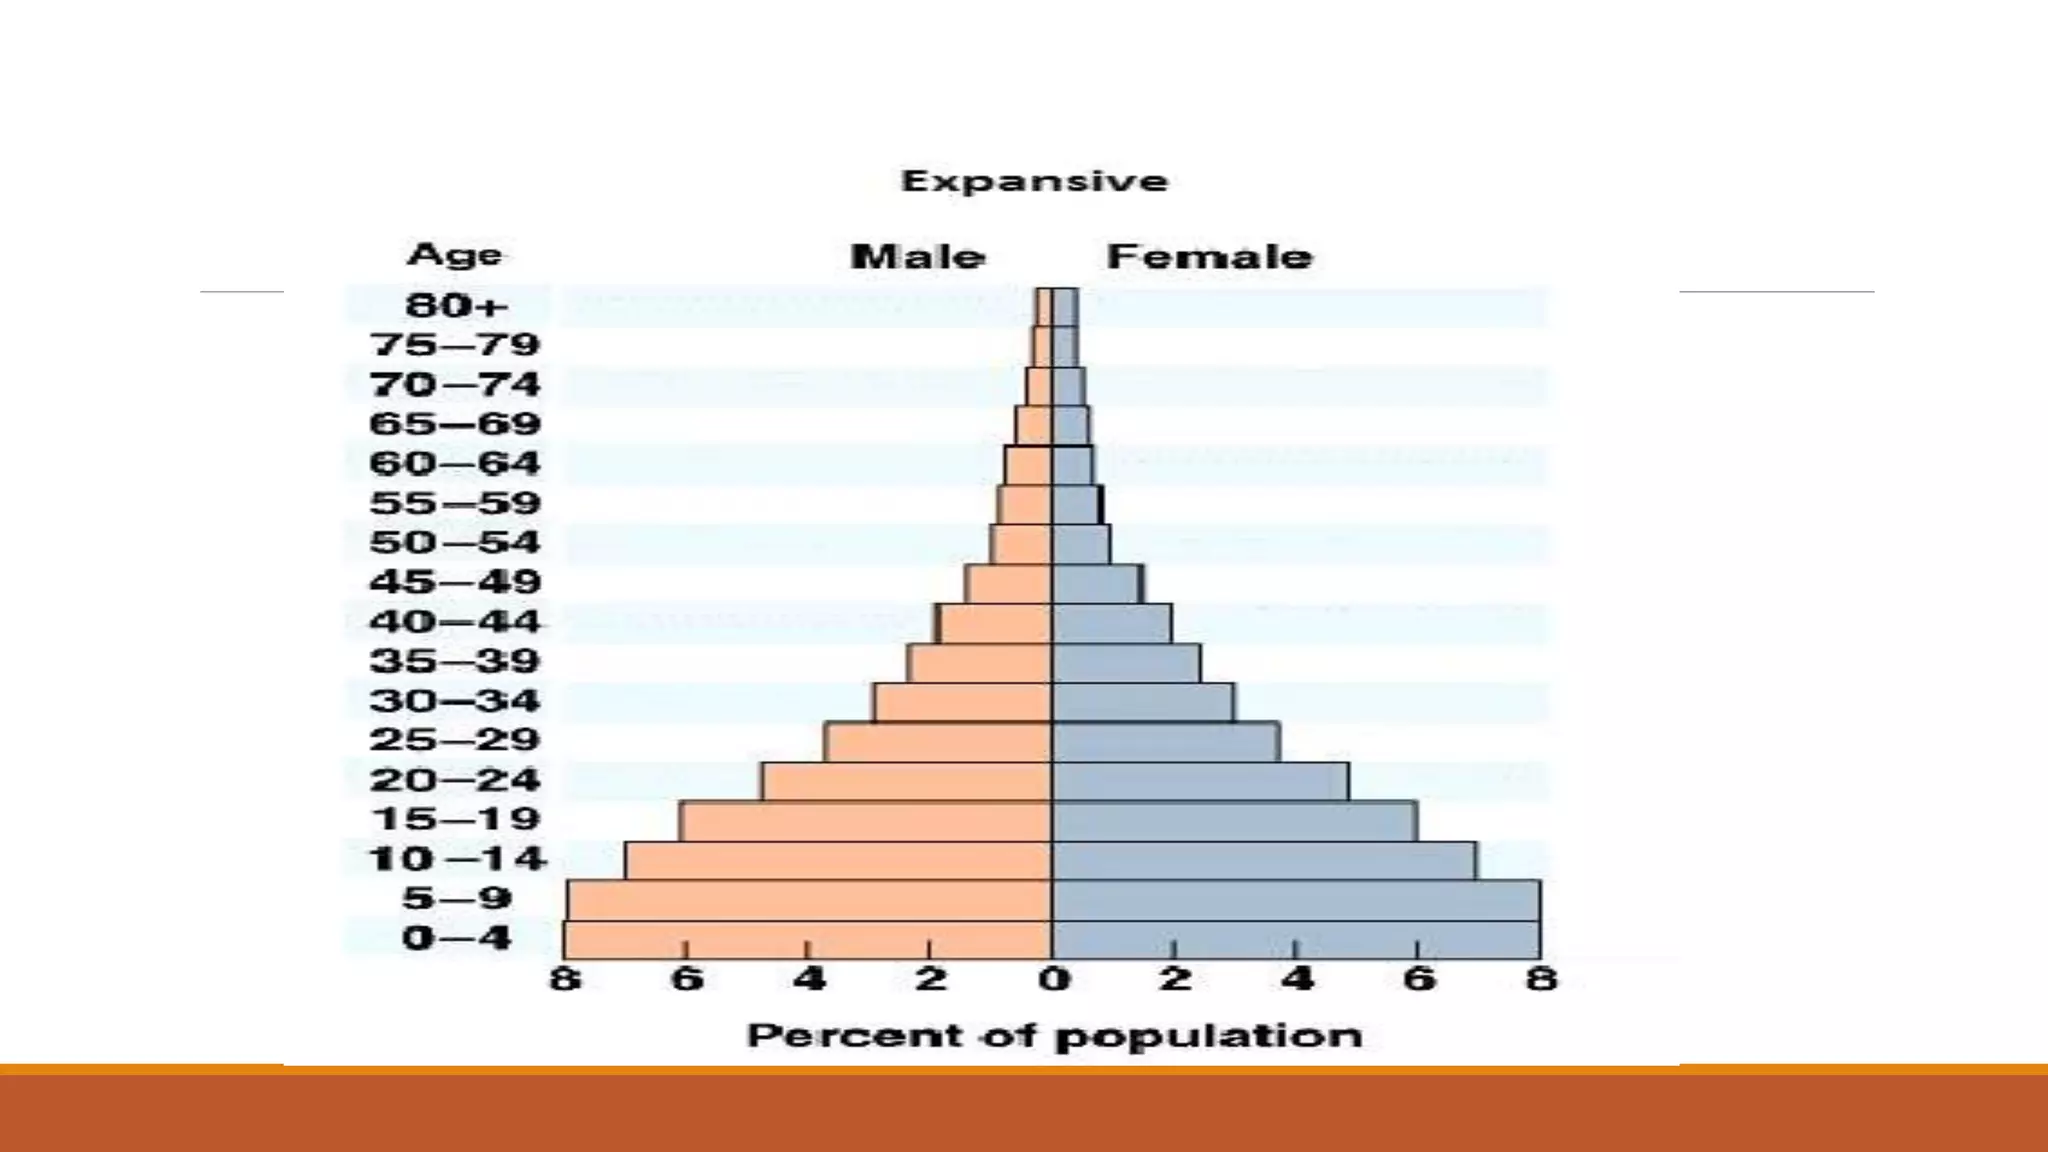
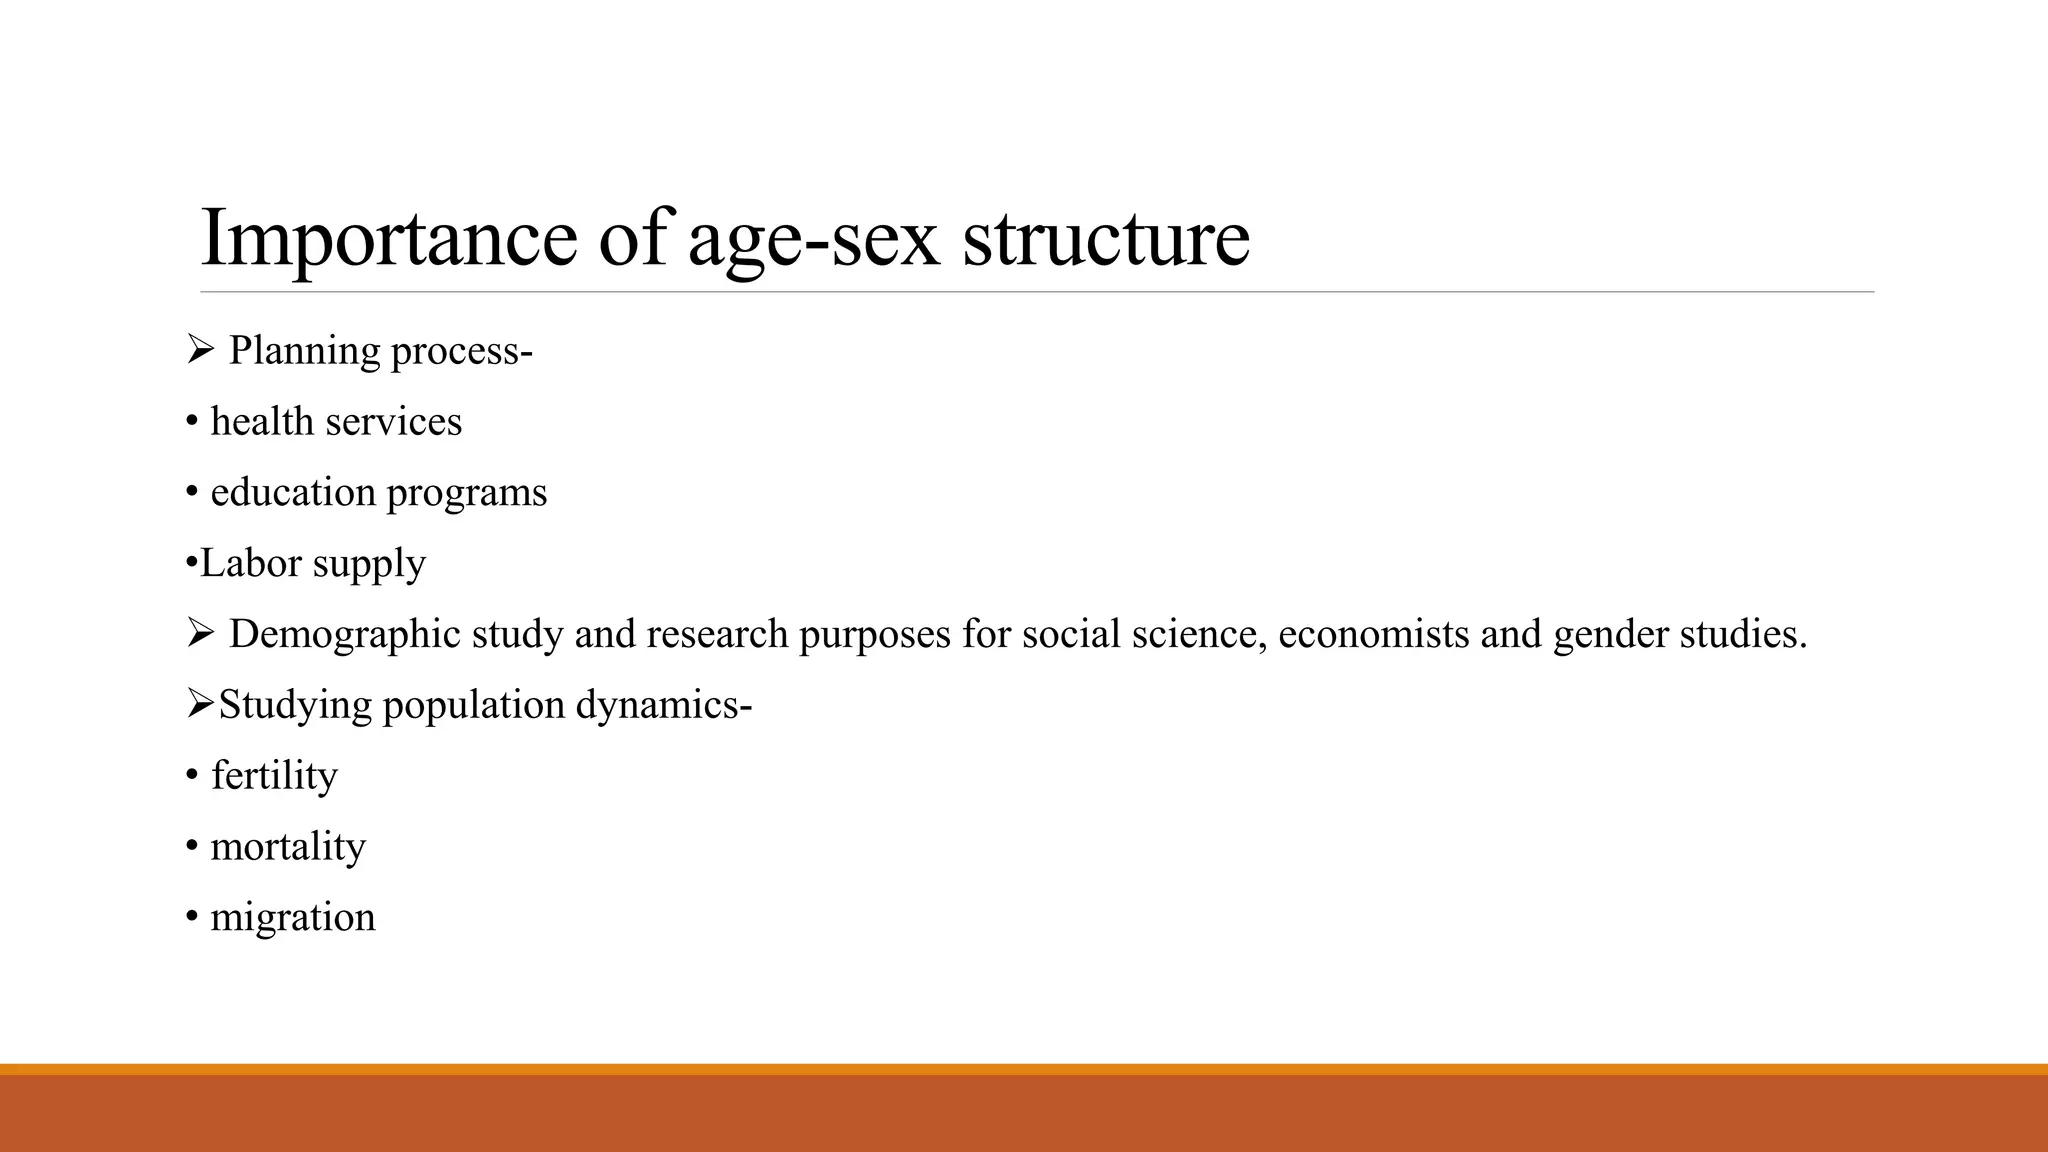
this presentation will give a basic knowledge about age and sex structure, population pyramid with different countries age-sex structure along with Bangladesh perspective.
TERMS OF DEMOGRAPHIC DATA SOURCES
Demography : study of statistical description and analysis of human population.
Population : summation of all the organism of the same group in a particular geographical area.
Population census : a complete population count at a point in time within a particular area.
Vital registration : registration on live Births, Deaths, Fetal deaths, Marriages, and Divorces.
Sample Survey: representative portion of the population .
DEMOGRAPHIC DATA
Demographic data is the study of the population its static and dynamic aspects.
Static aspect (age, sex, race etc.)
Dynamic aspect (fertility, morality, migration)
This theory throws light on changes in birth and death rate and consequently on the growth rate of population. The relationship between birth and death rate changes with economic development and a country has to pass through different stages of population growth. This theory depicts the four stages of demographic transition that a country has to pass.
A Brief Discussion on demographic transition theory.Rizwan Khan
Demographic transition (DT) refers to the transition from high birth and death rates to lower birth and death rates as a country or region develops from a pre-industrial to an industrialized economic system.
IT IS GIVEN BY: FrankW. Notestein. Frank Wallace Notestein (August 16, 1902 – February 19, 1983)
The demographic transition theory is a generalized description of the changing pattern of mortality, fertility and growth rates as societies move from one demographic regime to another.
Population Studies / Demography IntroductionMuteeullah
Presentation and Assignment on Population / Demography including mortality, fertility and their measure, population census, vital registration, demography survey, House hold survey, population composition, errors in demographic data, demographic measures.................By Muteeullah Channa University of Sindh
Md.Likujjaman Like
Department of Geography and Environmental Science
Begum Rokeya University, Rangpur
Introduction Population data
Meaning of Population data Information of Population data Sources of Population data Example of Population data Population Census Definition of Population Census Process of Population Census Conditions of Population Census
Types of Population Census Legal information of Population Census Advantage and Disadvantages of Population Census
Sample Survey
Definition of Sample Survey Types of Sample Survey Advantage and Disadvantages of Sample Survey
Vital Registration System
Definition
Vital Elements History of Vital Registration System
International Migration
Meaning Causes of International Migration Sources of International Migration
Other Sources of Population data in Bangladesh
National Sources
International Sources
Conclusion
Reference
Created By:
Md.Likujjaman Like
Session: 2015 - 16
Department of Geography and Environmental Science
Begum Rokeya University, Rangpur
It described, how do we measure development. Various development indicators. HDI, GDP, GNP etc. Where India stands in HDI. the comparison among developed nations and among SAARC nations.
These comprehensive slides on demography provide a deep understanding of the science of population dynamics. Covering essential concepts, methodologies, and key demographic indicators, these notes offer insights into the study of population growth, distribution, and composition. Explore topics such as fertility, mortality, migration, and population projections, as well as their implications for society and policy. With this resource, you'll gain a strong foundation in demography, making it an invaluable reference for students, researchers, and anyone interested in the dynamics of human populations.
How to Make a Field invisible in Odoo 17Celine George
It is possible to hide or invisible some fields in odoo. Commonly using “invisible” attribute in the field definition to invisible the fields. This slide will show how to make a field invisible in odoo 17.
Synthetic Fiber Construction in lab .pptxPavel ( NSTU)
Synthetic fiber production is a fascinating and complex field that blends chemistry, engineering, and environmental science. By understanding these aspects, students can gain a comprehensive view of synthetic fiber production, its impact on society and the environment, and the potential for future innovations. Synthetic fibers play a crucial role in modern society, impacting various aspects of daily life, industry, and the environment. ynthetic fibers are integral to modern life, offering a range of benefits from cost-effectiveness and versatility to innovative applications and performance characteristics. While they pose environmental challenges, ongoing research and development aim to create more sustainable and eco-friendly alternatives. Understanding the importance of synthetic fibers helps in appreciating their role in the economy, industry, and daily life, while also emphasizing the need for sustainable practices and innovation.
Unit 8 - Information and Communication Technology (Paper I).pdfThiyagu K
This slides describes the basic concepts of ICT, basics of Email, Emerging Technology and Digital Initiatives in Education. This presentations aligns with the UGC Paper I syllabus.
The Art Pastor's Guide to Sabbath | Steve ThomasonSteve Thomason
What is the purpose of the Sabbath Law in the Torah. It is interesting to compare how the context of the law shifts from Exodus to Deuteronomy. Who gets to rest, and why?
The Roman Empire A Historical Colossus.pdfkaushalkr1407
The Roman Empire, a vast and enduring power, stands as one of history's most remarkable civilizations, leaving an indelible imprint on the world. It emerged from the Roman Republic, transitioning into an imperial powerhouse under the leadership of Augustus Caesar in 27 BCE. This transformation marked the beginning of an era defined by unprecedented territorial expansion, architectural marvels, and profound cultural influence.
The empire's roots lie in the city of Rome, founded, according to legend, by Romulus in 753 BCE. Over centuries, Rome evolved from a small settlement to a formidable republic, characterized by a complex political system with elected officials and checks on power. However, internal strife, class conflicts, and military ambitions paved the way for the end of the Republic. Julius Caesar’s dictatorship and subsequent assassination in 44 BCE created a power vacuum, leading to a civil war. Octavian, later Augustus, emerged victorious, heralding the Roman Empire’s birth.
Under Augustus, the empire experienced the Pax Romana, a 200-year period of relative peace and stability. Augustus reformed the military, established efficient administrative systems, and initiated grand construction projects. The empire's borders expanded, encompassing territories from Britain to Egypt and from Spain to the Euphrates. Roman legions, renowned for their discipline and engineering prowess, secured and maintained these vast territories, building roads, fortifications, and cities that facilitated control and integration.
The Roman Empire’s society was hierarchical, with a rigid class system. At the top were the patricians, wealthy elites who held significant political power. Below them were the plebeians, free citizens with limited political influence, and the vast numbers of slaves who formed the backbone of the economy. The family unit was central, governed by the paterfamilias, the male head who held absolute authority.
Culturally, the Romans were eclectic, absorbing and adapting elements from the civilizations they encountered, particularly the Greeks. Roman art, literature, and philosophy reflected this synthesis, creating a rich cultural tapestry. Latin, the Roman language, became the lingua franca of the Western world, influencing numerous modern languages.
Roman architecture and engineering achievements were monumental. They perfected the arch, vault, and dome, constructing enduring structures like the Colosseum, Pantheon, and aqueducts. These engineering marvels not only showcased Roman ingenuity but also served practical purposes, from public entertainment to water supply.
The French Revolution, which began in 1789, was a period of radical social and political upheaval in France. It marked the decline of absolute monarchies, the rise of secular and democratic republics, and the eventual rise of Napoleon Bonaparte. This revolutionary period is crucial in understanding the transition from feudalism to modernity in Europe.
For more information, visit-www.vavaclasses.com
Ethnobotany and Ethnopharmacology:
Ethnobotany in herbal drug evaluation,
Impact of Ethnobotany in traditional medicine,
New development in herbals,
Bio-prospecting tools for drug discovery,
Role of Ethnopharmacology in drug evaluation,
Reverse Pharmacology.
Students, digital devices and success - Andreas Schleicher - 27 May 2024..pptxEduSkills OECD
Andreas Schleicher presents at the OECD webinar ‘Digital devices in schools: detrimental distraction or secret to success?’ on 27 May 2024. The presentation was based on findings from PISA 2022 results and the webinar helped launch the PISA in Focus ‘Managing screen time: How to protect and equip students against distraction’ https://www.oecd-ilibrary.org/education/managing-screen-time_7c225af4-en and the OECD Education Policy Perspective ‘Students, digital devices and success’ can be found here - https://oe.cd/il/5yV
Welcome to TechSoup New Member Orientation and Q&A (May 2024).pdfTechSoup
In this webinar you will learn how your organization can access TechSoup's wide variety of product discount and donation programs. From hardware to software, we'll give you a tour of the tools available to help your nonprofit with productivity, collaboration, financial management, donor tracking, security, and more.
2. Course Title: Demography
Course No: Soc 3105
3rd year, 1st term
Submitted to-
Dr. Md Abdul Jabbar
Professor,
Sociology Discipline,
Khulna University
Khulna- 9208 Submitted by-
Faiza Atkia Keya
Student ID: 181646
Sociology Discipline
Khulna university
Khulna- 9208
3. Outlines
Definition of age- sex structure;
Age- sex pyramid;
Age- sex structure;
Describing age structure;
Age structure( past, present, future);
Proportion of age structure;
Population pyramid
Population pyramid of Bangladesh- 2010,
2019;
Population pyramid of Denmark, 2015;
Population pyramid of Europe, 2019;
World population pyramid, 2003;
Describing sex structure;
Determinants of sex structure;
sex ratio patterns;
World human sex ratio, 2011;
Sex ratio by countries;
Contrasts between more and less developed
countries;
Impacts of age- sex structure;
Importance of age- sex structure;
errors can occur;
Use and limitations;
Conclusion;
4. Introduction
Demography deals not only with population size and growth but also deals with population
composition.
The most important dimensions of composition are undoubtedly Age and Sex.
Society construct roles and status on the basis of age and sex more than any other
characteristics. Similarly, nations consistently include questions on age and sex in their census
questionnaires.
So, dependence on the importance of age and sex structure, many demographers give it a
special label: Population Structure.
5. Defining age and sex structures
Demographers define sex as someone's biological and physiological characteristics, as opposed
to gender. whereas, gender refers to socially constructed roles assigned by society to women and
men.
The United Nation define age as the interval of time between the date of birth and the date of
census, expressed in complete solar years.
Age and Sex structure of a population determined by the number or proportion of males and
females in each category. The age and sex structure of a population is the cumulative result of
past trends in fertility, mortality and migration.
Population Structure resulting from individual survival, dispersal, and reproduction determines
of future survival, dispersal and reproduction of individuals.
8. Describing Age structure
The age structure of a population is the distribution of people of various ages.
Demographers use some basic techniques for describing age and sex structure-
Frequency distribution
Percentage distribution
Ratios
Bar graphs
Basic graphical tools-
Graphical analysis
population pyramids
Graphical cohort analysis.
10. Age percentage: To compute the age percentage, one have to multiply the entry in each age- sex
category by one hundred, then divided by the total of population in that same age-sex category.
The formula would be-
Age dependency ratio: A convenient way to compare the relative size of any two numbers is by
constructing a ratio, dividing one number by the another. When applied to age distributions, the most
frequently used is the age dependency ratio. The formula is-
( number of people aged 0 to 14)+( number of people aged 65)
Total Dependency ratio = × 100
number of people aged 15 to 64
(population in age and sex class)× 100
population in all age classes of same sex
11. The total dependency ration can be decomposed into the child dependency ratio and the aged
dependency ratio.
number of people aged 0 to 14
Child dependency ratio = × 100
number of people aged 15 to 64
number of people aged 65 and over
Aged dependency ratio = × 100
number of people aged 15 to 64
14. Groups in population
˂ 1 year infant
0- 18 children
10- 19 adolescents
15- 24 youth
10- 24 young people
0- 14 dependent people
15-64 working age
65+ or 60+ elderly
75+ old elderly
80+ disabled elderly
15. Classification of population
Population may be classified based on the relative proportions in the young and elderly
cohorts.
Young population has 35% of its members under age 15 years.
Old population has 10% of its members over 65 years.
Problems may arise when a population exhibits both characteristics.
the median age allows for a manually exclusive classification.
16. Population pyramid
population pyramid visualize the demographic structure of a population.
The width represents the size of the population of the given age; women on the right and
men on the left.
The bottom layer represents the number of newborns and above it the numbers of olders
cohort.
Population pyramid is the basic procedure for accessing the quality of census data on
age and sex.
17. Population pyramid
Displays the size of population enumerated by each age group or cohort by sex.
The base of the pyramid mainly determined by the level of fertility in the population.
While how fast it converges to peak is determined by previous levels of mortality and fertility.
The levels of migration by age and sex also affect the shape of the pyramid.
24. Describing Sex structure
The demographers often describe the sex composition of population by comparing the number
of persons of each sex with a ratio. The sex ratio is the number of men divided by the number of
women multiplied by a constant of 100;
Men
× 100
Women
Sex ratios can be computed not only for total populations but also for classes within those
populations. Demographer frequently find it helpful to pay attention to sex composition at
different age levels.
25. Determinants of sex structure
Affected by relative pattern of-
Birth
Death
Migration
wars ( major wars also have lower sex ratios)
Son preference ( the tendency for parents to prefer male children over female children)
26. Sex ratio patterns
Shows a constant pattern for most countries.
Usually highest at birth, about 102 to 105 males per 100 females.
The probability of dying at birth is higher for male children.
The sex ratio is almost even in the early adult years and decreases further in early old age.
During old age, the ratio is at its lowest as life expectancy is on average 3- 5 years higher for
females.
Men mature slower and die earlier than women.
28. Sex ratio by countries
More males
than females
More
females
than men
Same number
of male and
female
29. Contrasts Between More- Developed and Less-
Developed countries
Age Structure:
• The less- developed regions have a higher proportion of their population under fifteen years of
age.
• In contrast, the more- developed countries generally have higher proportion of their population
aged sixty- five and over.
• In regions, such as Latin America and Caribbean, Asia, Oceania, Northern America has the
percentage under age fifteen falls in a closer range from higher to lower. Europe is the only
country with a greater proportion in the older ages than in younger ages.
30. Contrasts Between More- Developed and Less-
Developed countries
Sex Structure:
• For the less- developed regions, the population pyramid is almost symmetrical with a little
change.
• In contrast, the pyramid for the more- developed regions has a marked rightward, or female ,
lean as it rises to the older age categories.
• In both regions, men are slightly predominant in the earliest ages.
• In the higher ages, women tends to outnumber the men more and more.
• Female predominance in the older ages is a feature of more- developed countries.
34. Impact of Age-Sex Structure upon the Population
Processes
Birth, death and migration varies with age and sex. And thus, all of the crude rates affected by the
age- sex structure of the population.
Mortality: Small mortality rate during infancy declines to almost no mortality during youth,
climbs gradually through the middle years and then rises more rapidly thereafter. The general “J”
shape of age distribution of mortality is almost universal, although the lean of the shape may vary.
Everywhere sex influences mortality.
Fertility: Fertility rises rapidly in the late teens to a peak in the late twenties to early thirties,
then declines to negligible levels in the mid- forties. The advancement of fertility medical
technology and vast use may eventually play a bigger role in driving later ages child bearing.
Migration: Although the ways that age and sex influence mortality and fertility are
fundamentally biological, it may come as a surprise that age also strongly affects migration.
Universally, contemporary mobility is at its peak between the late teens and the mid thirties.
Mobility also differs by sex.
38. Importance of age-sex structure
Planning process-
• health services
• education programs
•Labor supply
Demographic study and research purposes for social science, economists and gender studies.
Studying population dynamics-
• fertility
• mortality
• migration
39. Importance of age-sex structure
Insight on quality of census enumeration.
Having a strong effect on other characteristics of a population-
• determined by fertility, mortality and migration
• follows fairly recognizable patterns
40. Errors can occur-
Two kinds of errors can occur in quality of census data, which Shryock and Siegel call-
1. Underenumeration
2. Misreporting
(Shryock,1976, p- 115)
Underenumertion: Underenumeration of an age and sex class means falling to count
somebody who would have fallen into that class. The errors arising from underenumeration are
also called coverage errors or undercounts.
Misreporting: Misreporting means counting somebody but misallocating him or her among the
age sex categories.
41. Errors can occur-
Significant clashes in age-sex structure due to extraordinary events-
o High migration
o War
o Famine
o HIV/ AIDS
o Epidemic and others.
42. Uses and limitations
The major limitation of age and sex structure is that it is not possible to derive separate
numerical estimates of the magnitude of coverage and content error on the basis of such analyses
alone.
It is often possible to assess particular types of errors which are likely to have affected the
population counts for particular segments of the population. Estimates of coverage error from
other sources often are required to verify the observations.
43. Conclusion
The age and sex structure of a population enumerated is typically the first step taken in
evaluating a data collection operation by means of demographic methods. Demographic
methods provide a quick and expensive indication of the general quality of data.
Evidence on the specific segments of the population in which the presence of error is
likely “Historical” information which may be useful for interpreting the results of
evaluation studies based on other methods, and in determining how the collected data
should be adjusted for use in demographic studies.
44. References
Bloom David, D. c. (2003). The Demograpgic dividend: A new perspective on the Economic
consequenses of population change. Santa Monica: CA:RAND.
J, c. A. (1972). The growth of Human Population: A mathematial Investigation. Princeton, NJ:
Princeton University Press.
James Gribble, B. J. (2012). Achieving a Demographic dividend. Population Bulletin, 67(2).
S. Henry Shryock, S. J. (1976). The Methods and Materials of Demography (condensed edition by
Edward Stockwell ed.). New York: Academic Press.