Downloaded 102 times
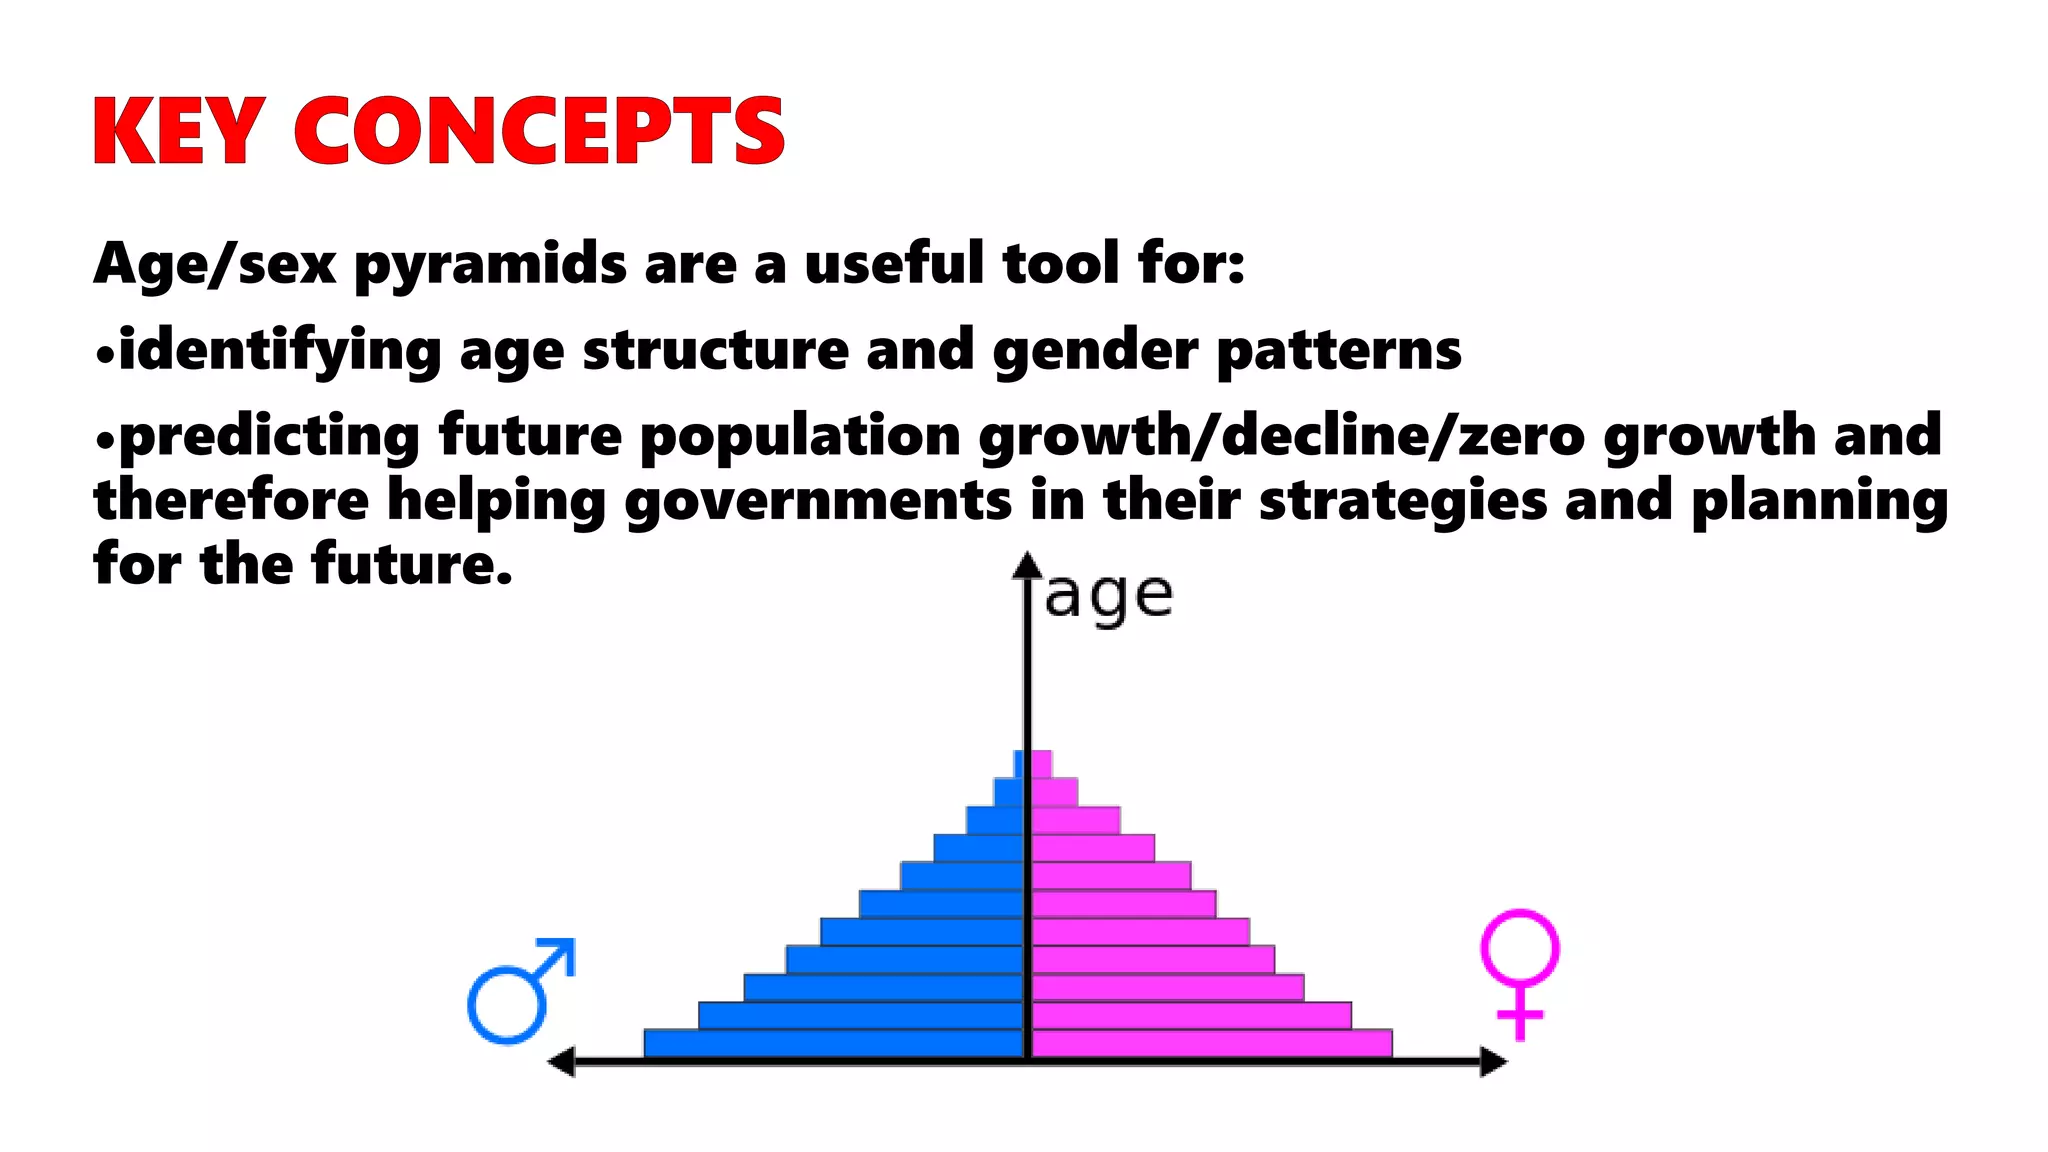


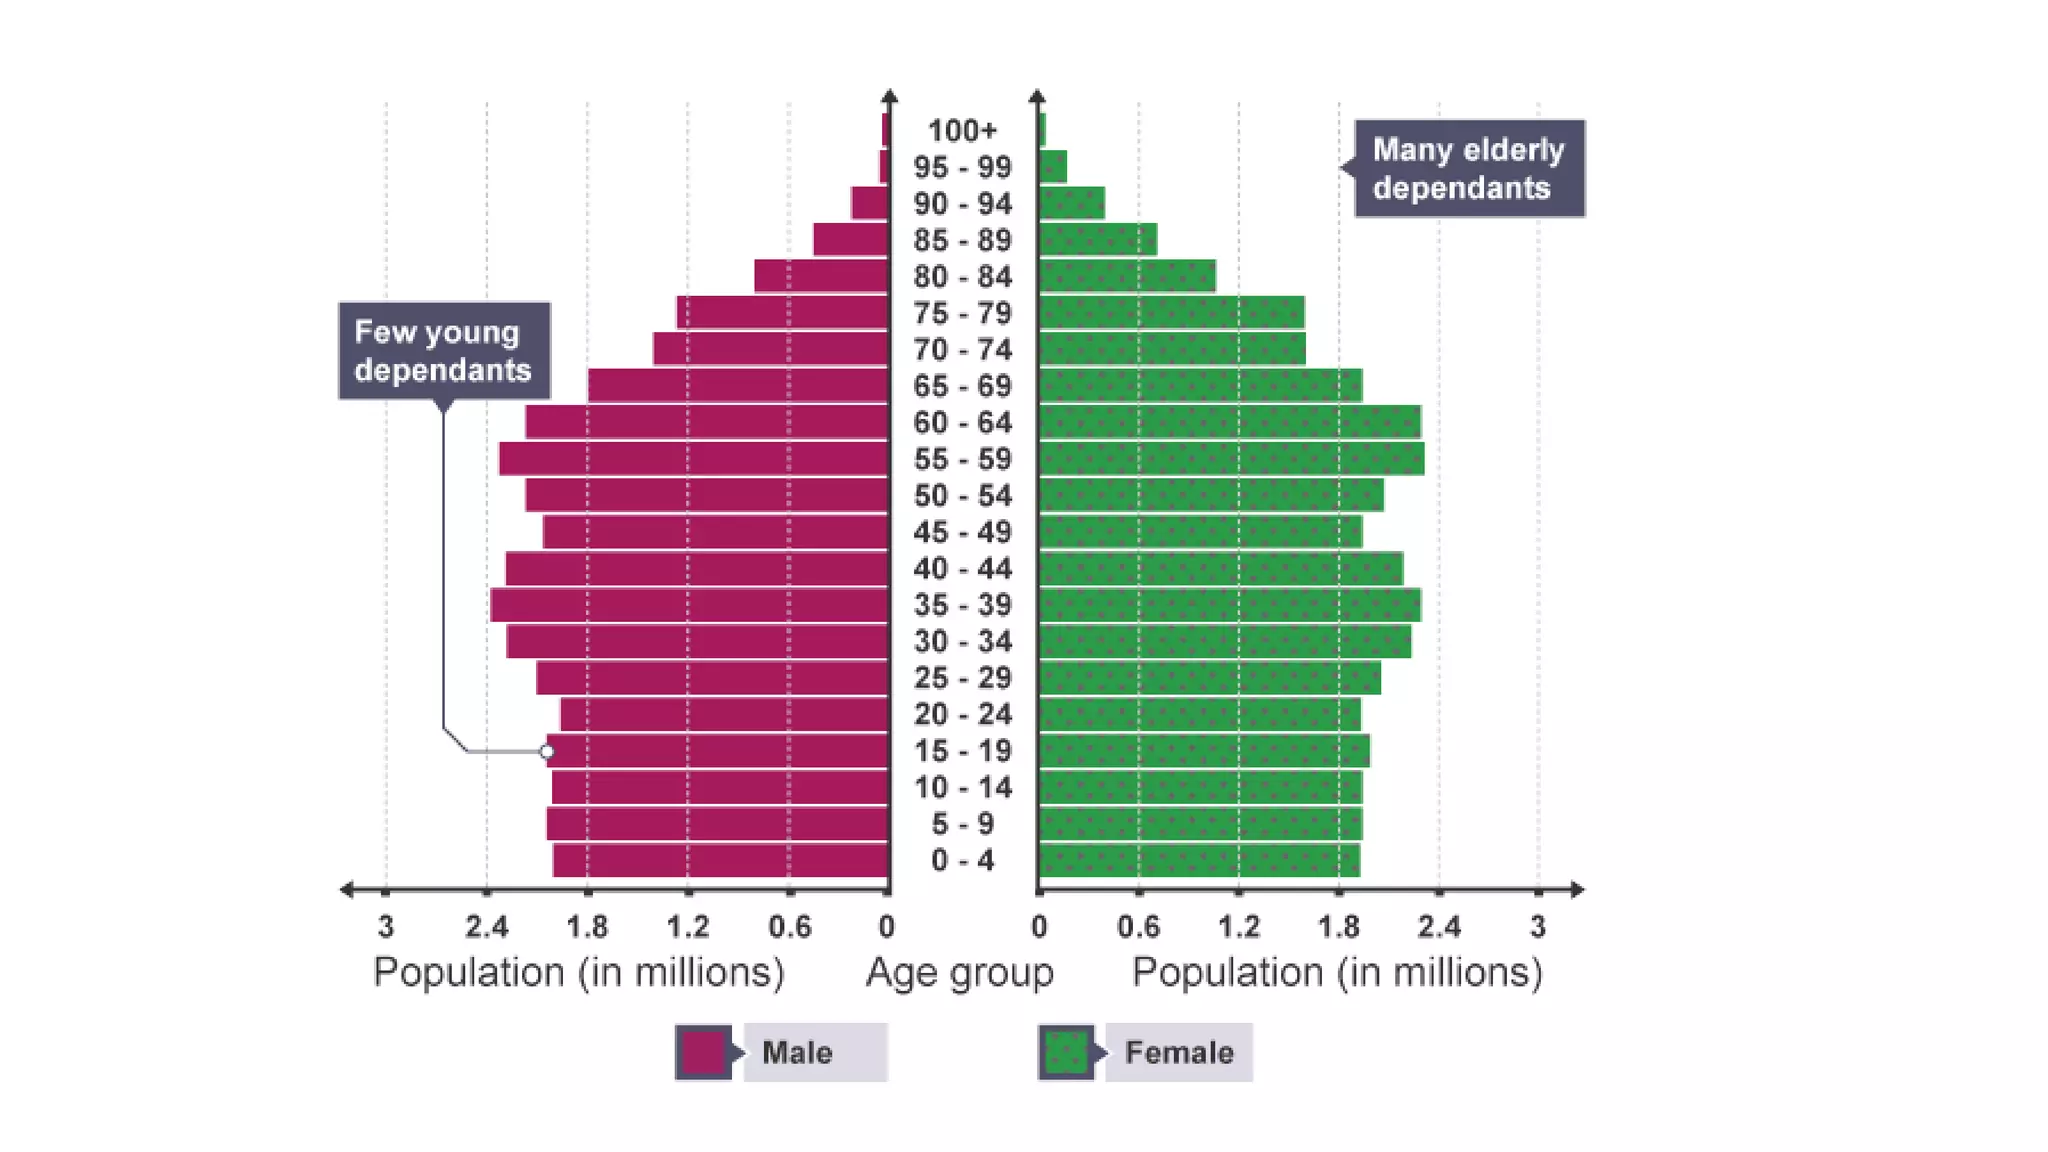
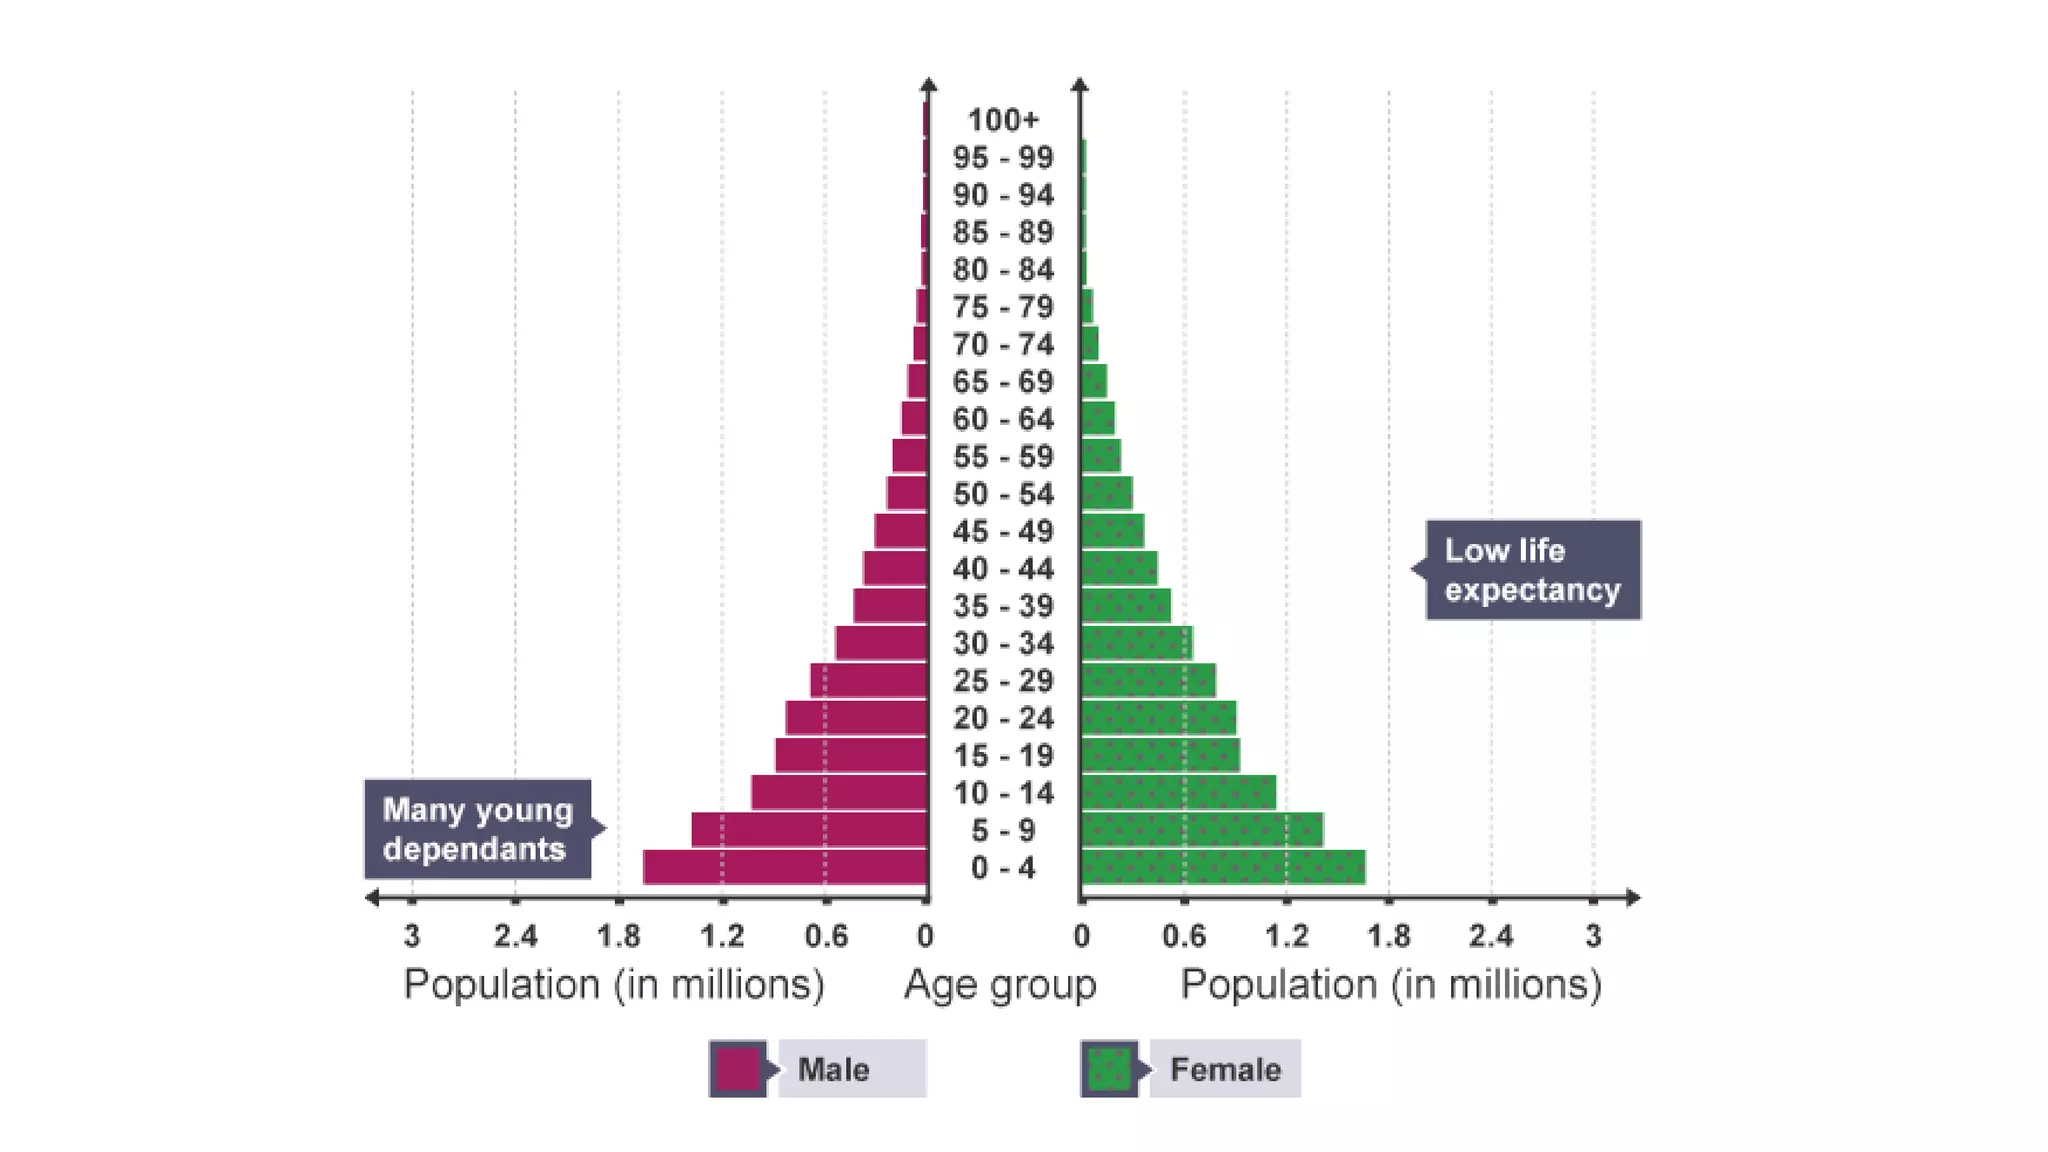

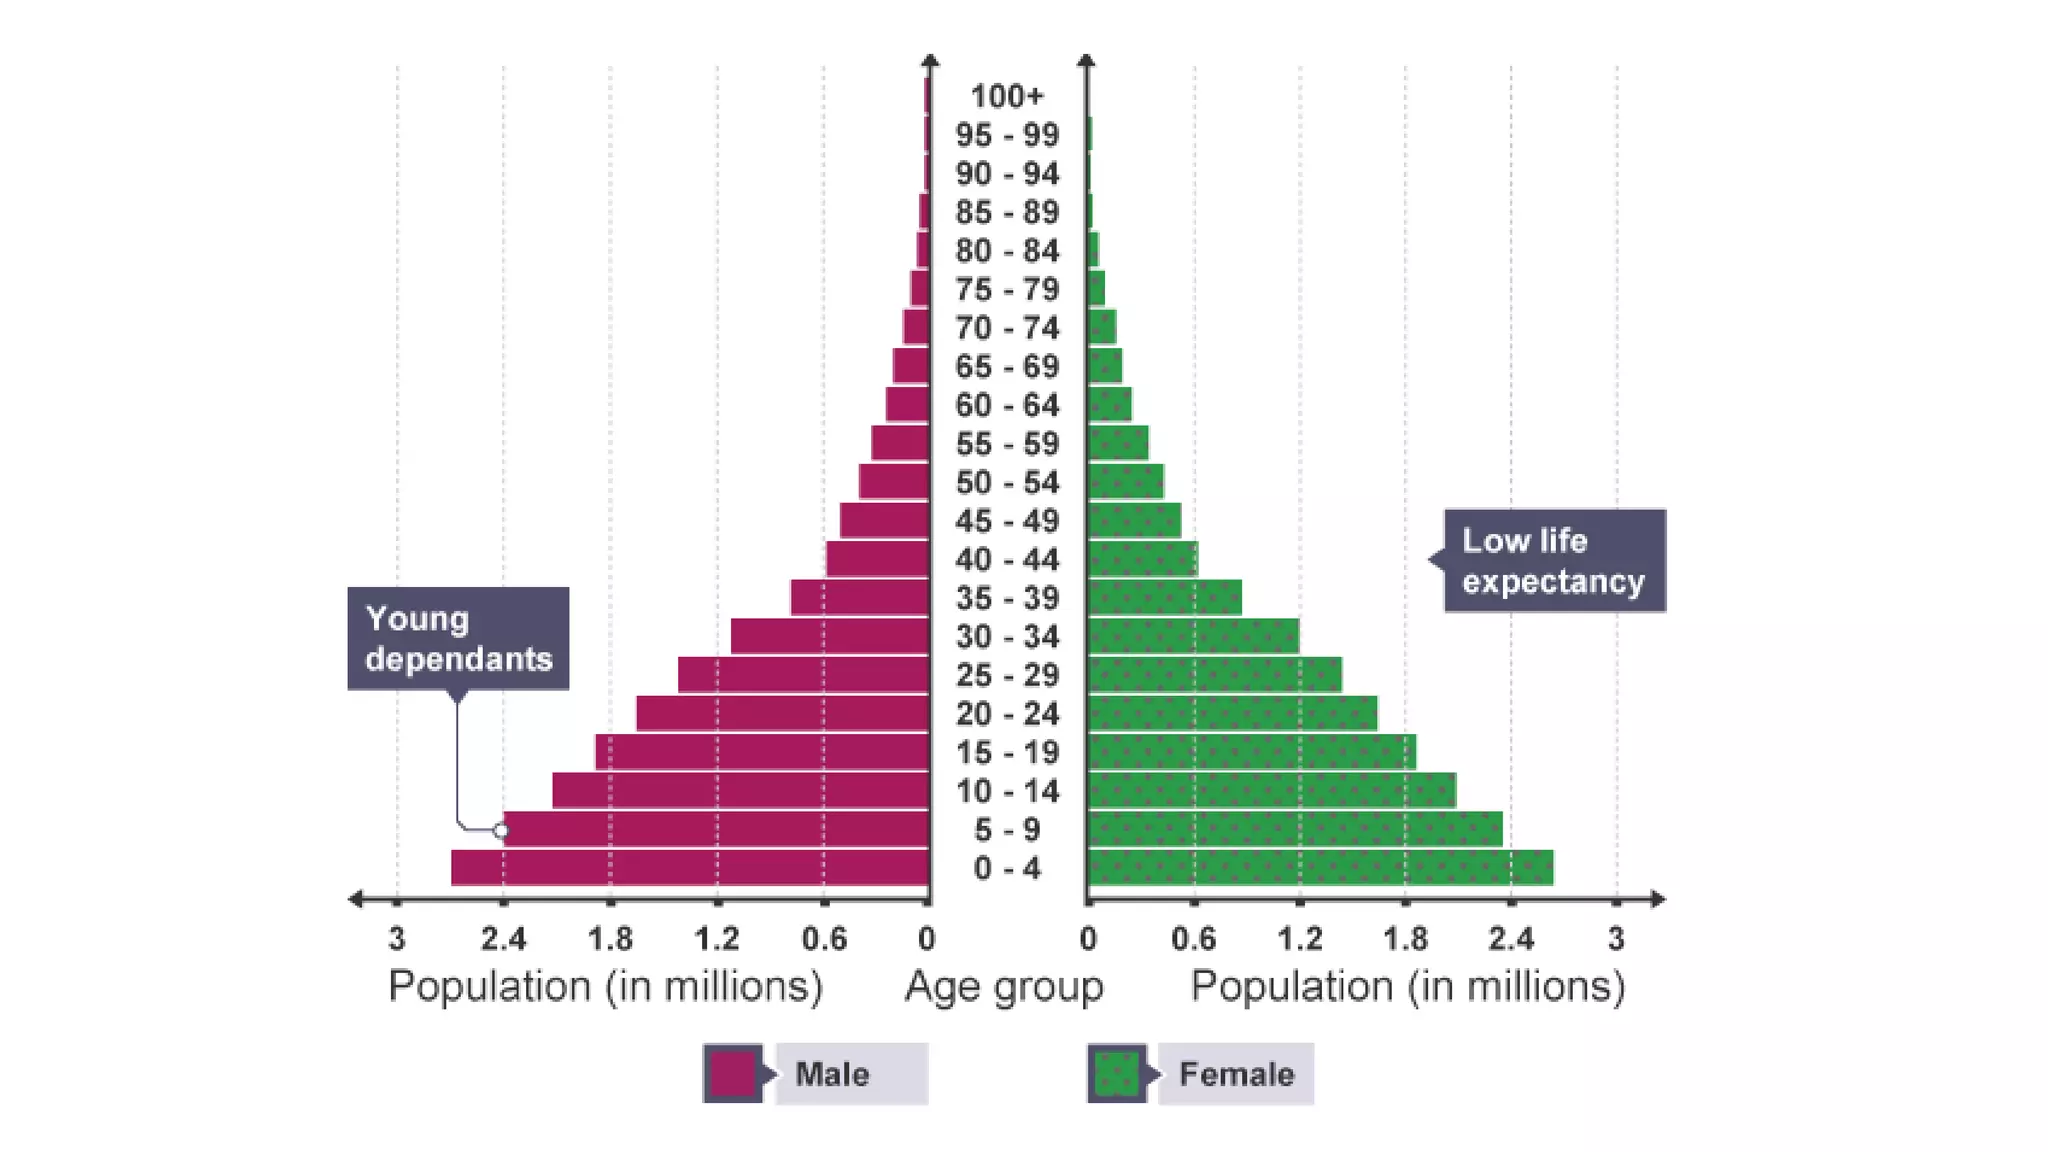

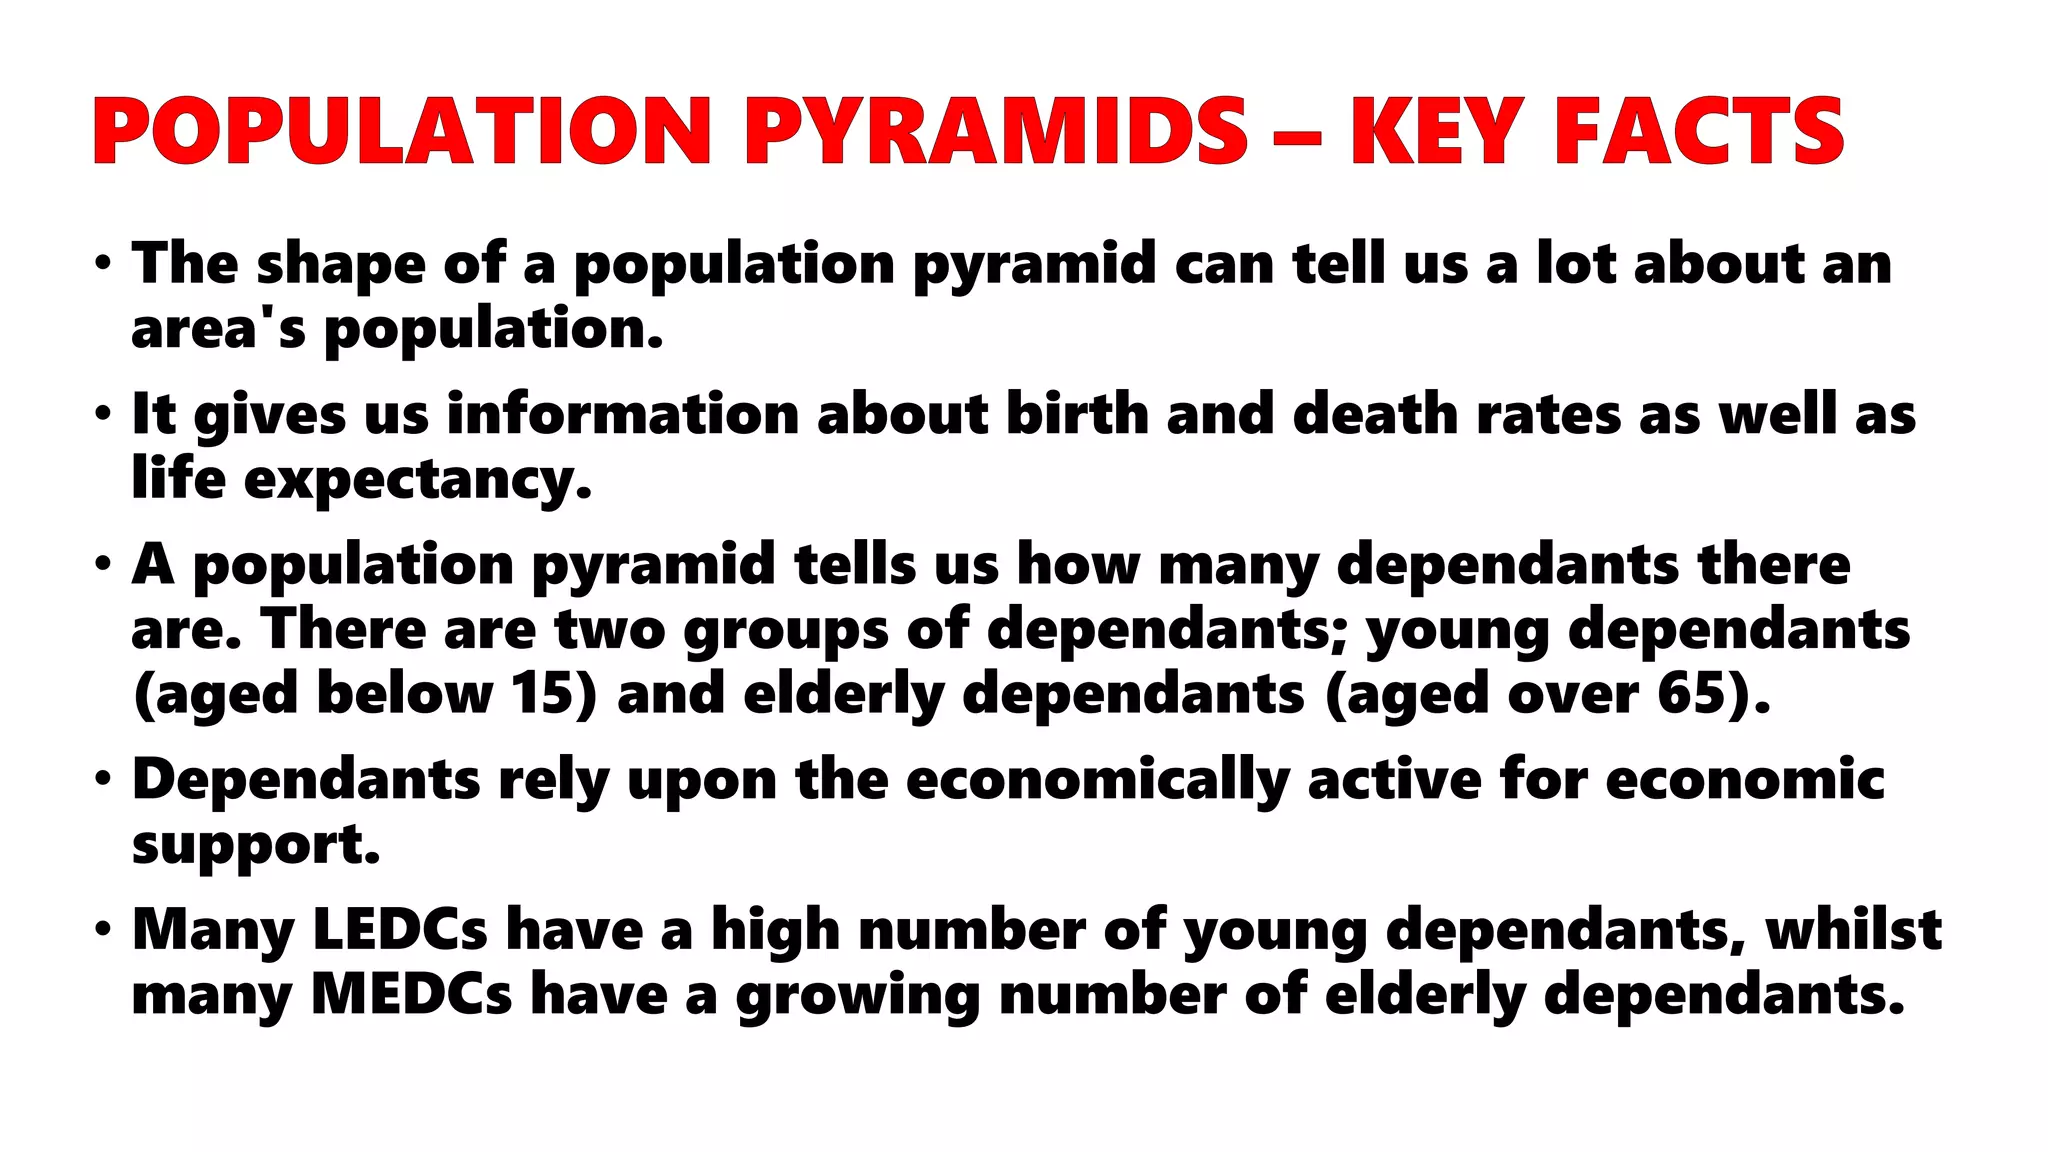


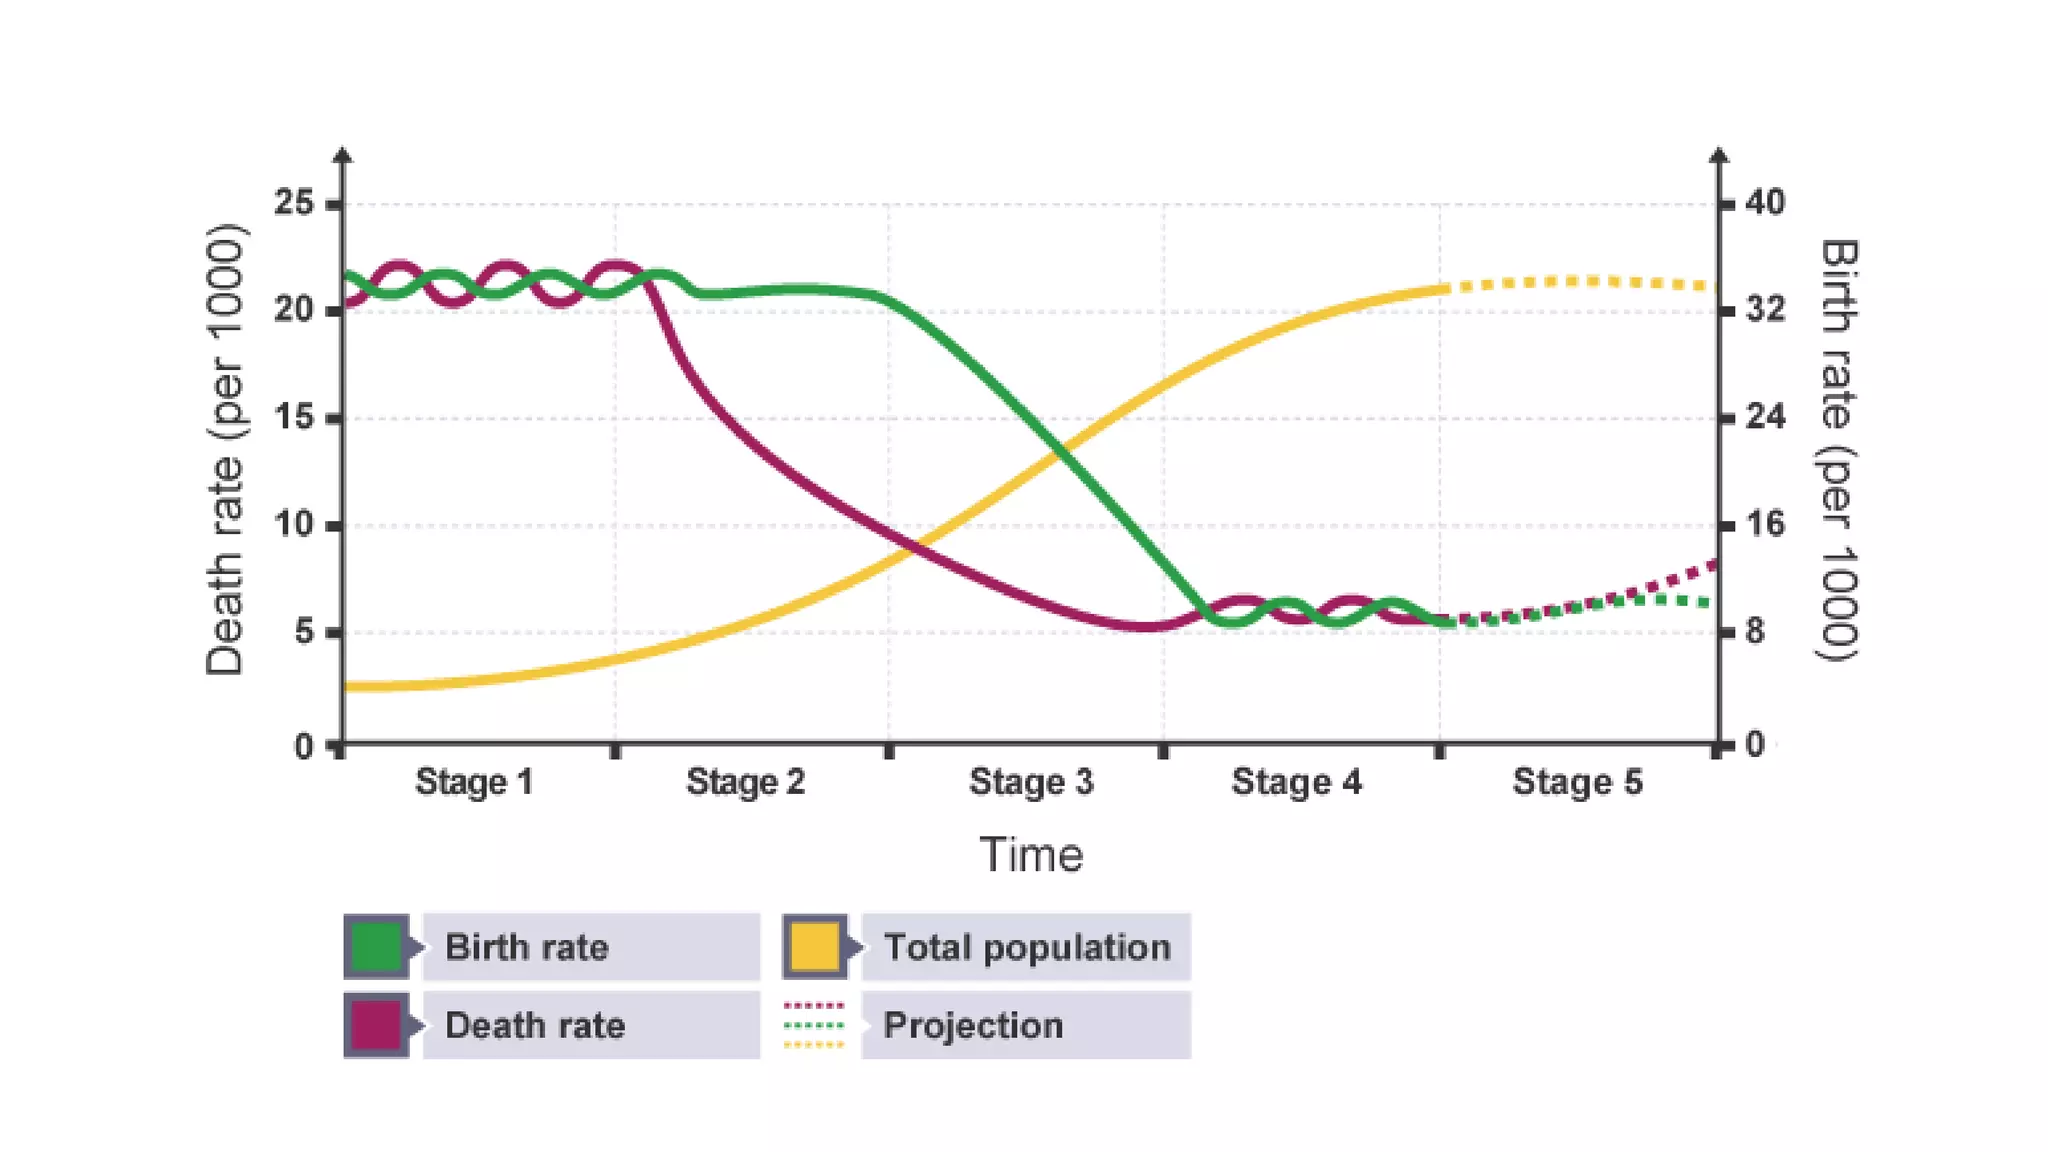


The document discusses population structure and demographics using population pyramids and the demographic transition model to illustrate differences between MEDCs like the UK and LEDCs like Mozambique. It explains how population pyramids reveal age and gender distribution, birth and death rates, and the reliance of dependants on the economically active population. The text outlines the stages of the demographic transition model, highlighting the changes in population trends as countries develop from high birth and death rates to lower rates.