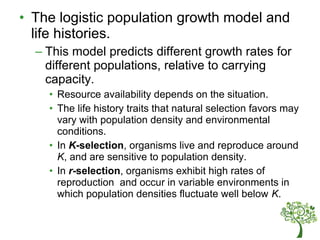
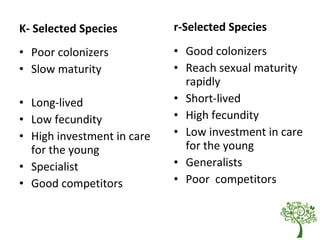
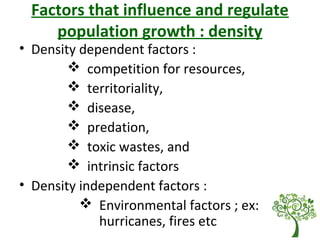
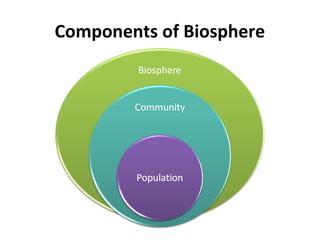
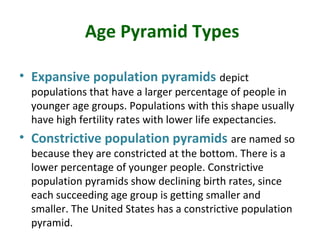
The document provides a comprehensive overview of population ecology, detailing the relationships between organisms and their environment, population attributes, and dynamics. It discusses population characteristics such as natality, mortality, density, sex ratio, and age distribution, along with different population growth models like exponential and logistic growth. Additionally, it examines factors influencing population growth, including density-dependent and density-independent factors, along with the impacts of resource competition, territoriality, diseases, predation, and environmental changes.

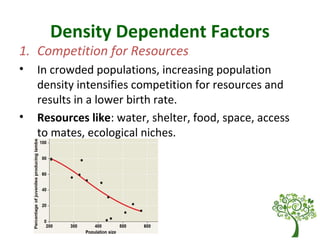
![Population Dispersal
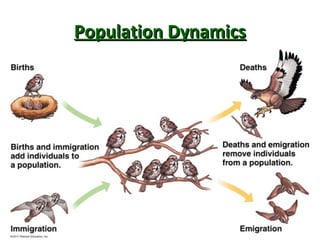
• The movement of individuals into or out of the
population or the population area.
EMIGRATION – one way outward movement of individuals from an area.
IMMIGRATION – one way inward movement of individuals into an area.
MIGRATION – periodic departure & return of individuals to same area.
• Population size is affected by :
- No. of births (b)
- No. of deaths (d)
- Immigrants (i)
- Emigrants (e)
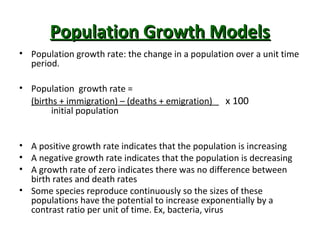
• Growth Rate of Population (r) :
a)rate of change in size [r = b – d]
b) population ↑’s in size as long as b>d
c) r= (b-d) +(i-e) { when migration is a factor}](https://image.slidesharecdn.com/populationecologyy-161019063455/85/Population-ecologyy-11-320.jpg)