Downloaded 35 times


![Calculating Mid-Year Population
•Mid-year population
= (P1 + P2) / 2
= [P1 + (P1 – D)] / 2
= P1 - ½ D
= P1 – ½ (P2 – P1)
• where:
• P1 = population on 1st January
• P2 = population on 1st January next year
• D = Deaths in a year
Q: Which formula is easy to memorize?](https://image.slidesharecdn.com/session1-introductionofdemographyasof3-1-2017-170106154634/75/Session-1-introduction-of-demography-as-of-3-1-2017-31-2048.jpg)


This document provides an introduction to the field of demography. It defines demography as the statistical study of human populations in terms of their size, structure, distributions, and changes over time due to births, deaths, and migration. The document outlines the history and origins of demography, describing how it began with John Graunt's study of mortality records in 17th century England. It also discusses the main sources of demographic data like vital registration systems, surveys, and censuses. Finally, it covers the basic measurements and concepts used in demography like ratios, rates, and probabilities, as well as how demography is applied to areas like policy planning, business decisions, and scientific research.
Overview of demography by Dr. Min Ko Ko, introducing academic background and expertise.
The structure of the presentation covering the meaning, origin, sources, uses, and measurements of demography.
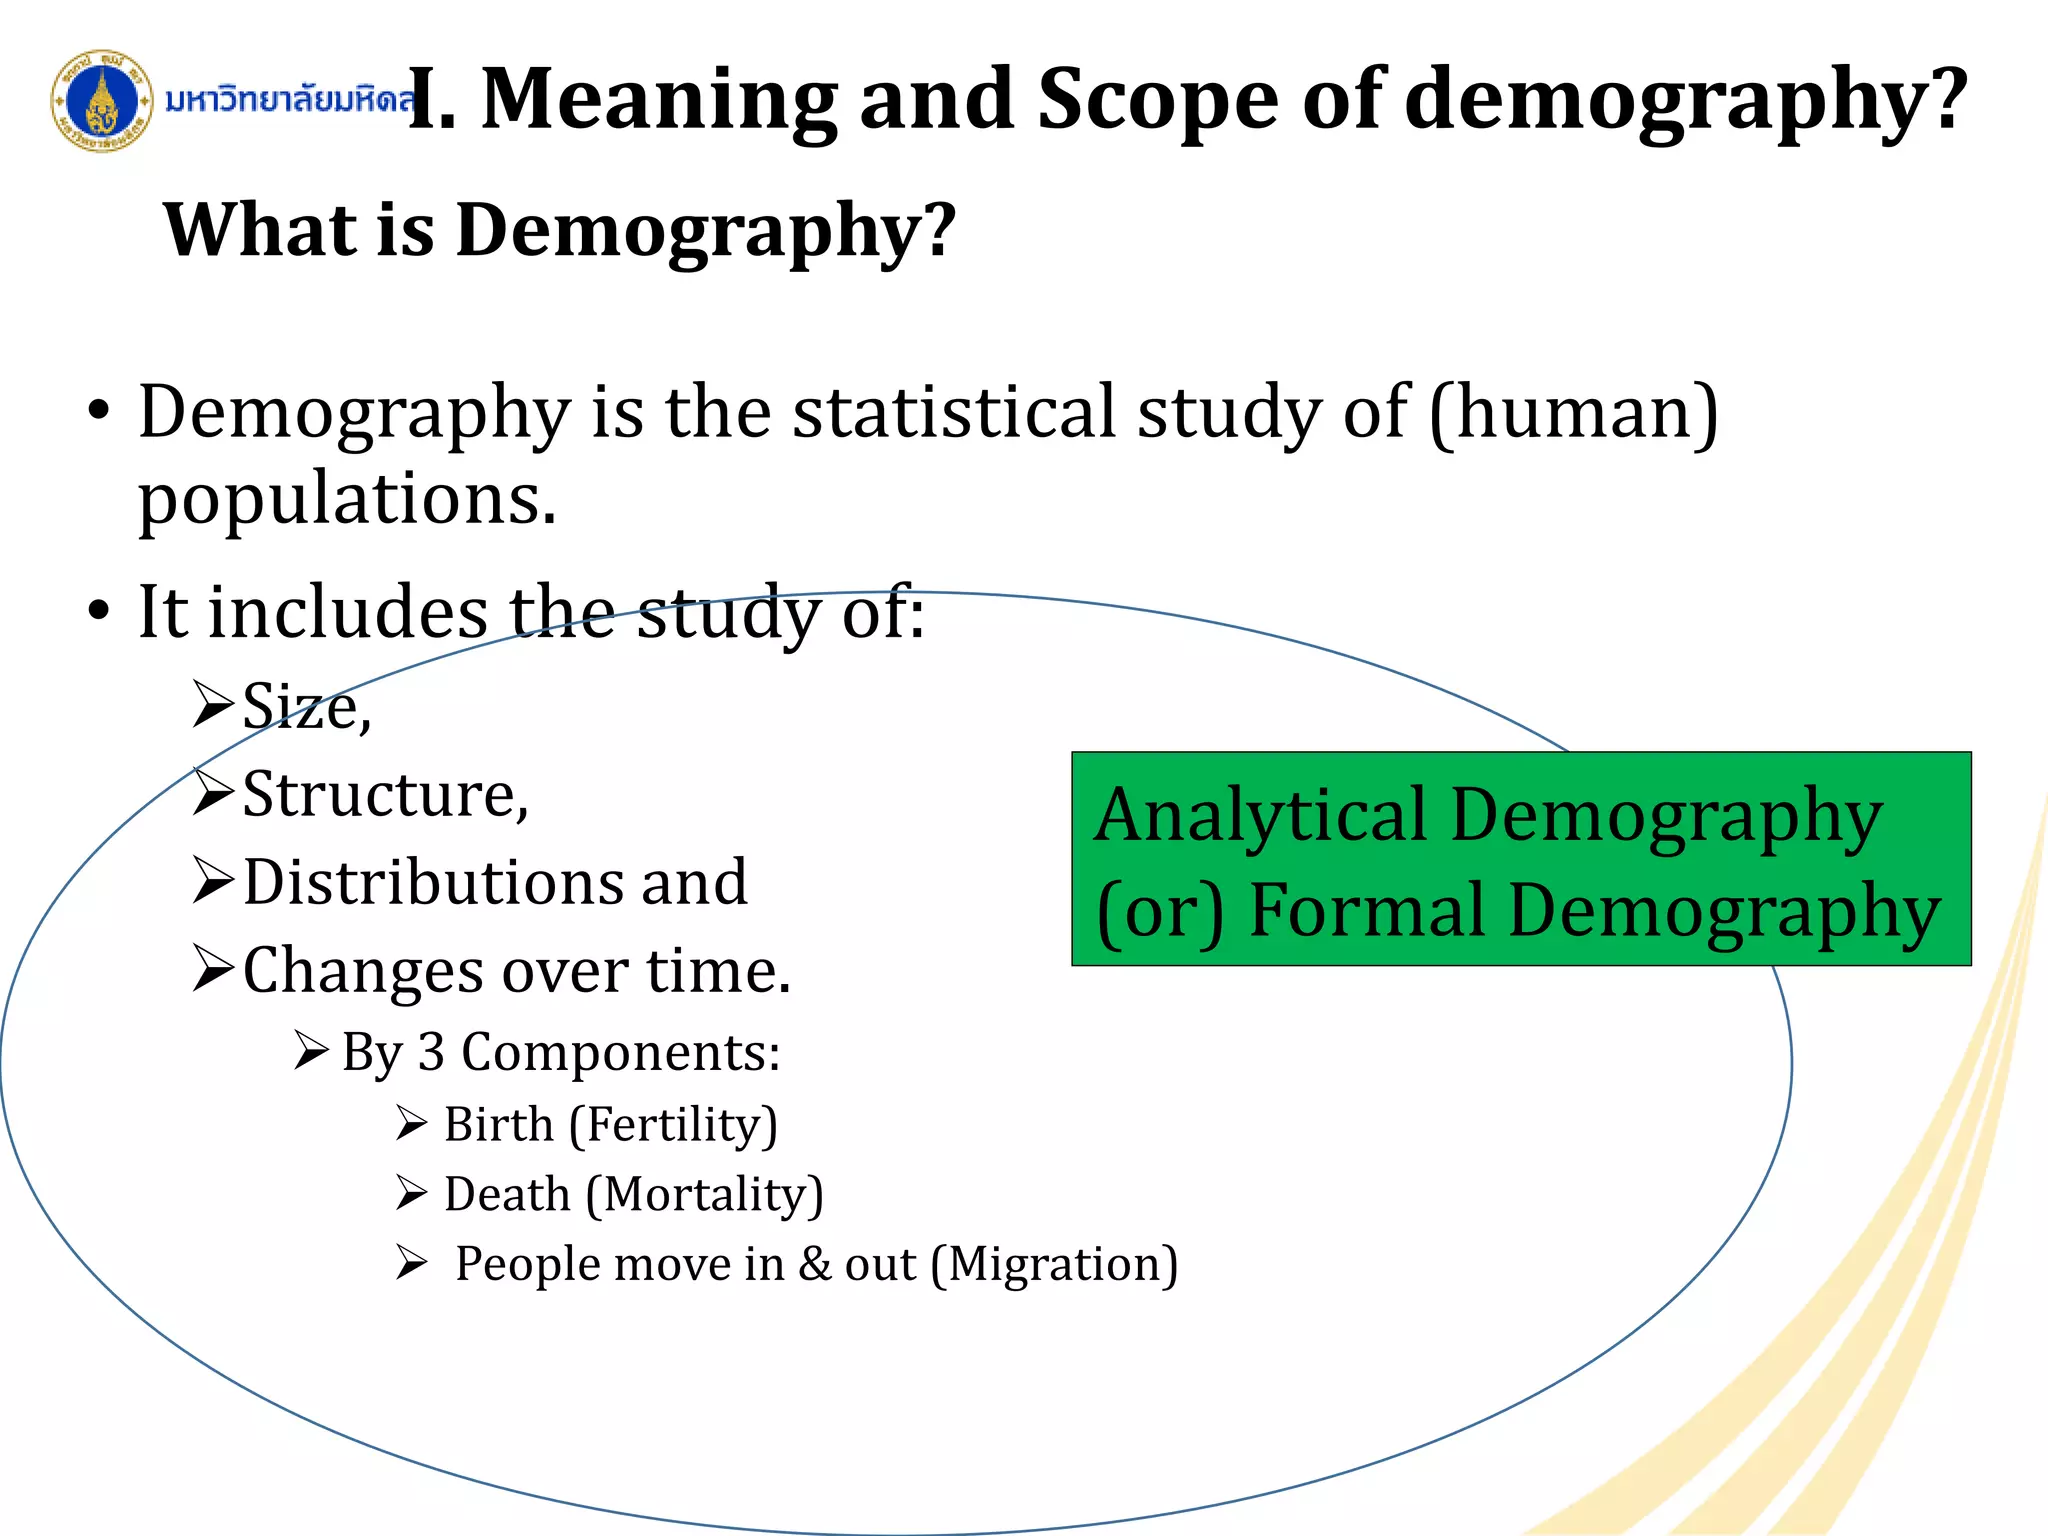
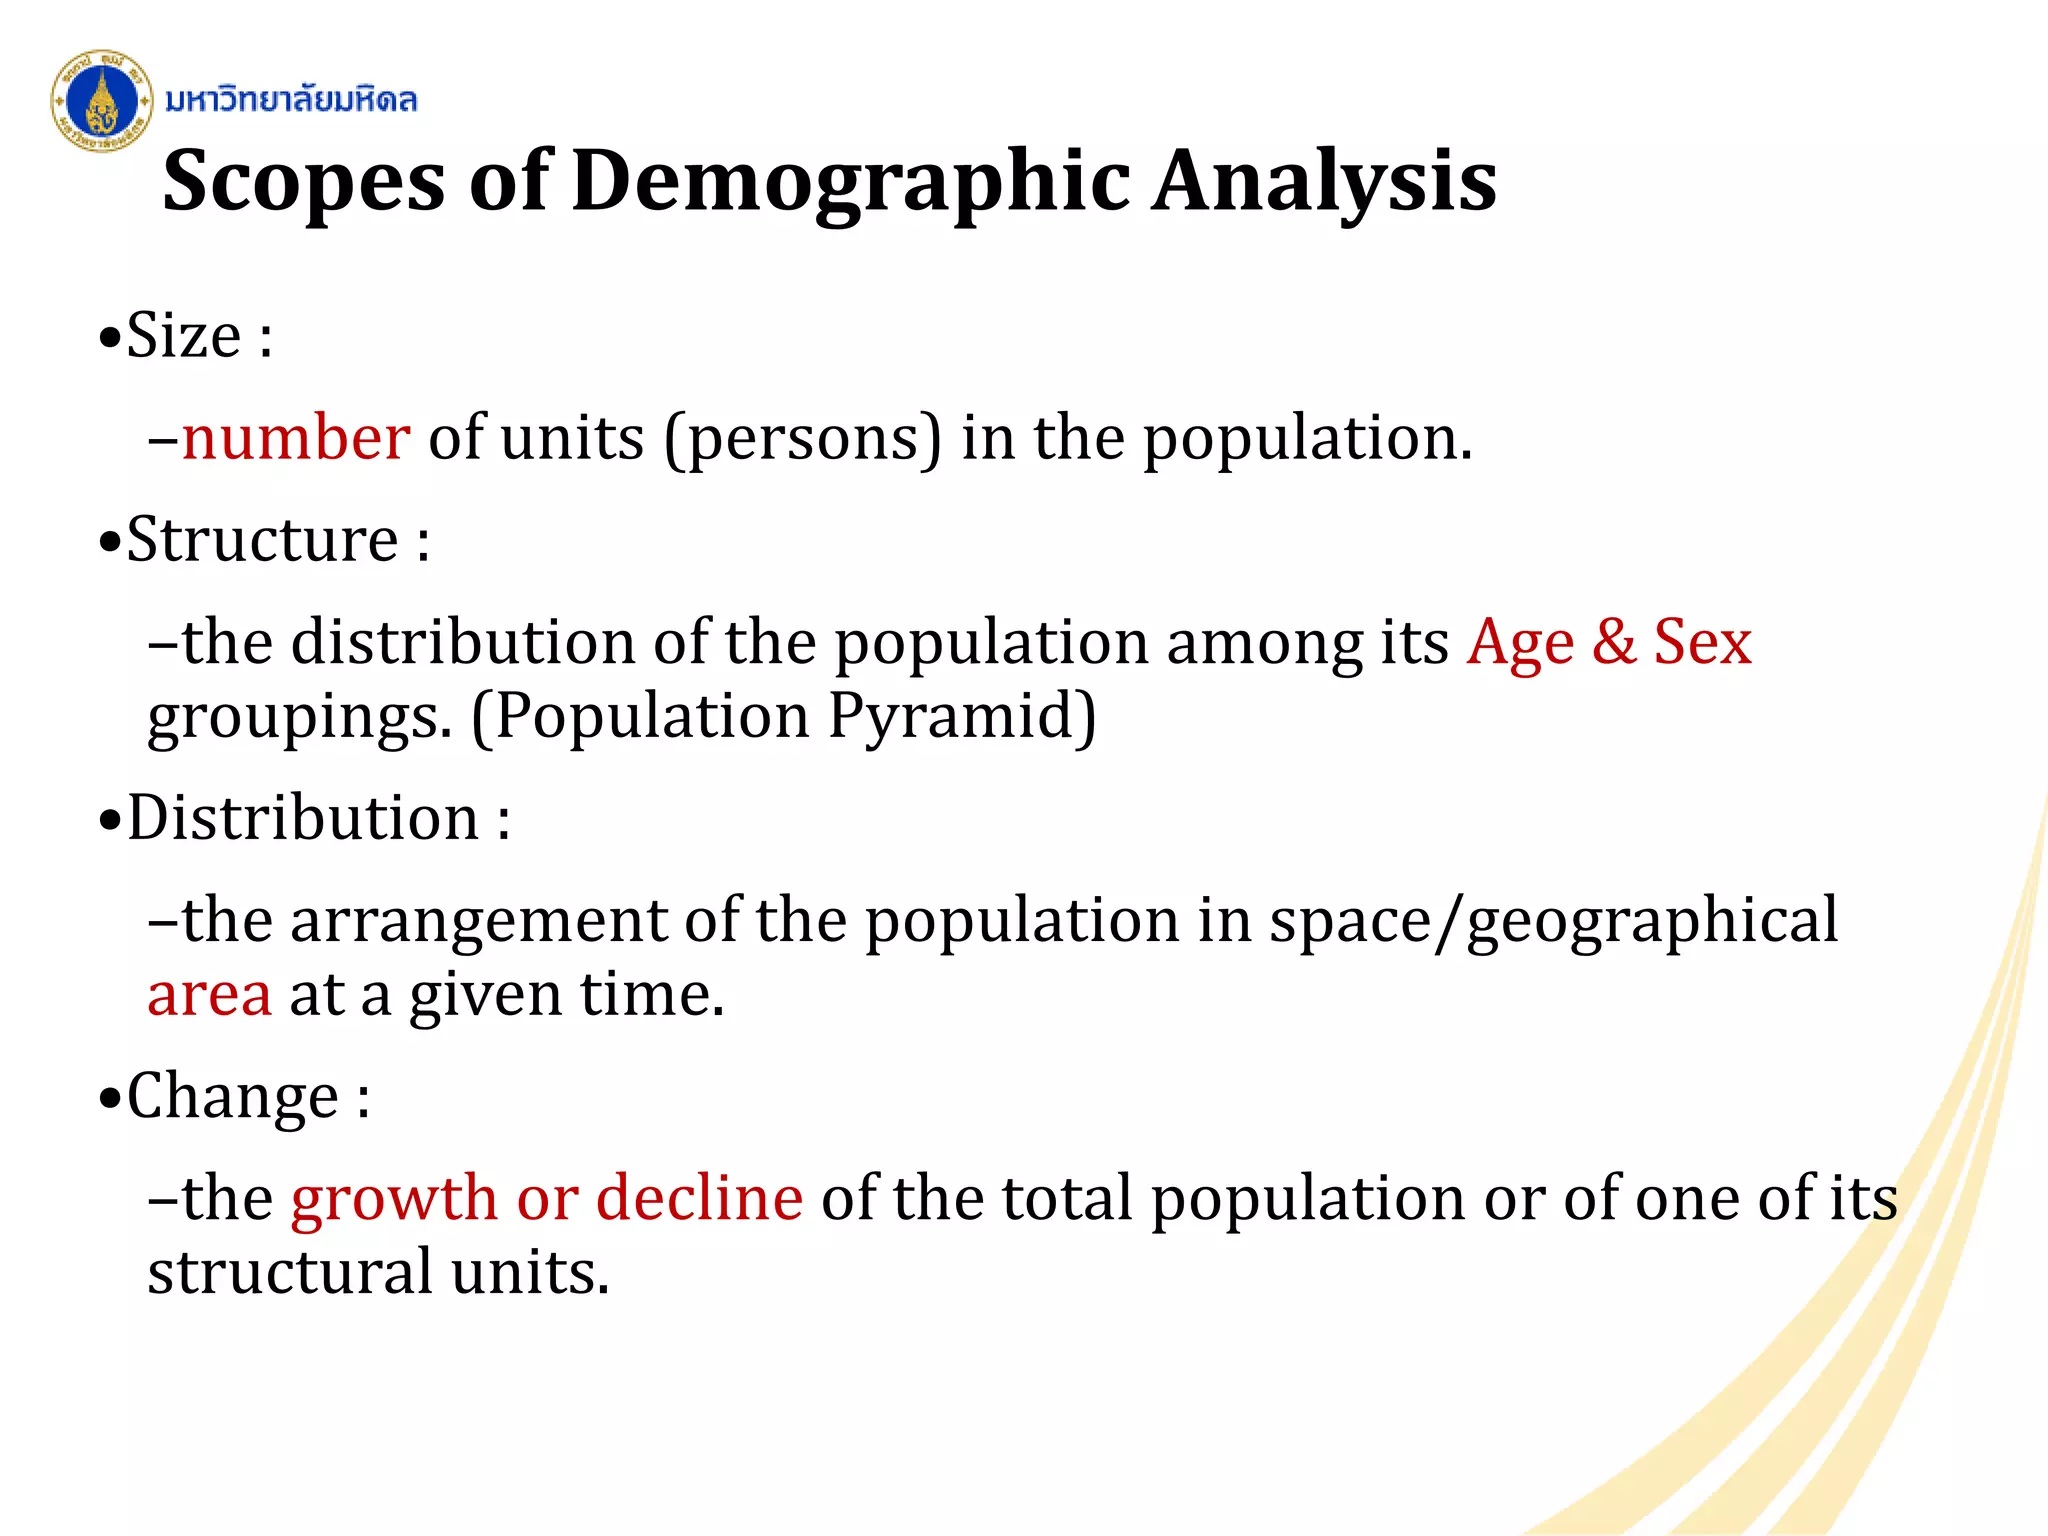
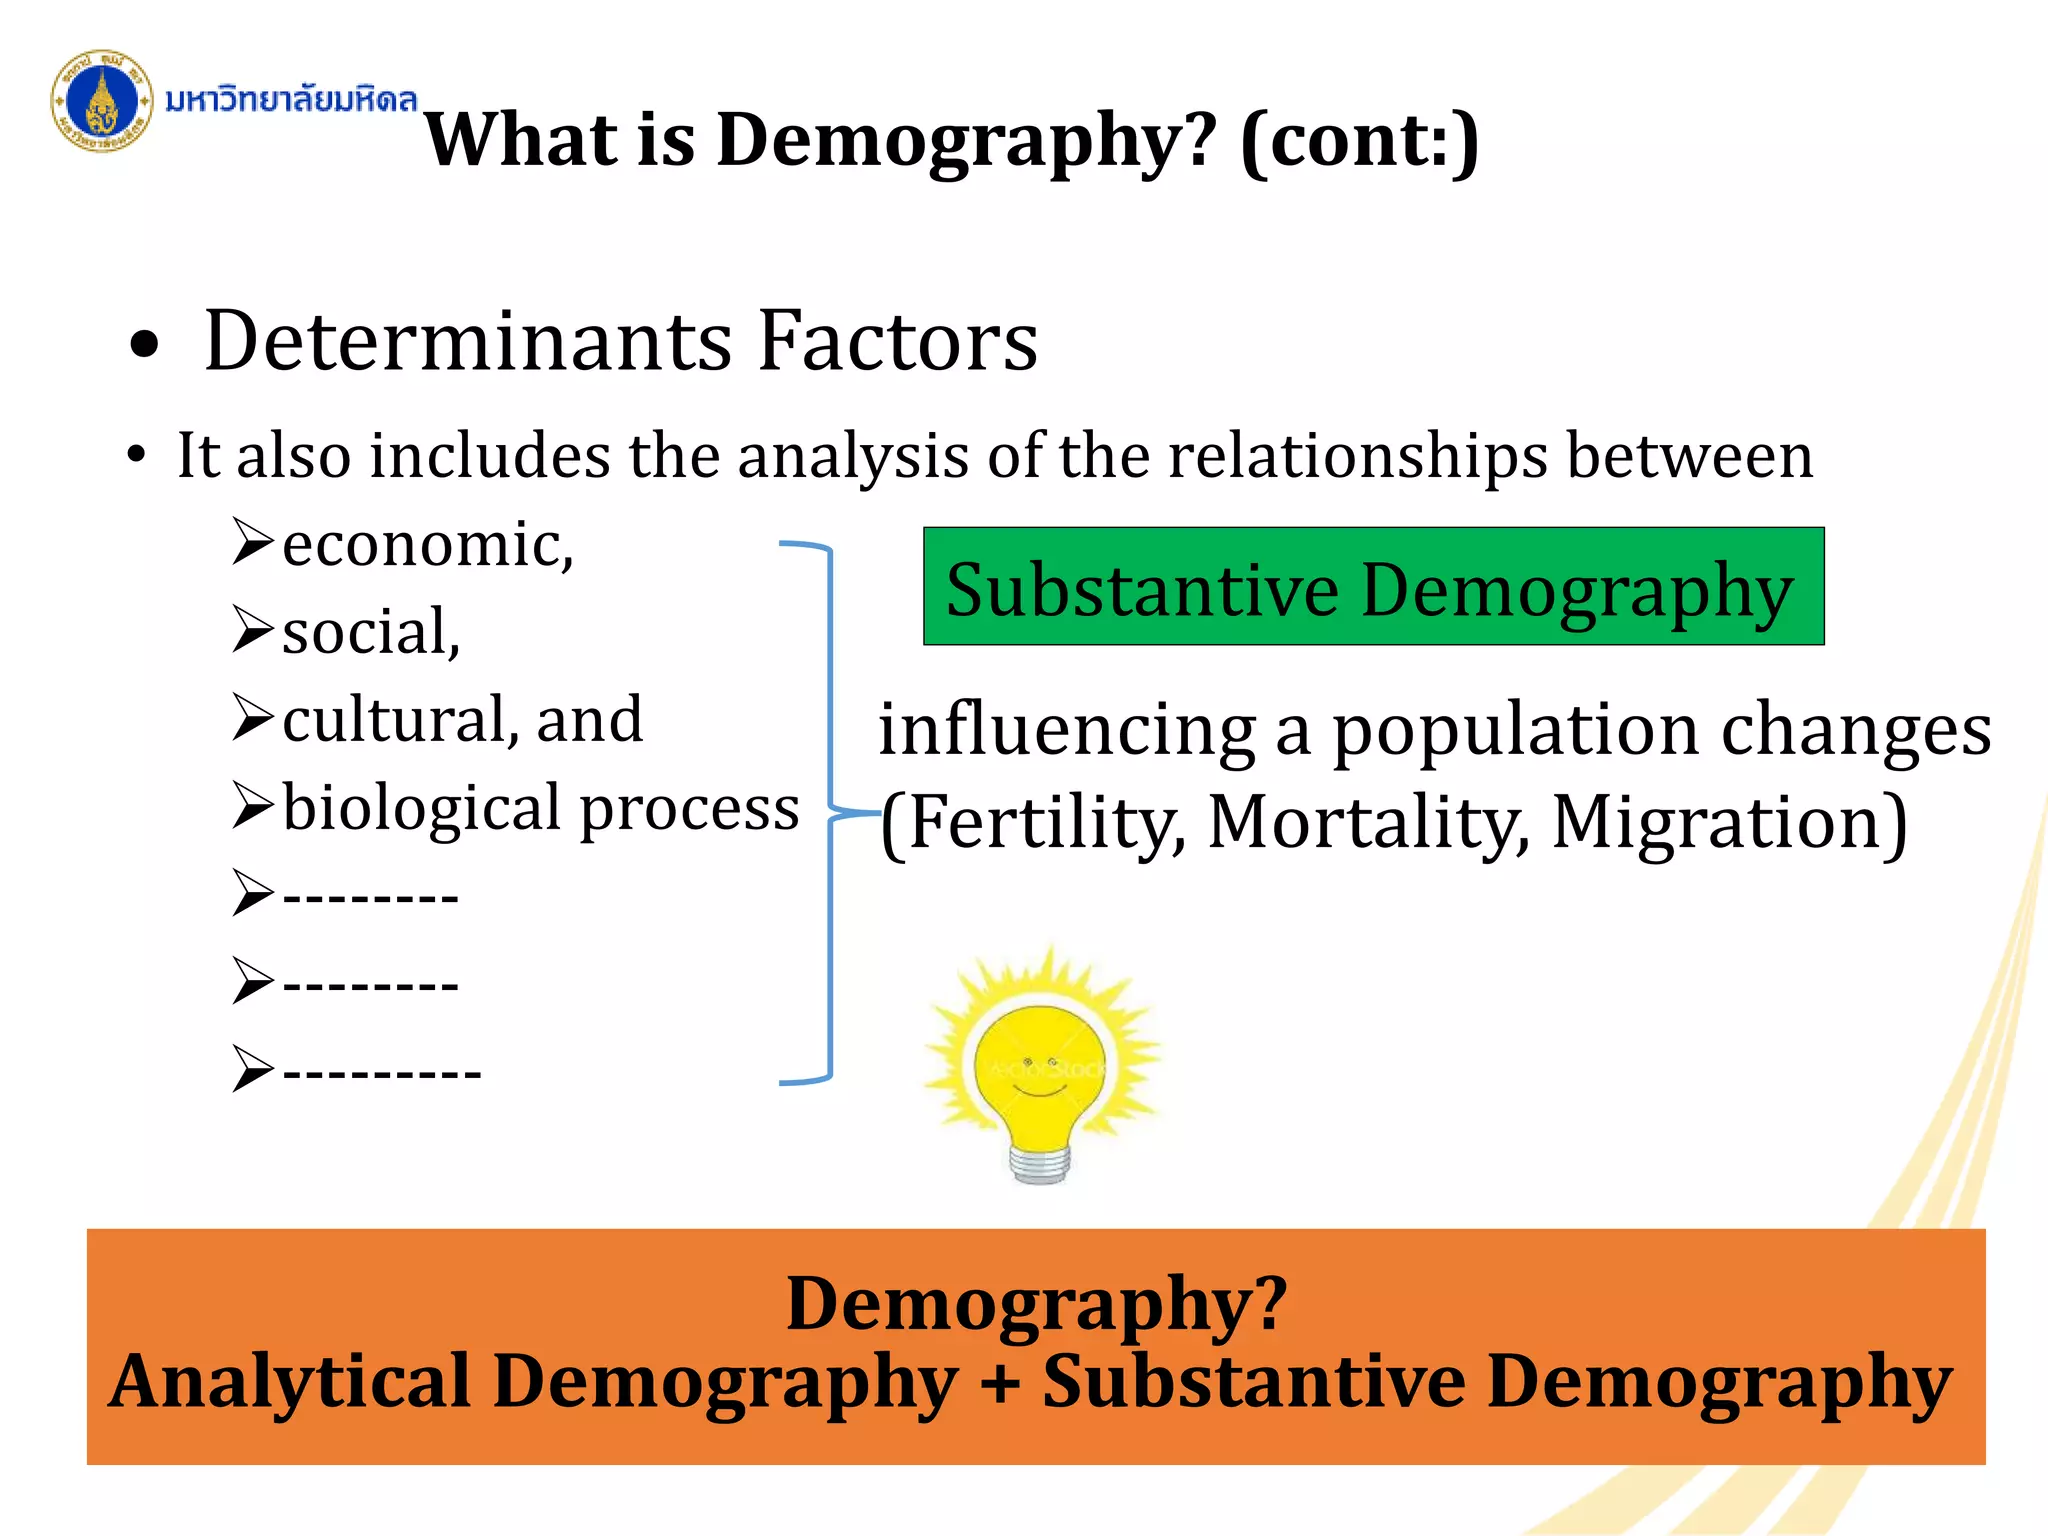
Demography is the study of human populations including size, structure, distribution, and changes over time.
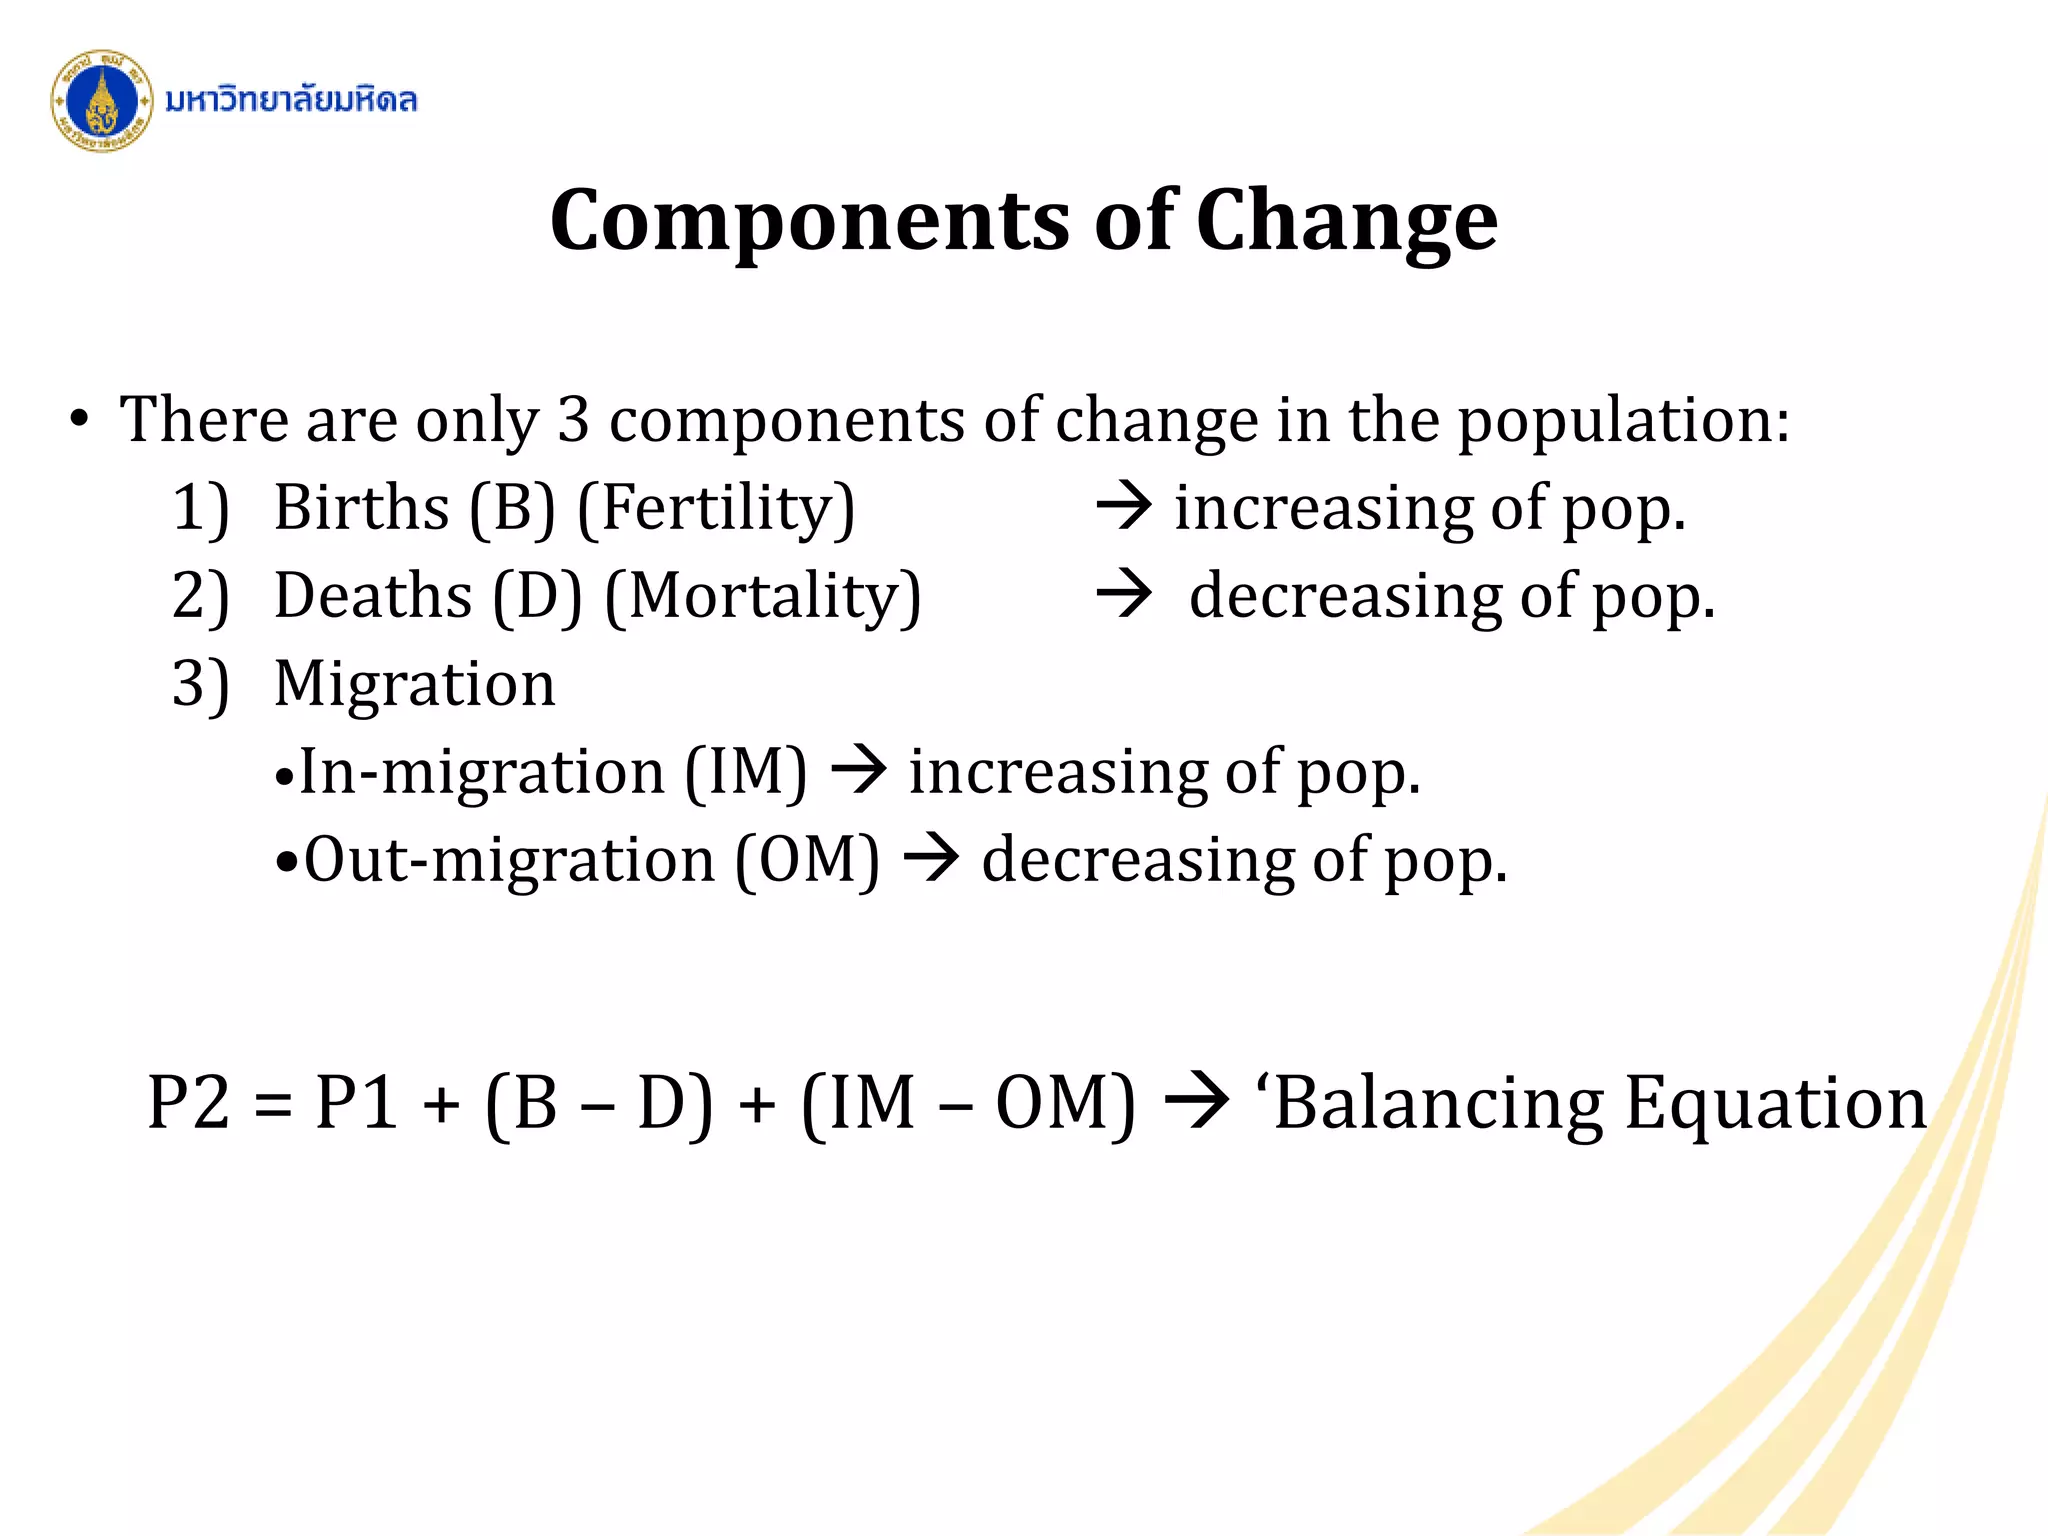
Explains vital components of population change: birth, death, migration, and their analytical aspects.
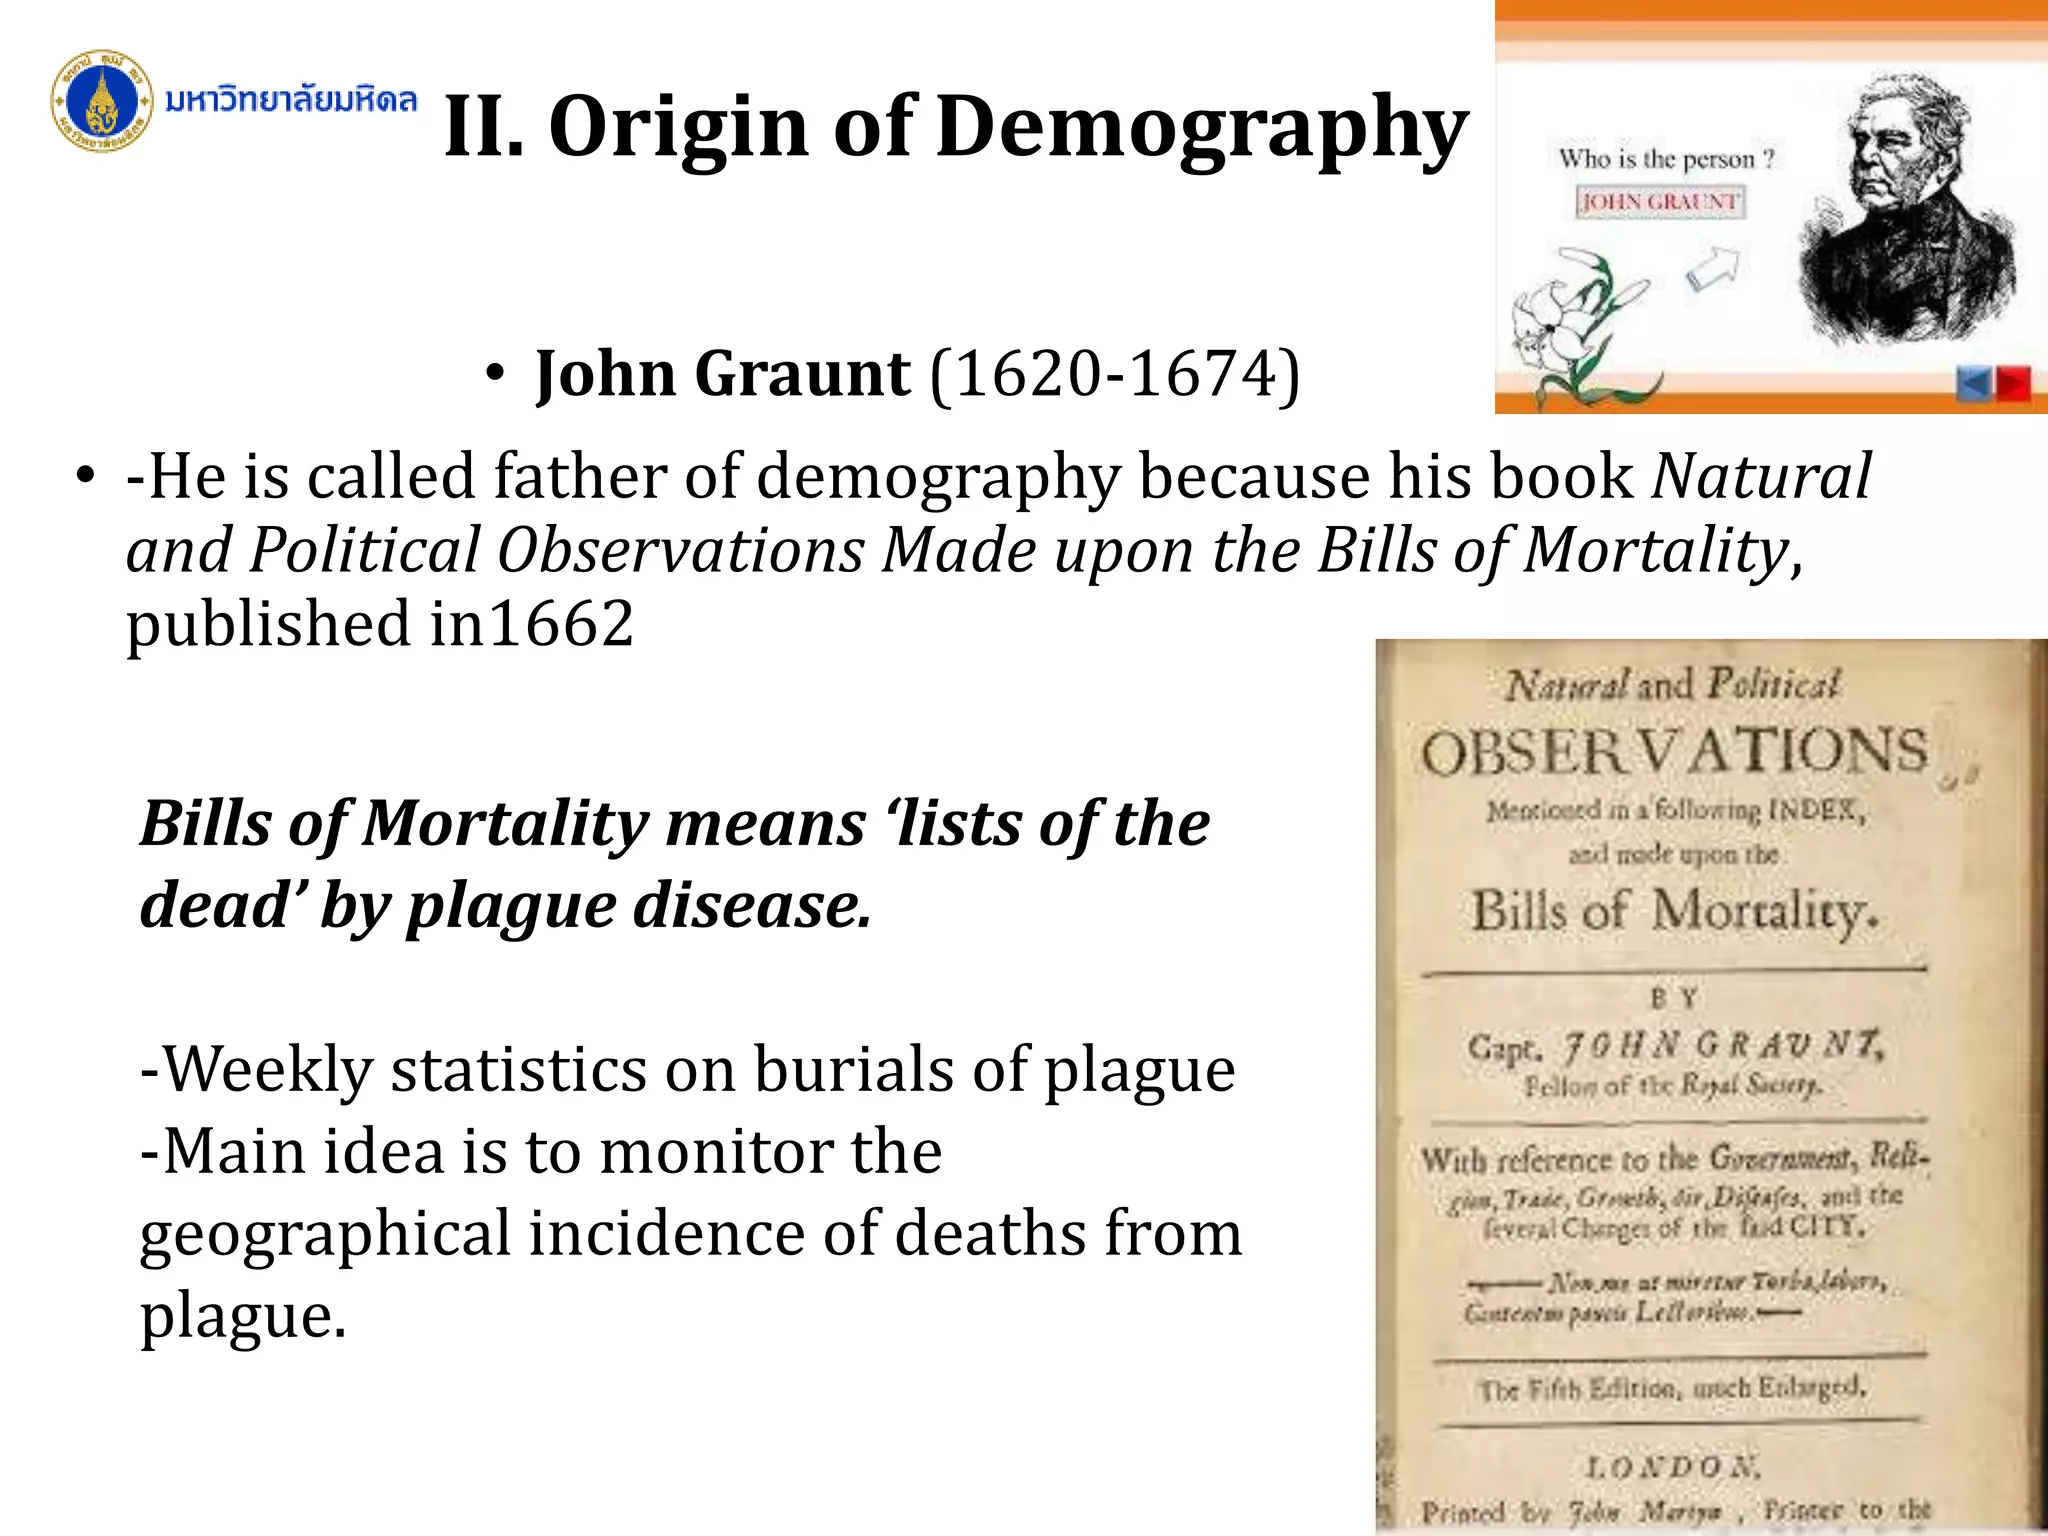
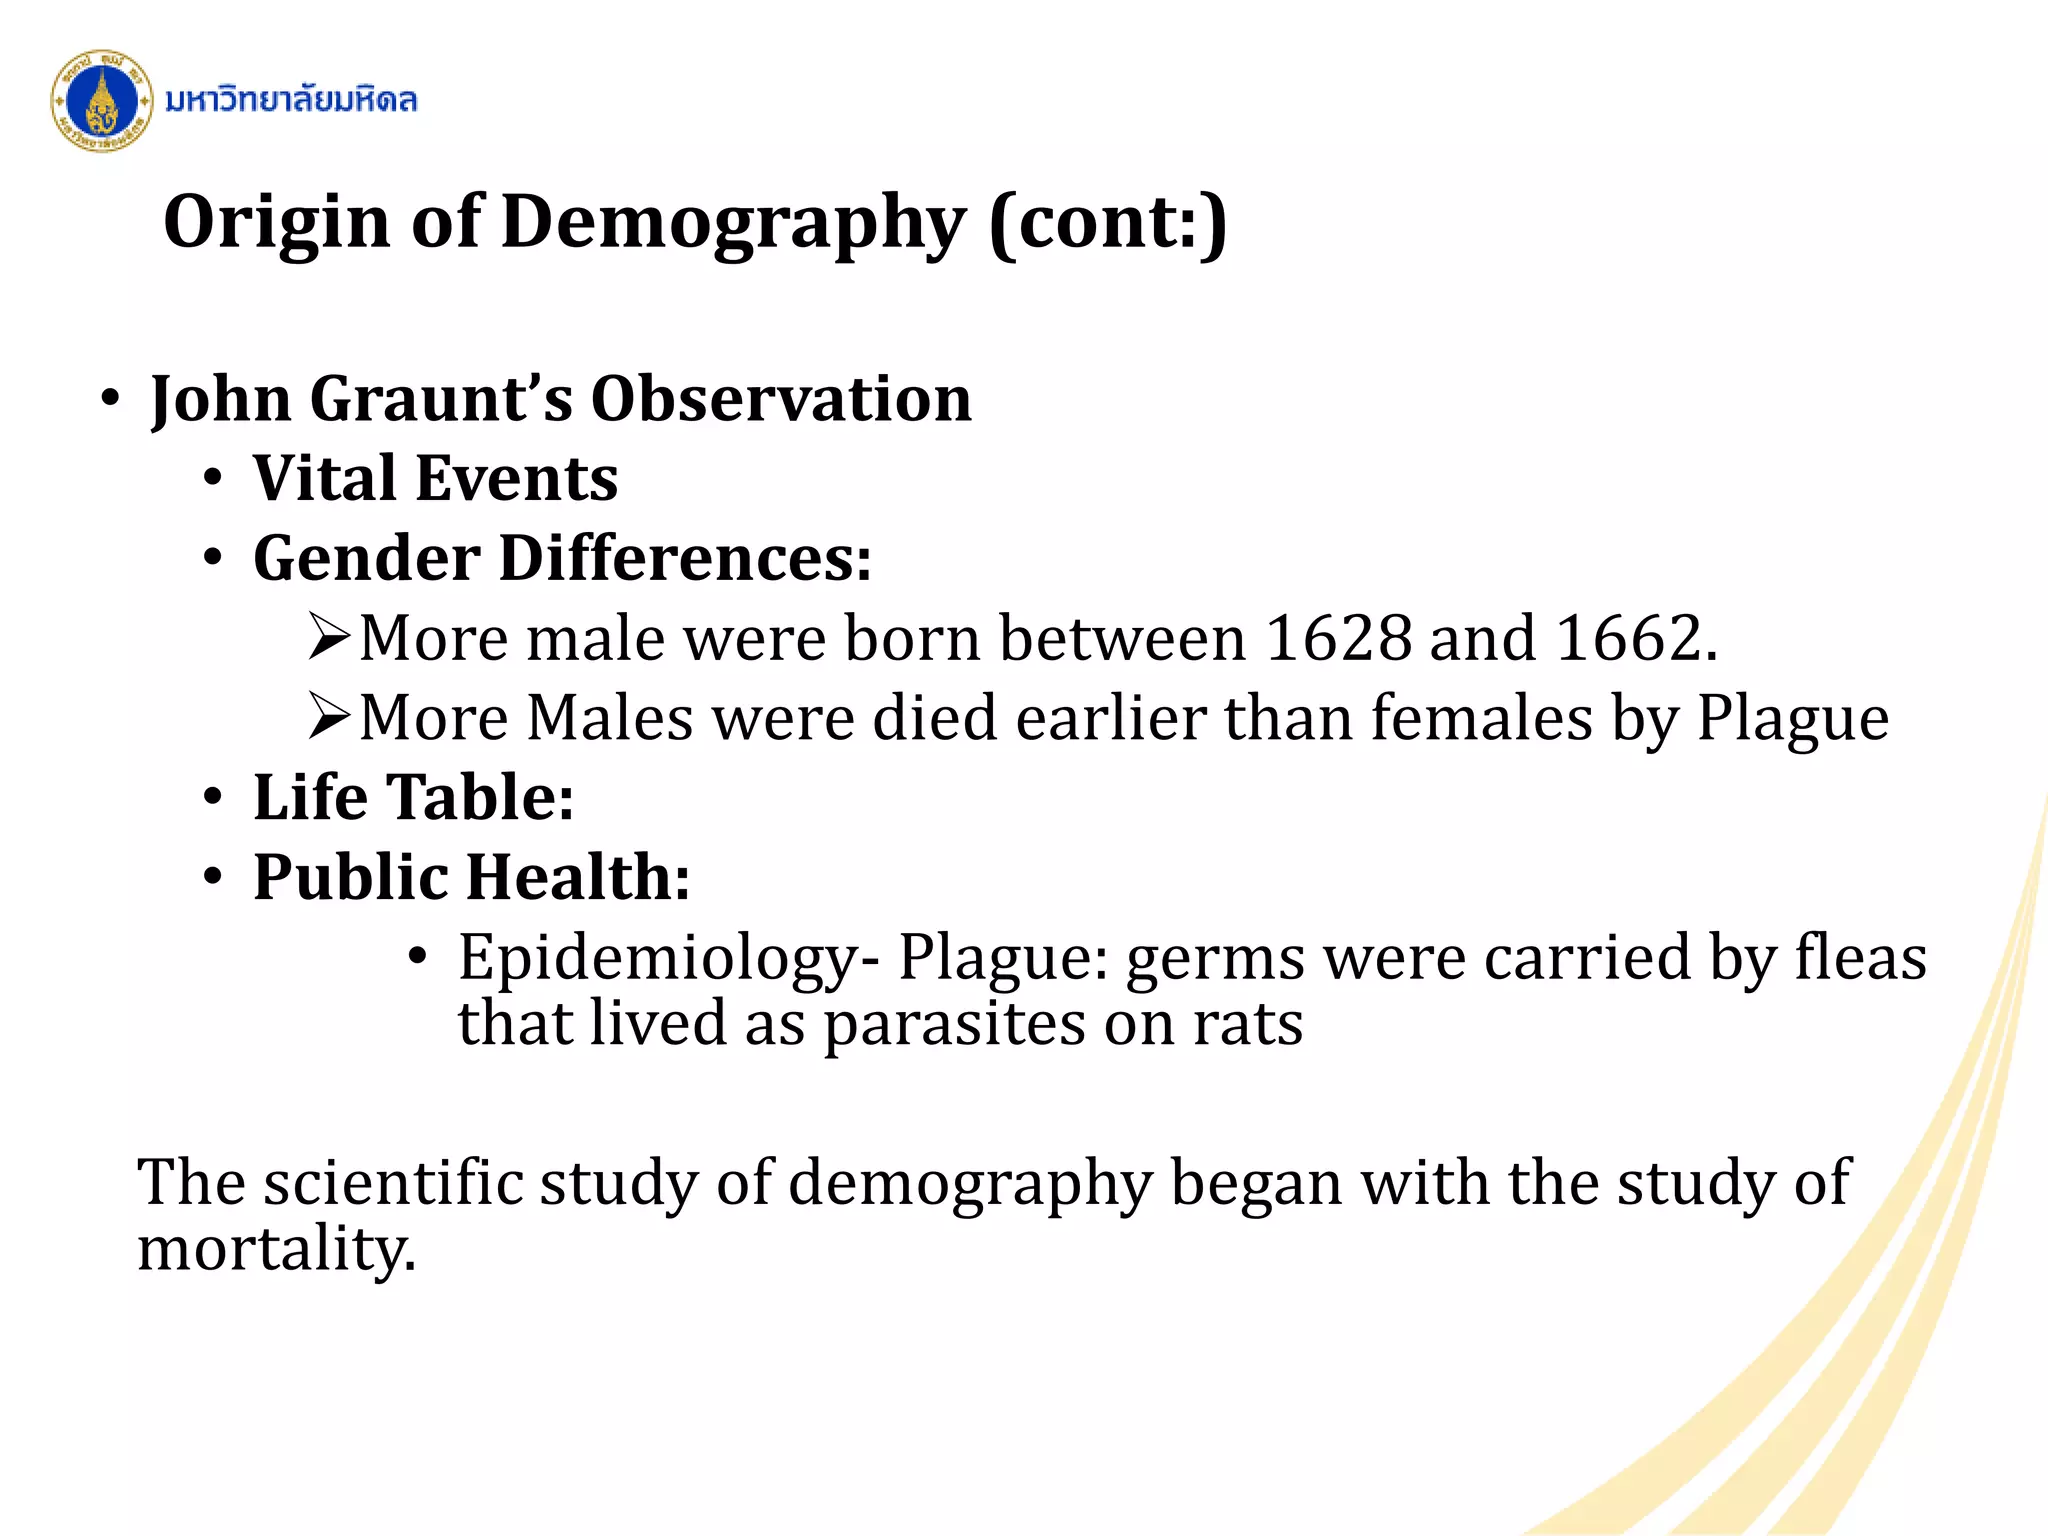
John Graunt's contributions to demography, focusing on mortality studies and vital events analysis.
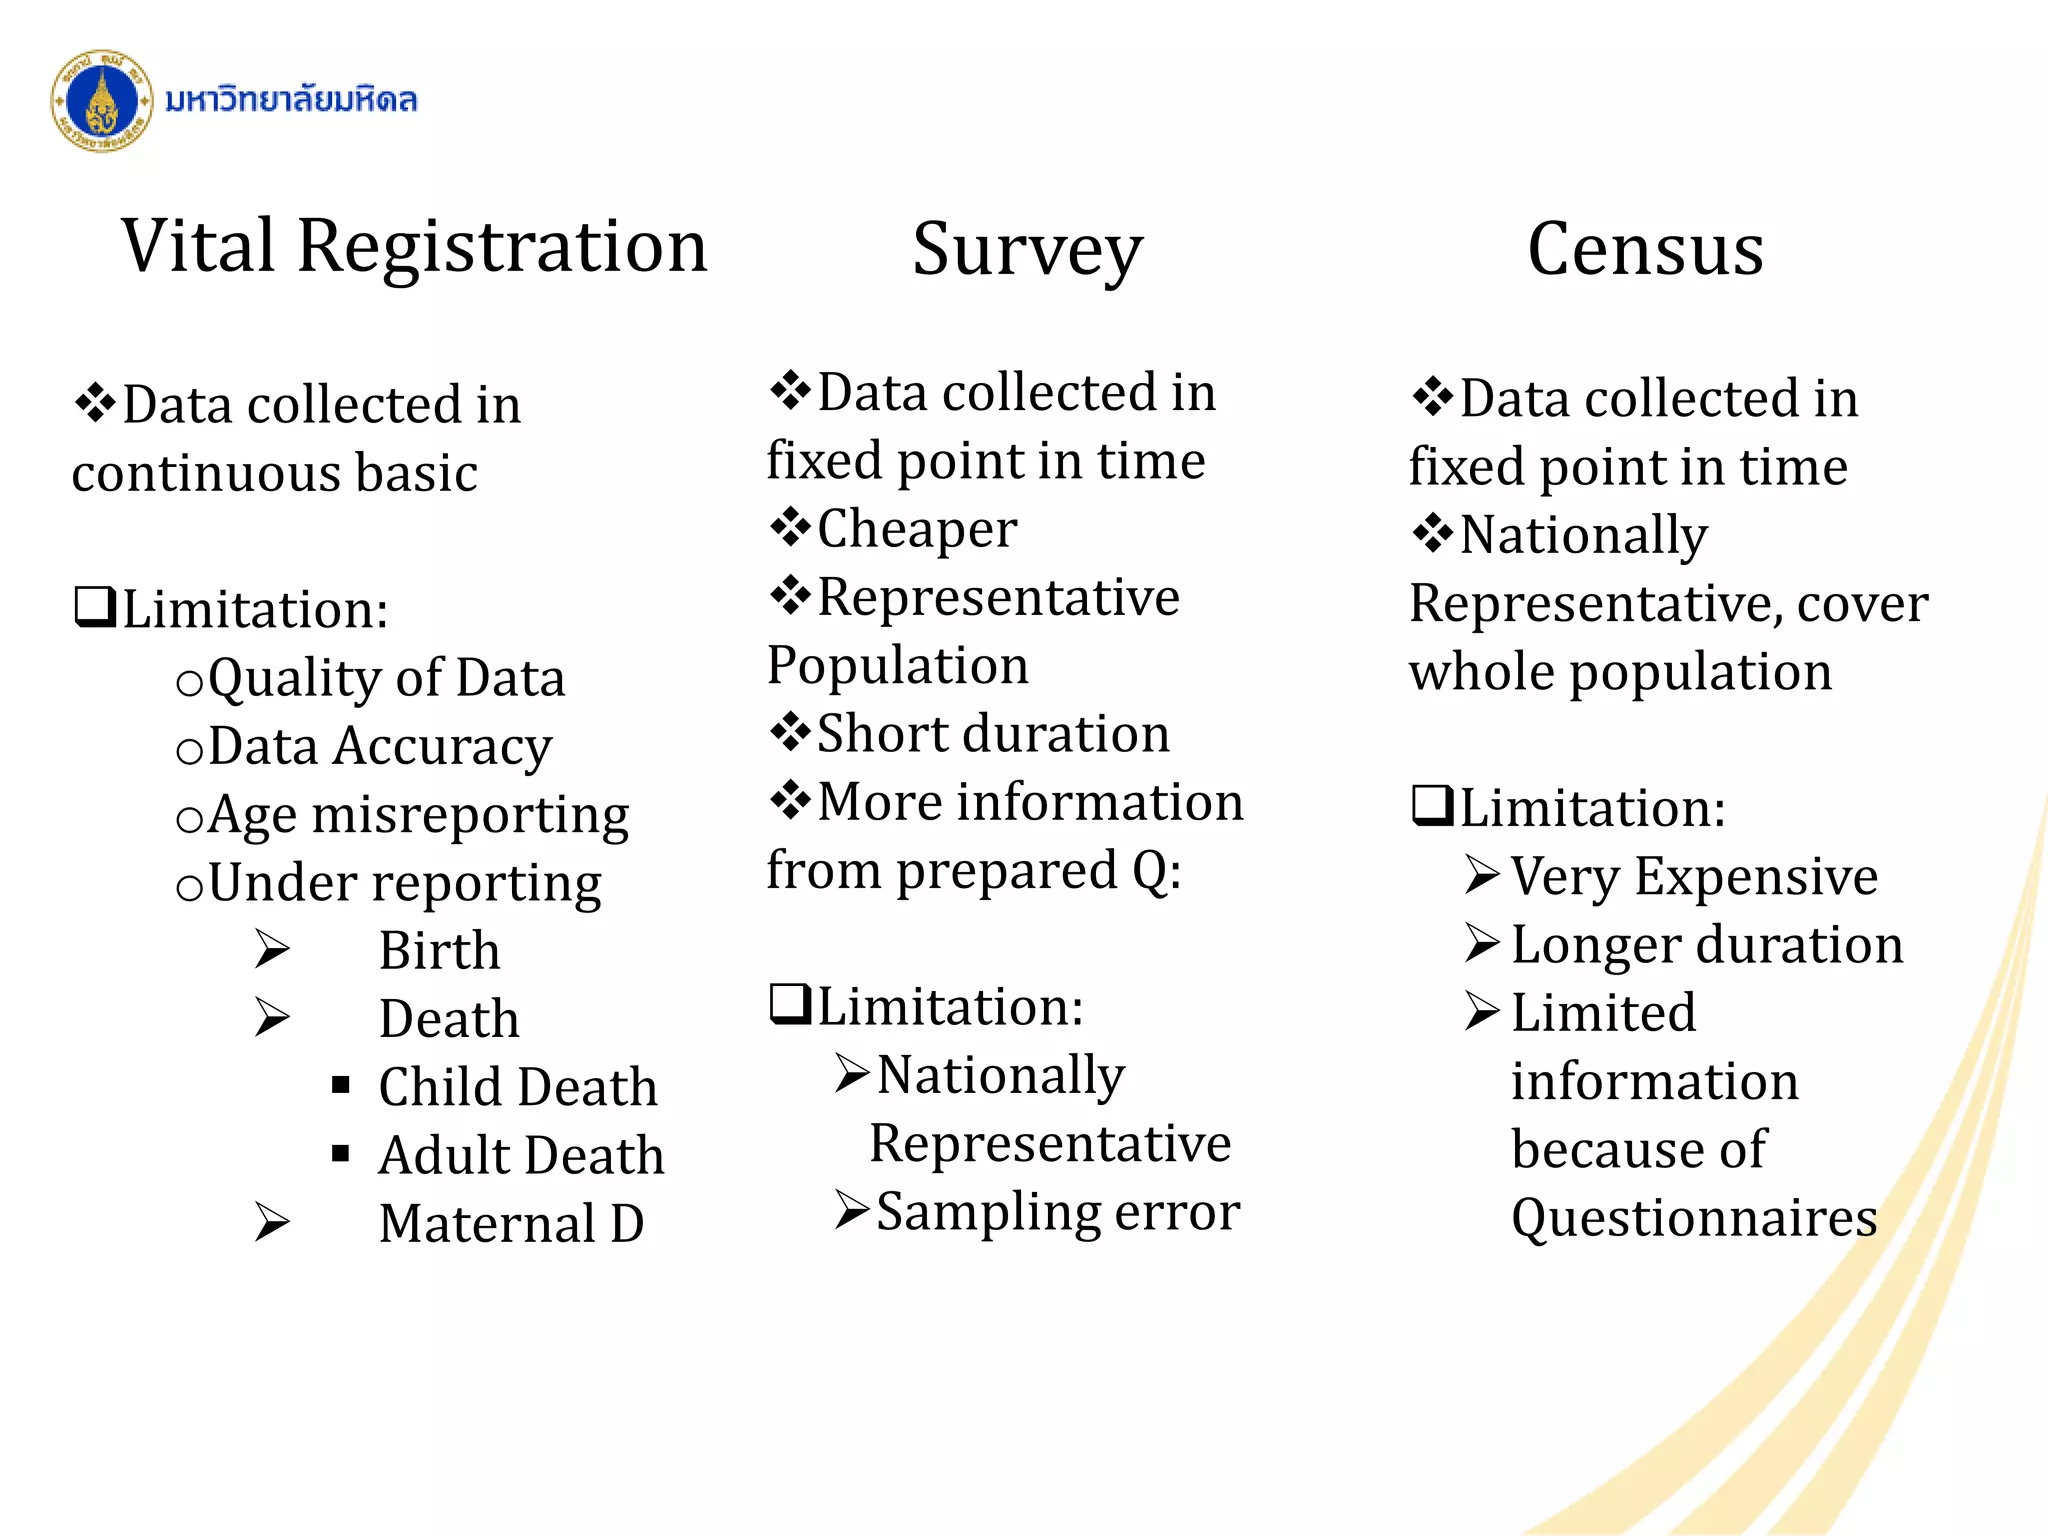
Main sources include vital registration, surveys, and census; discusses limitations and advantages.
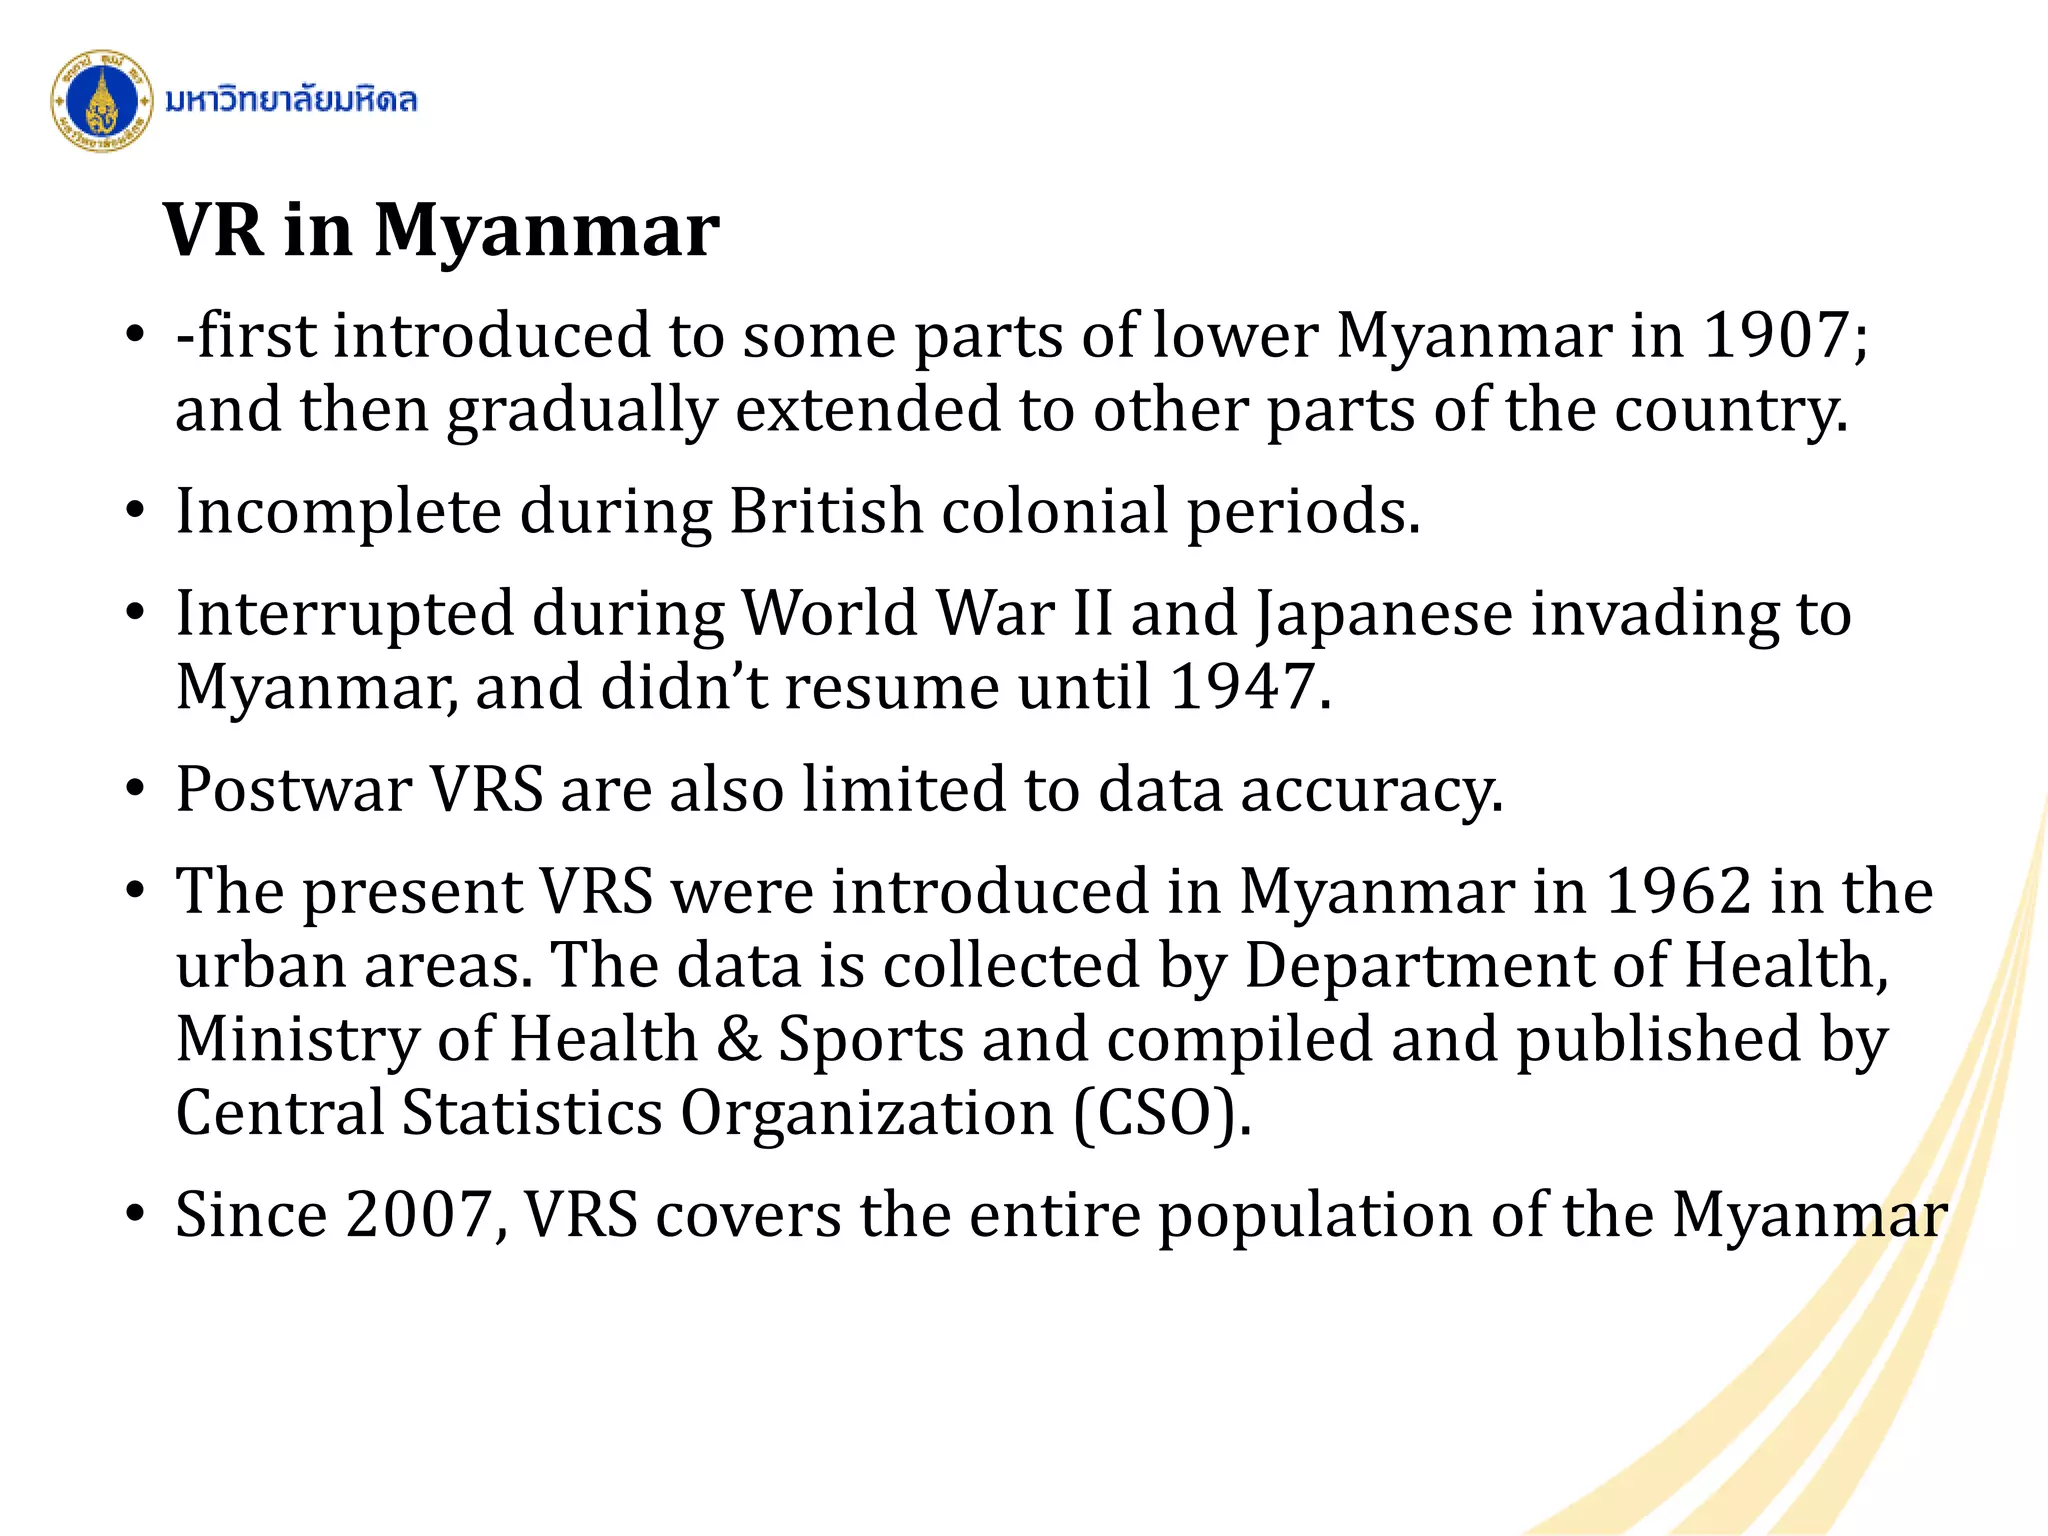
History and development of the vital registration system in Myanmar including challenges faced.
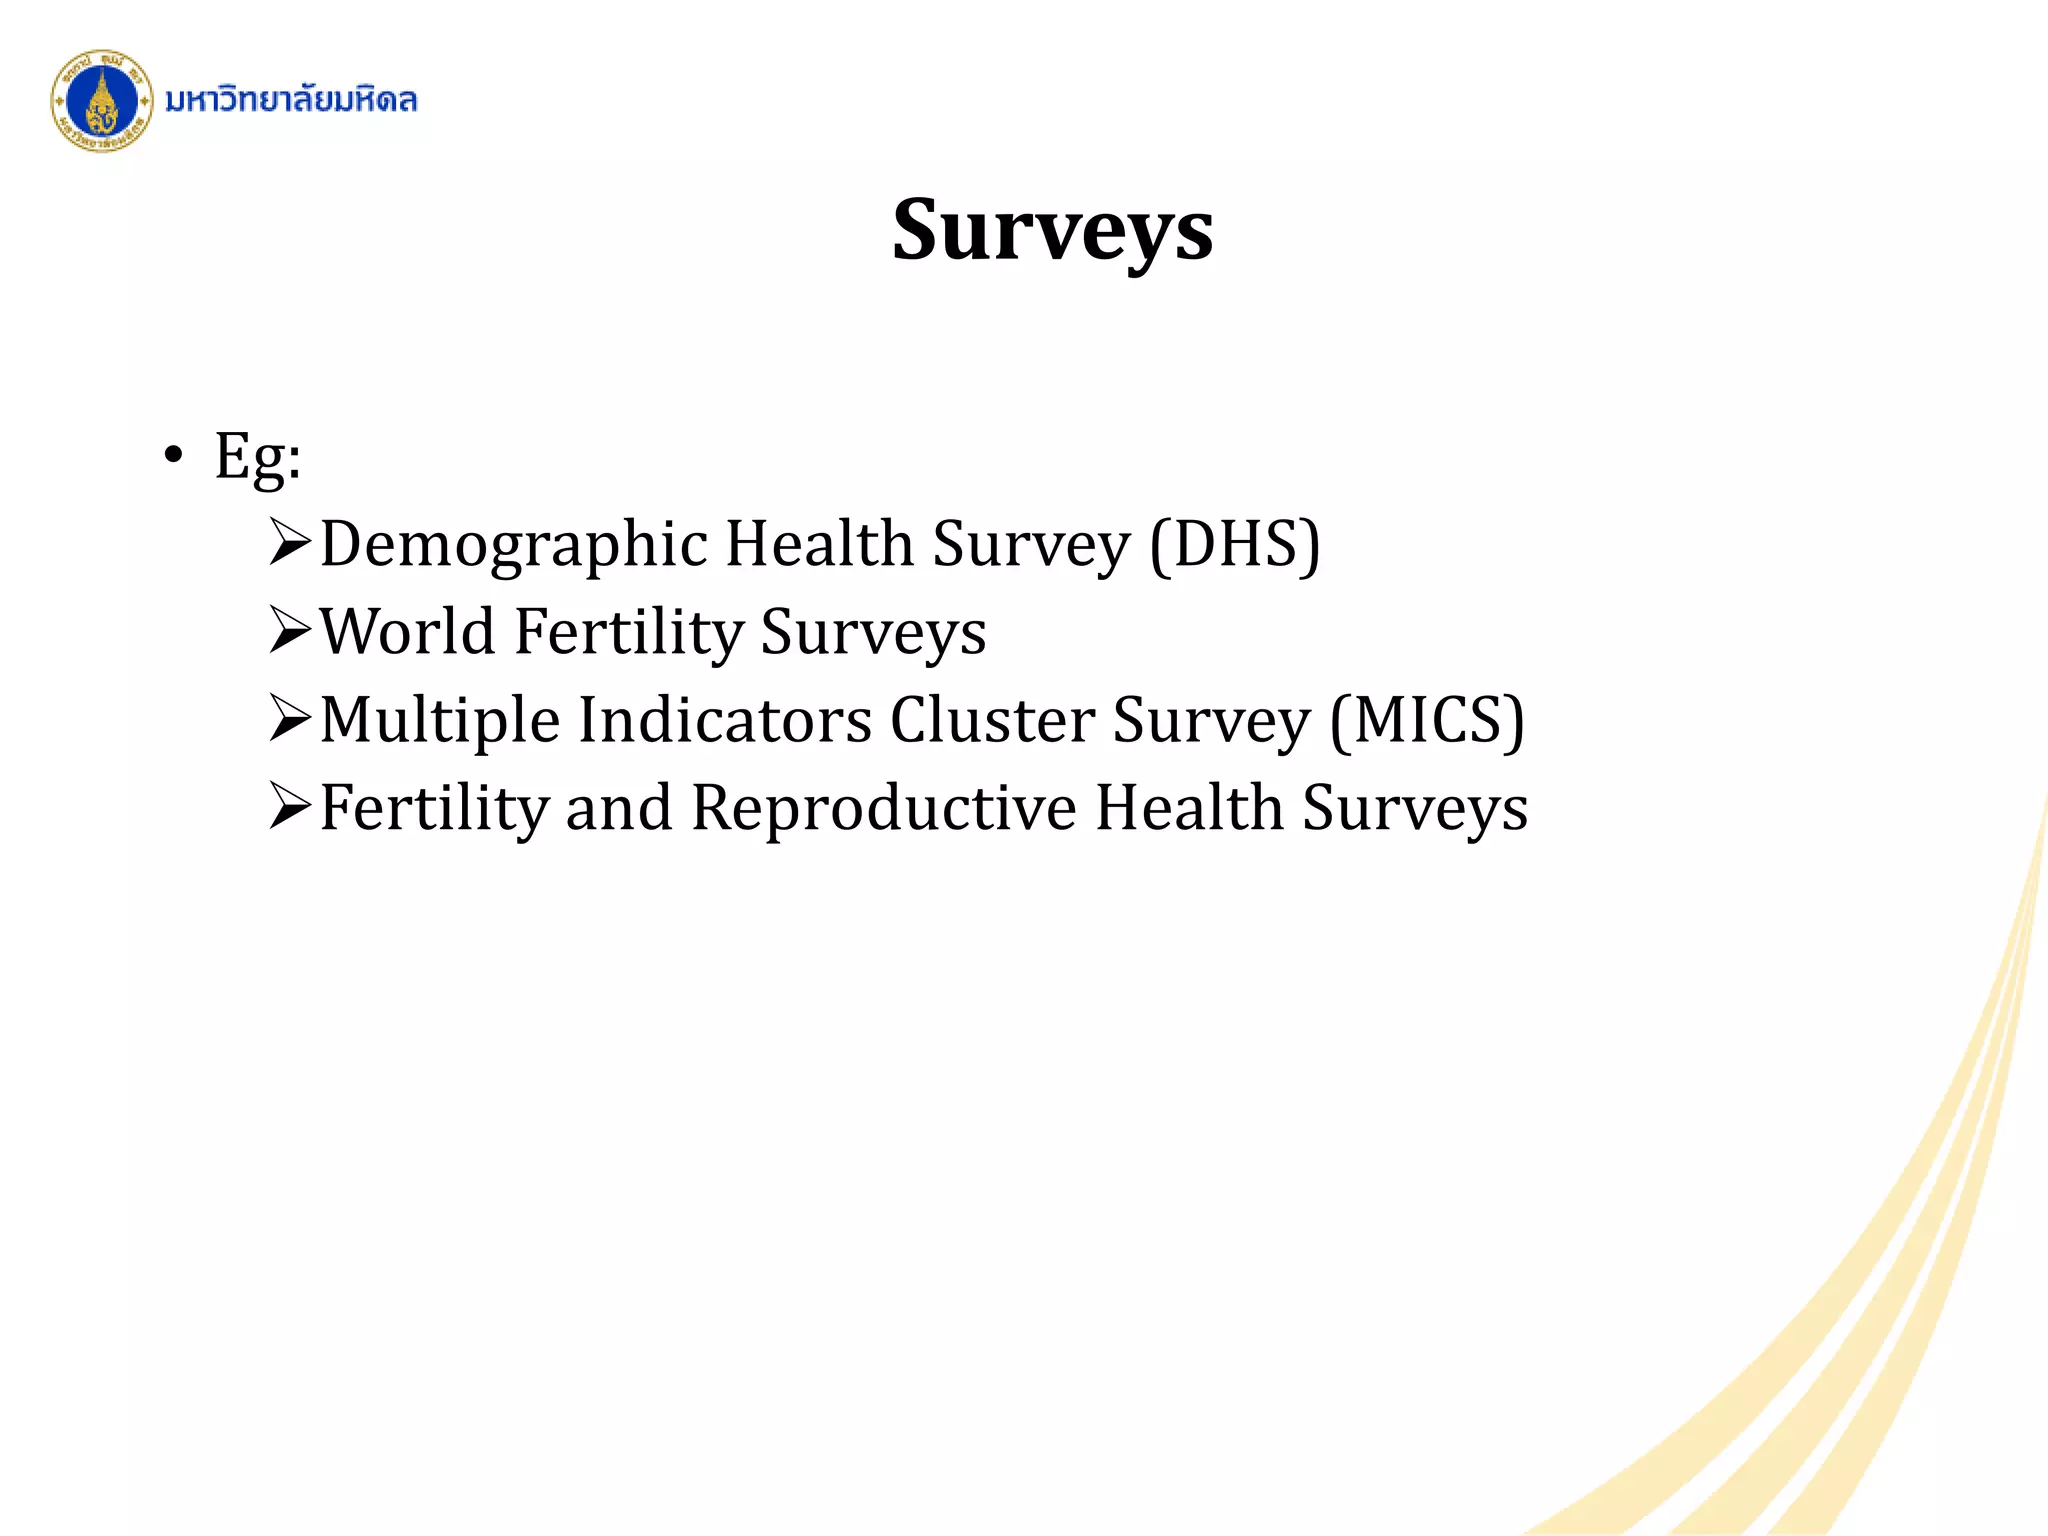
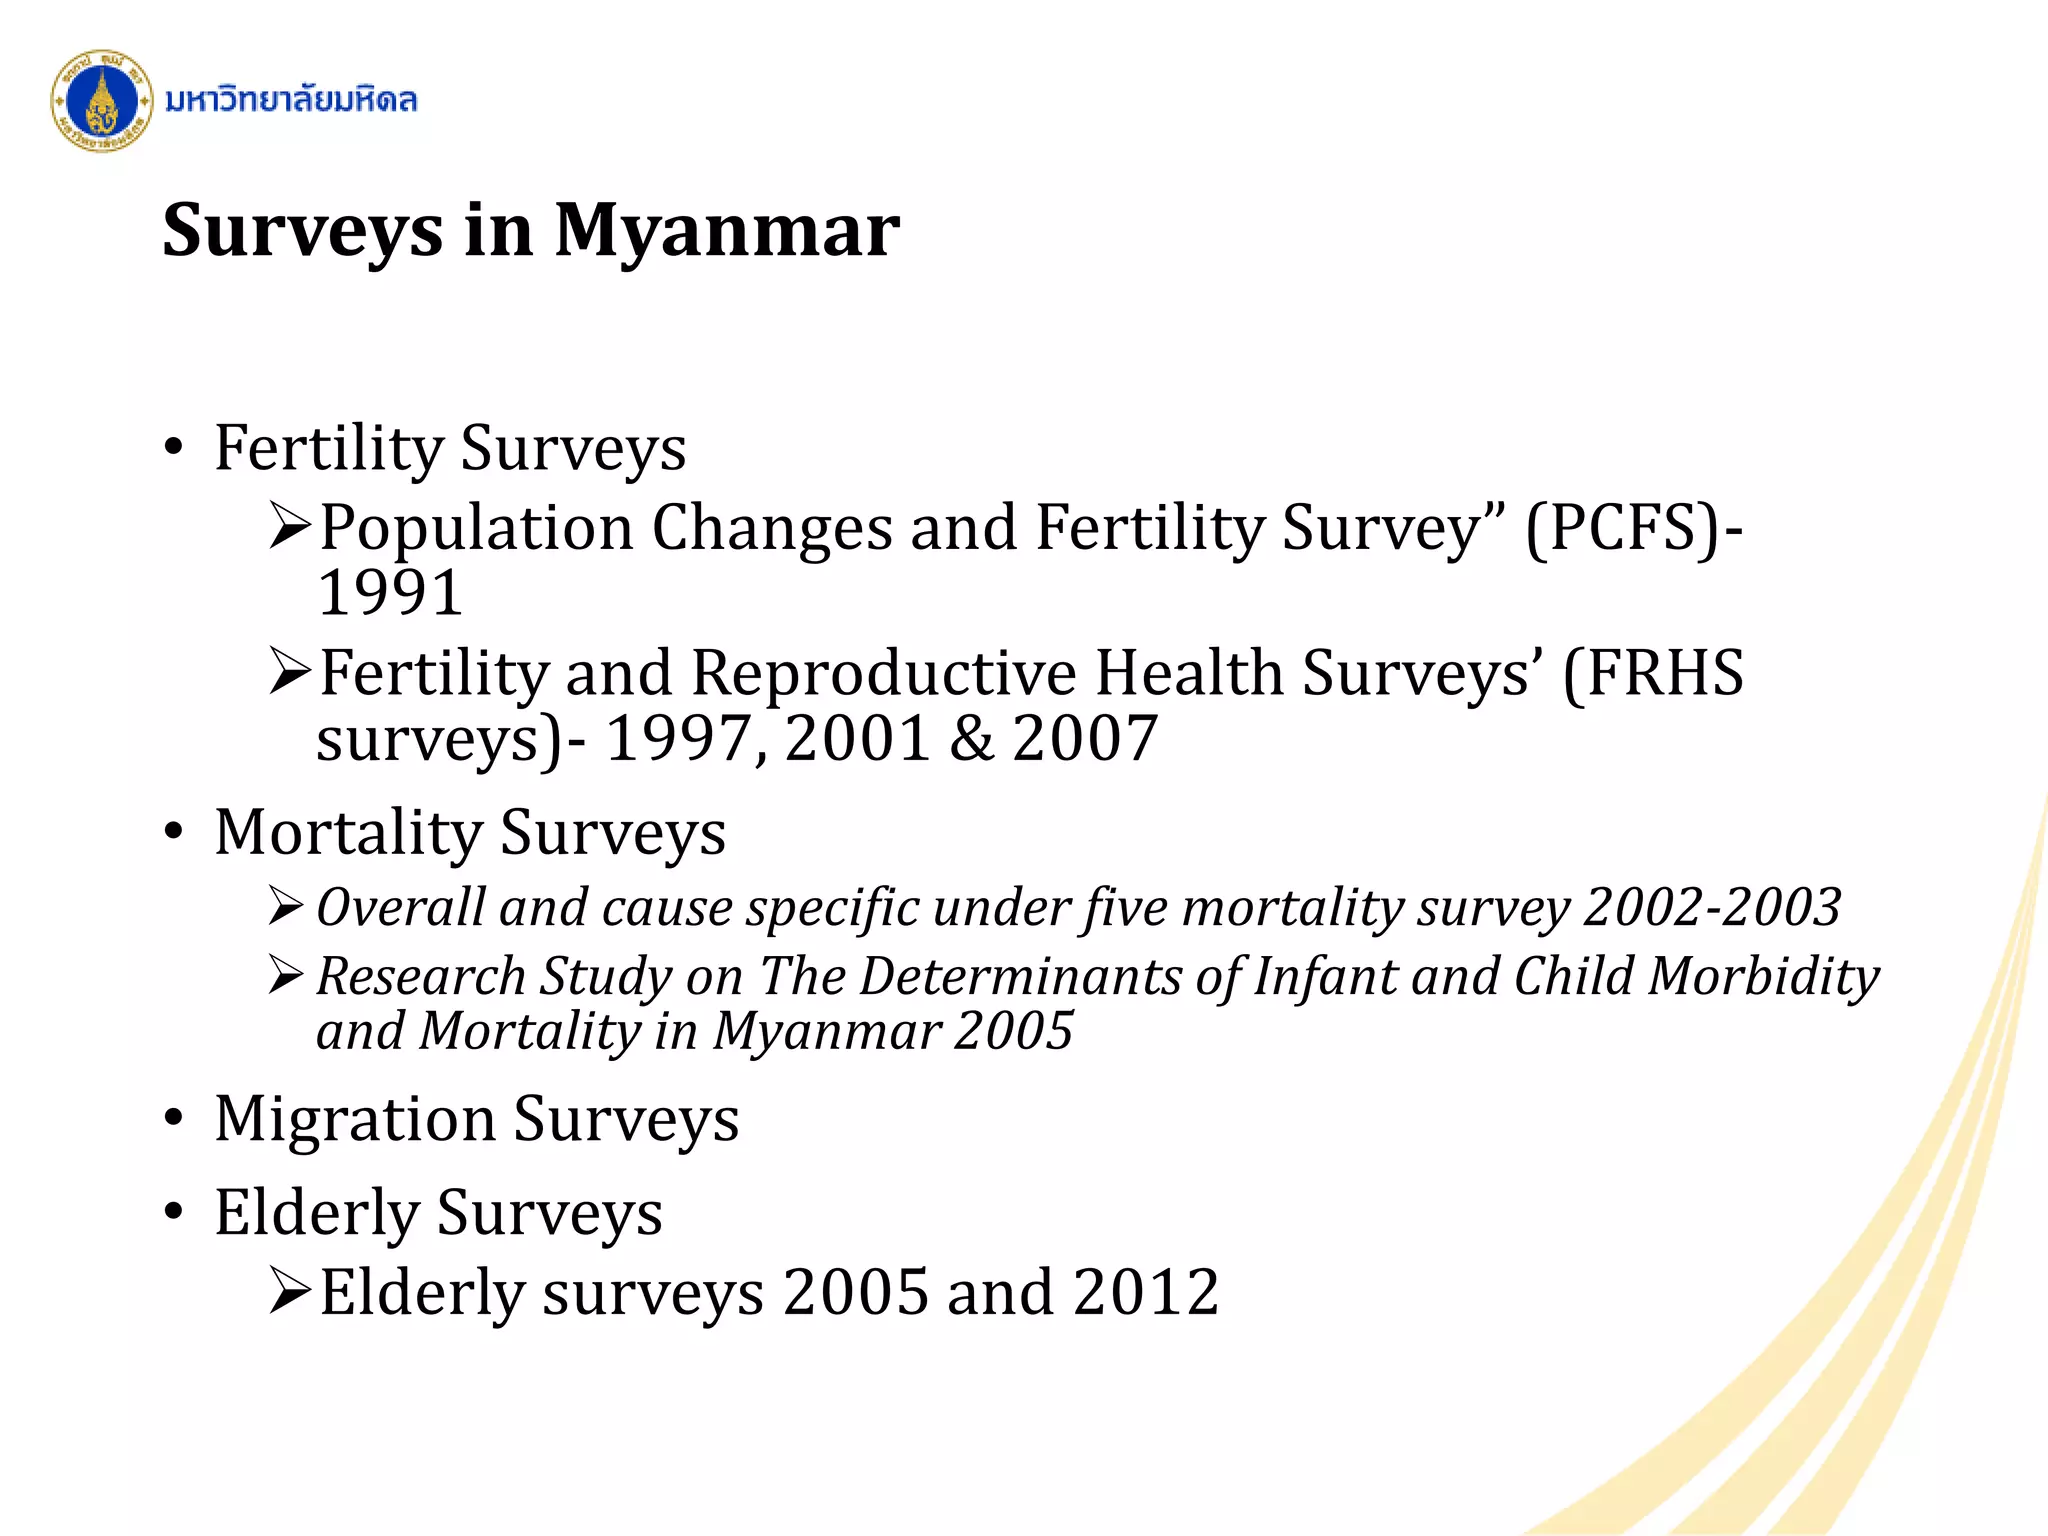
Different types of surveys conducted in Myanmar, targeting fertility, mortality, and migration.
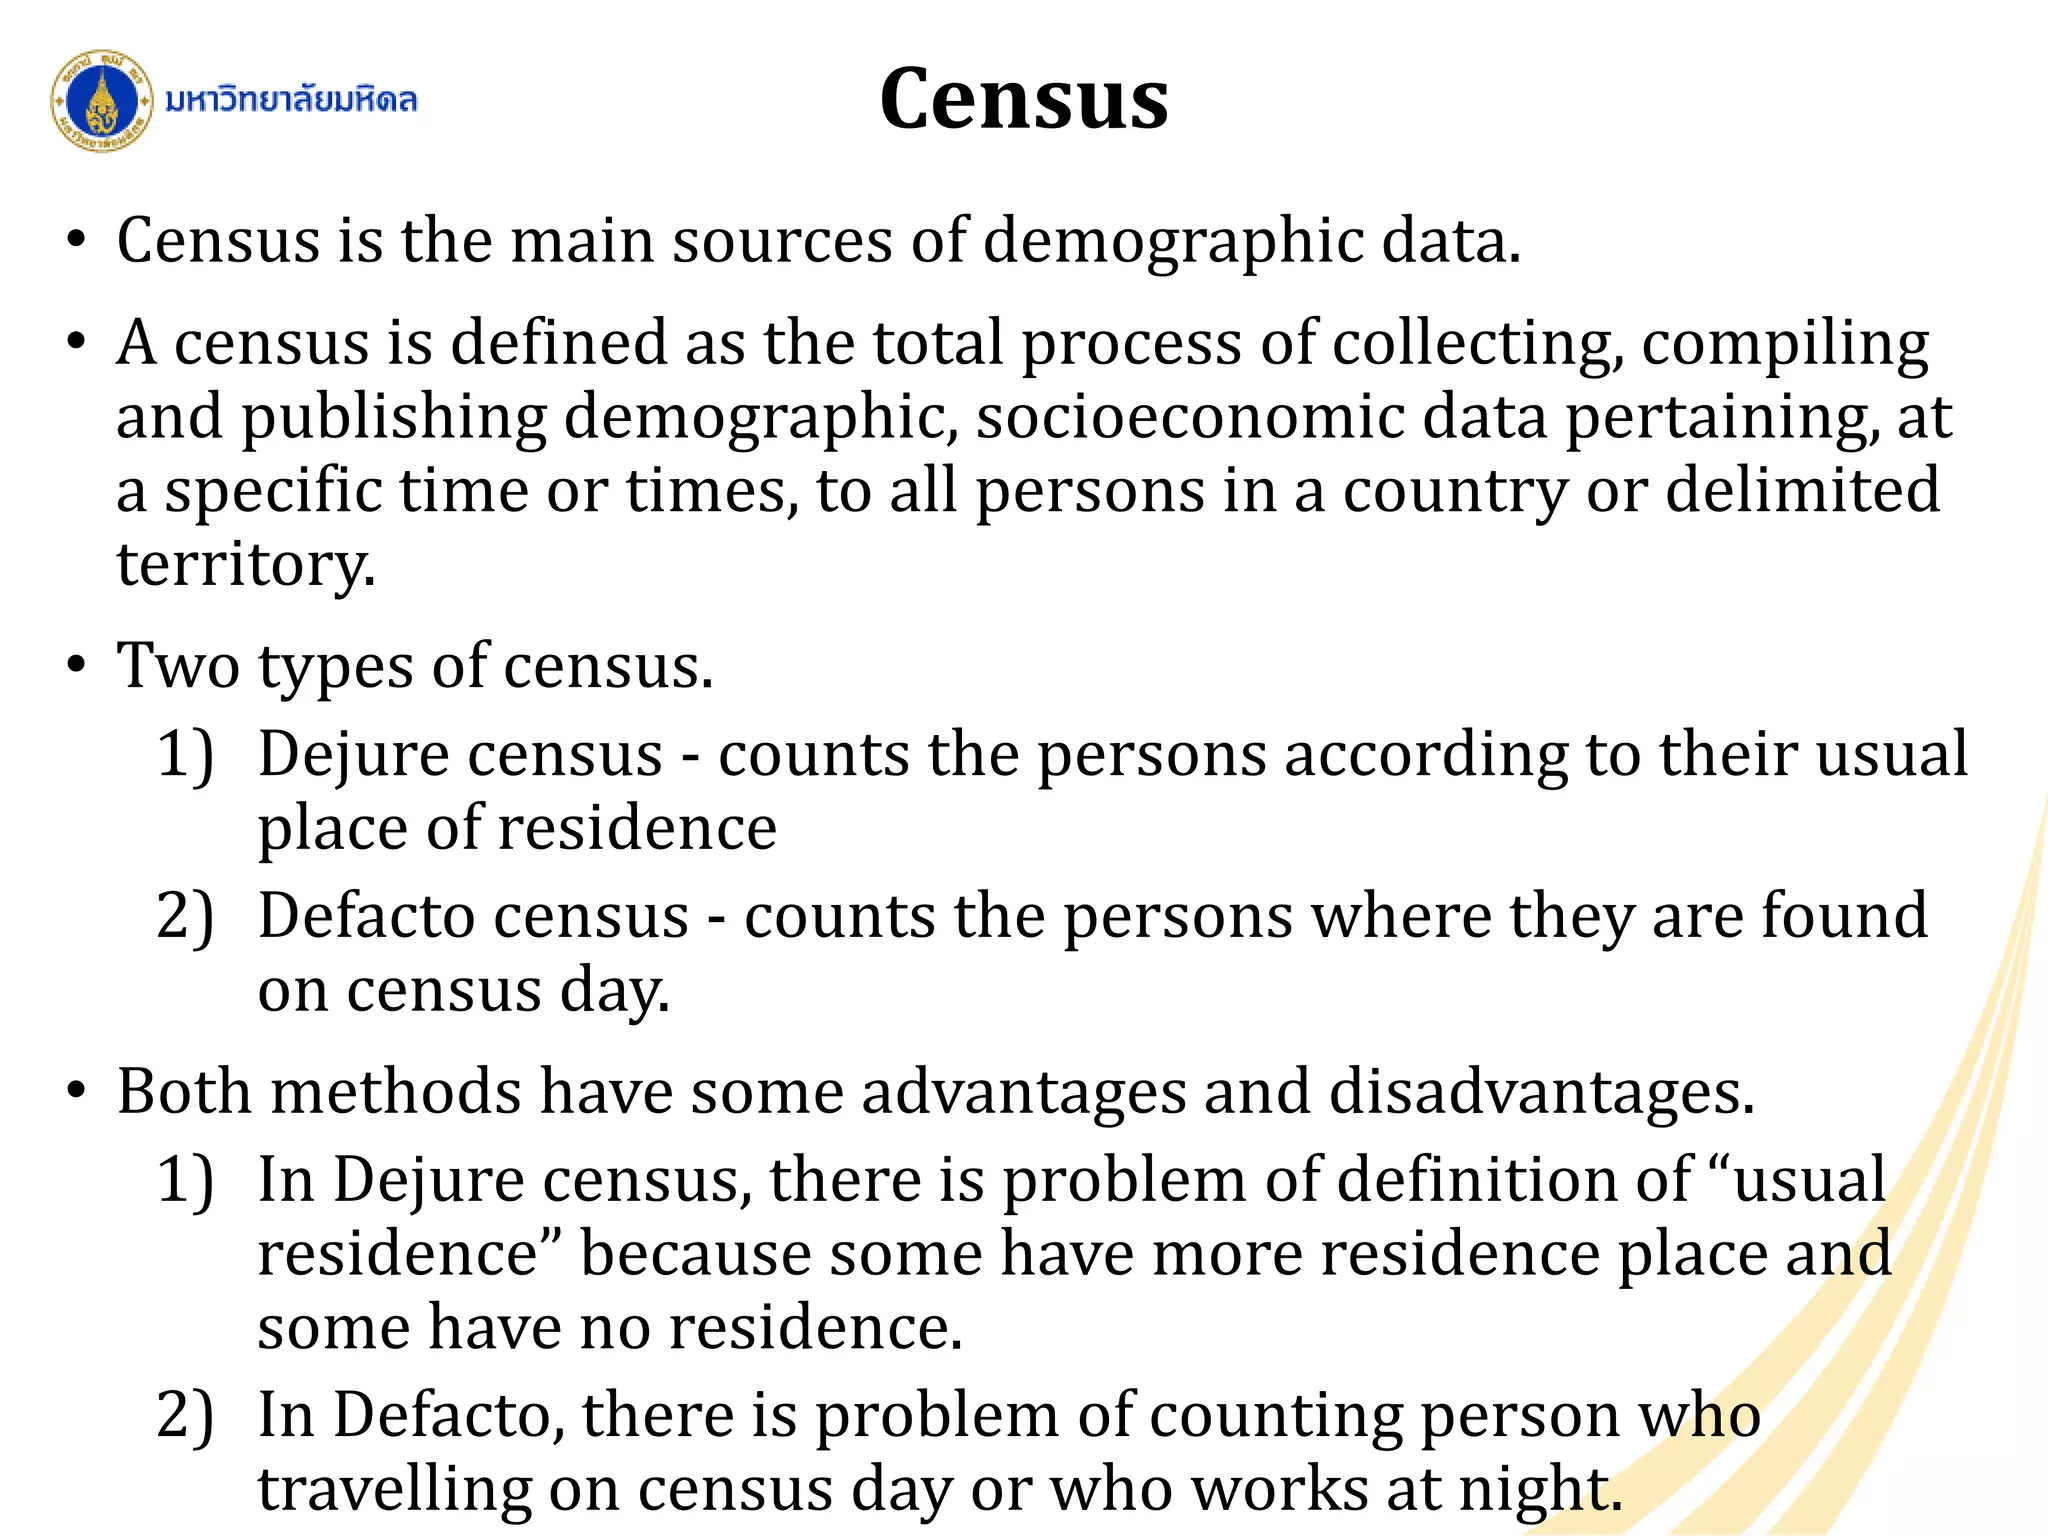
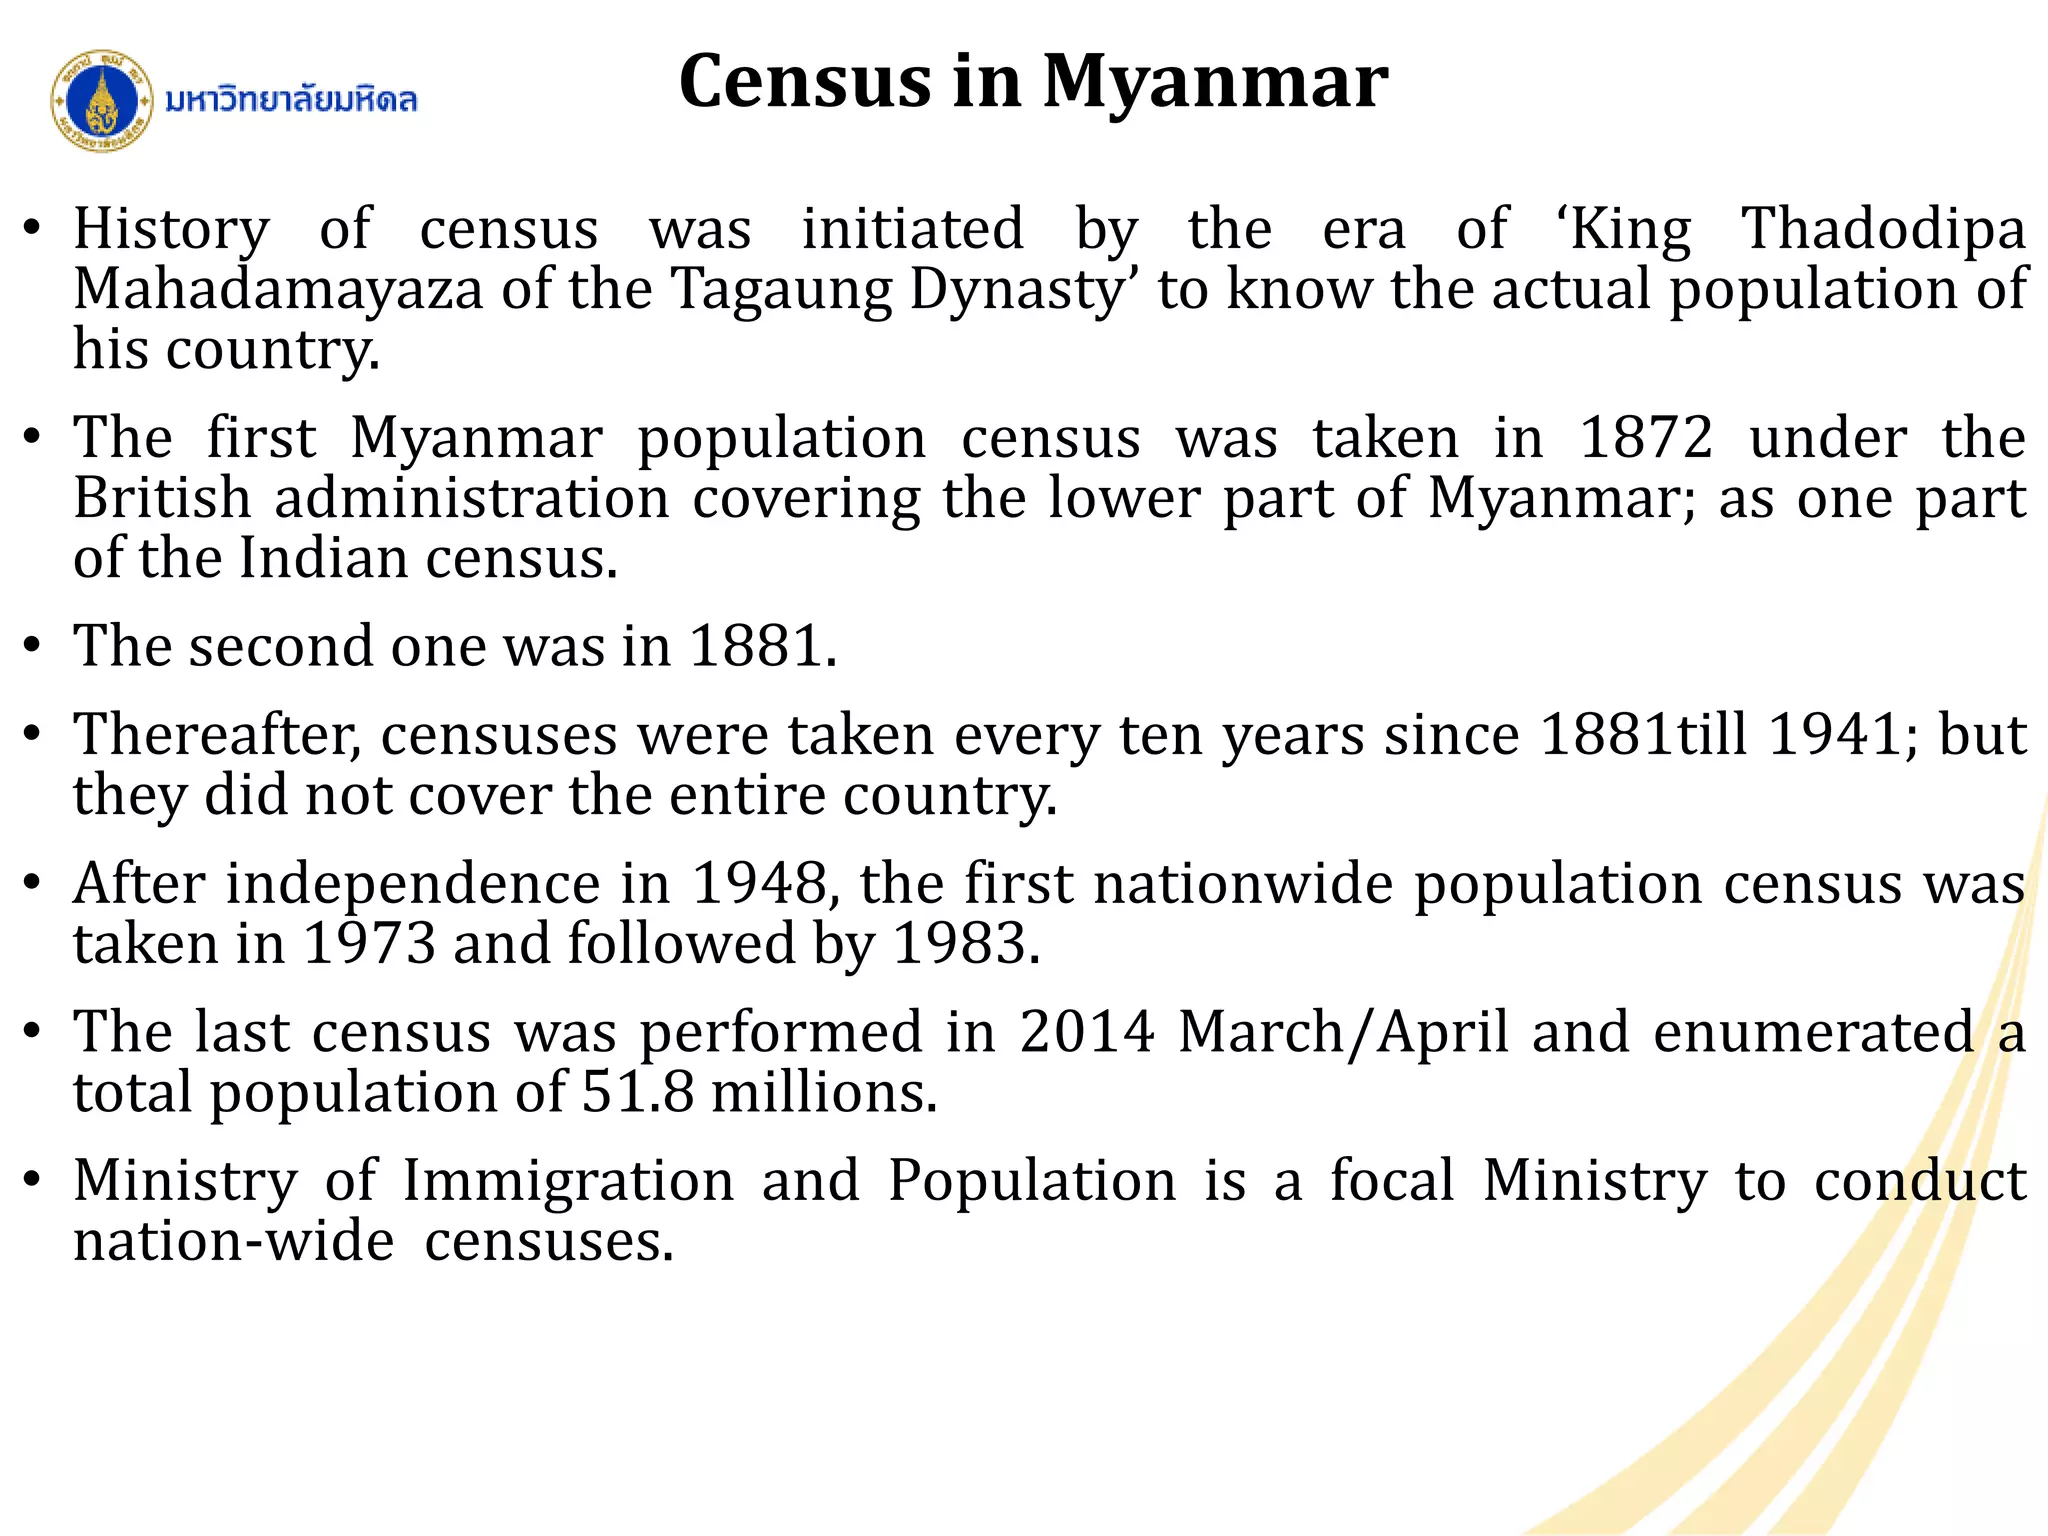
Defines census and its types; discusses historical census practices in Myanmar.
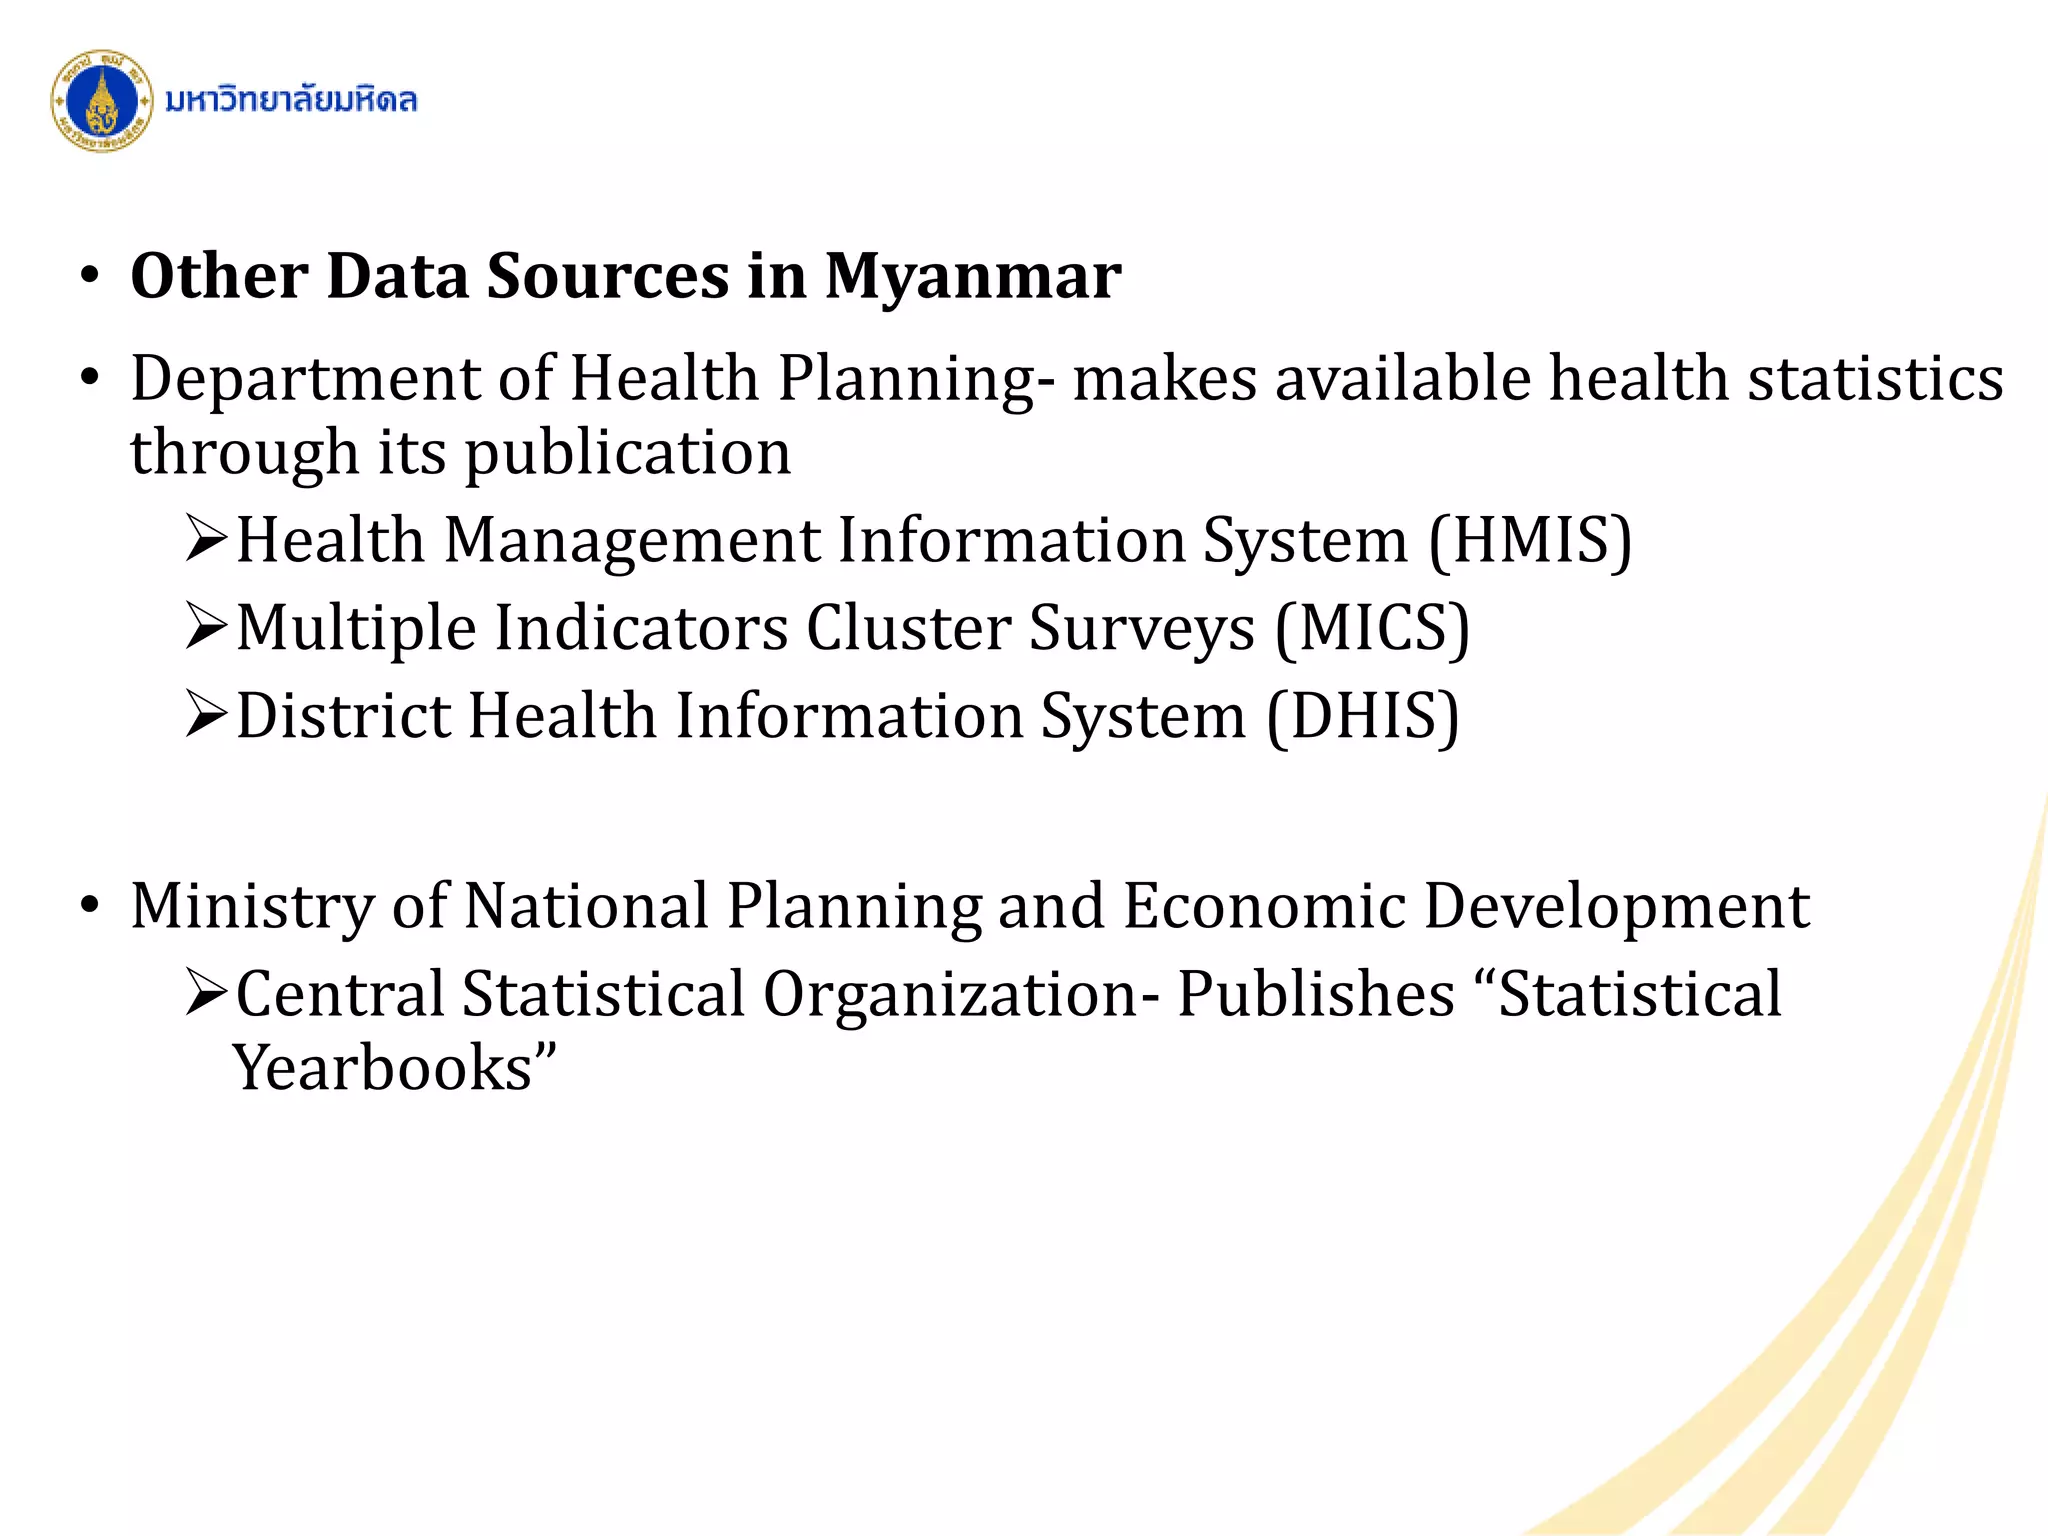
Other demographic data sources in Myanmar including health statistics and planning.
Applications and importance of demography for national development, policy planning, and social needs.
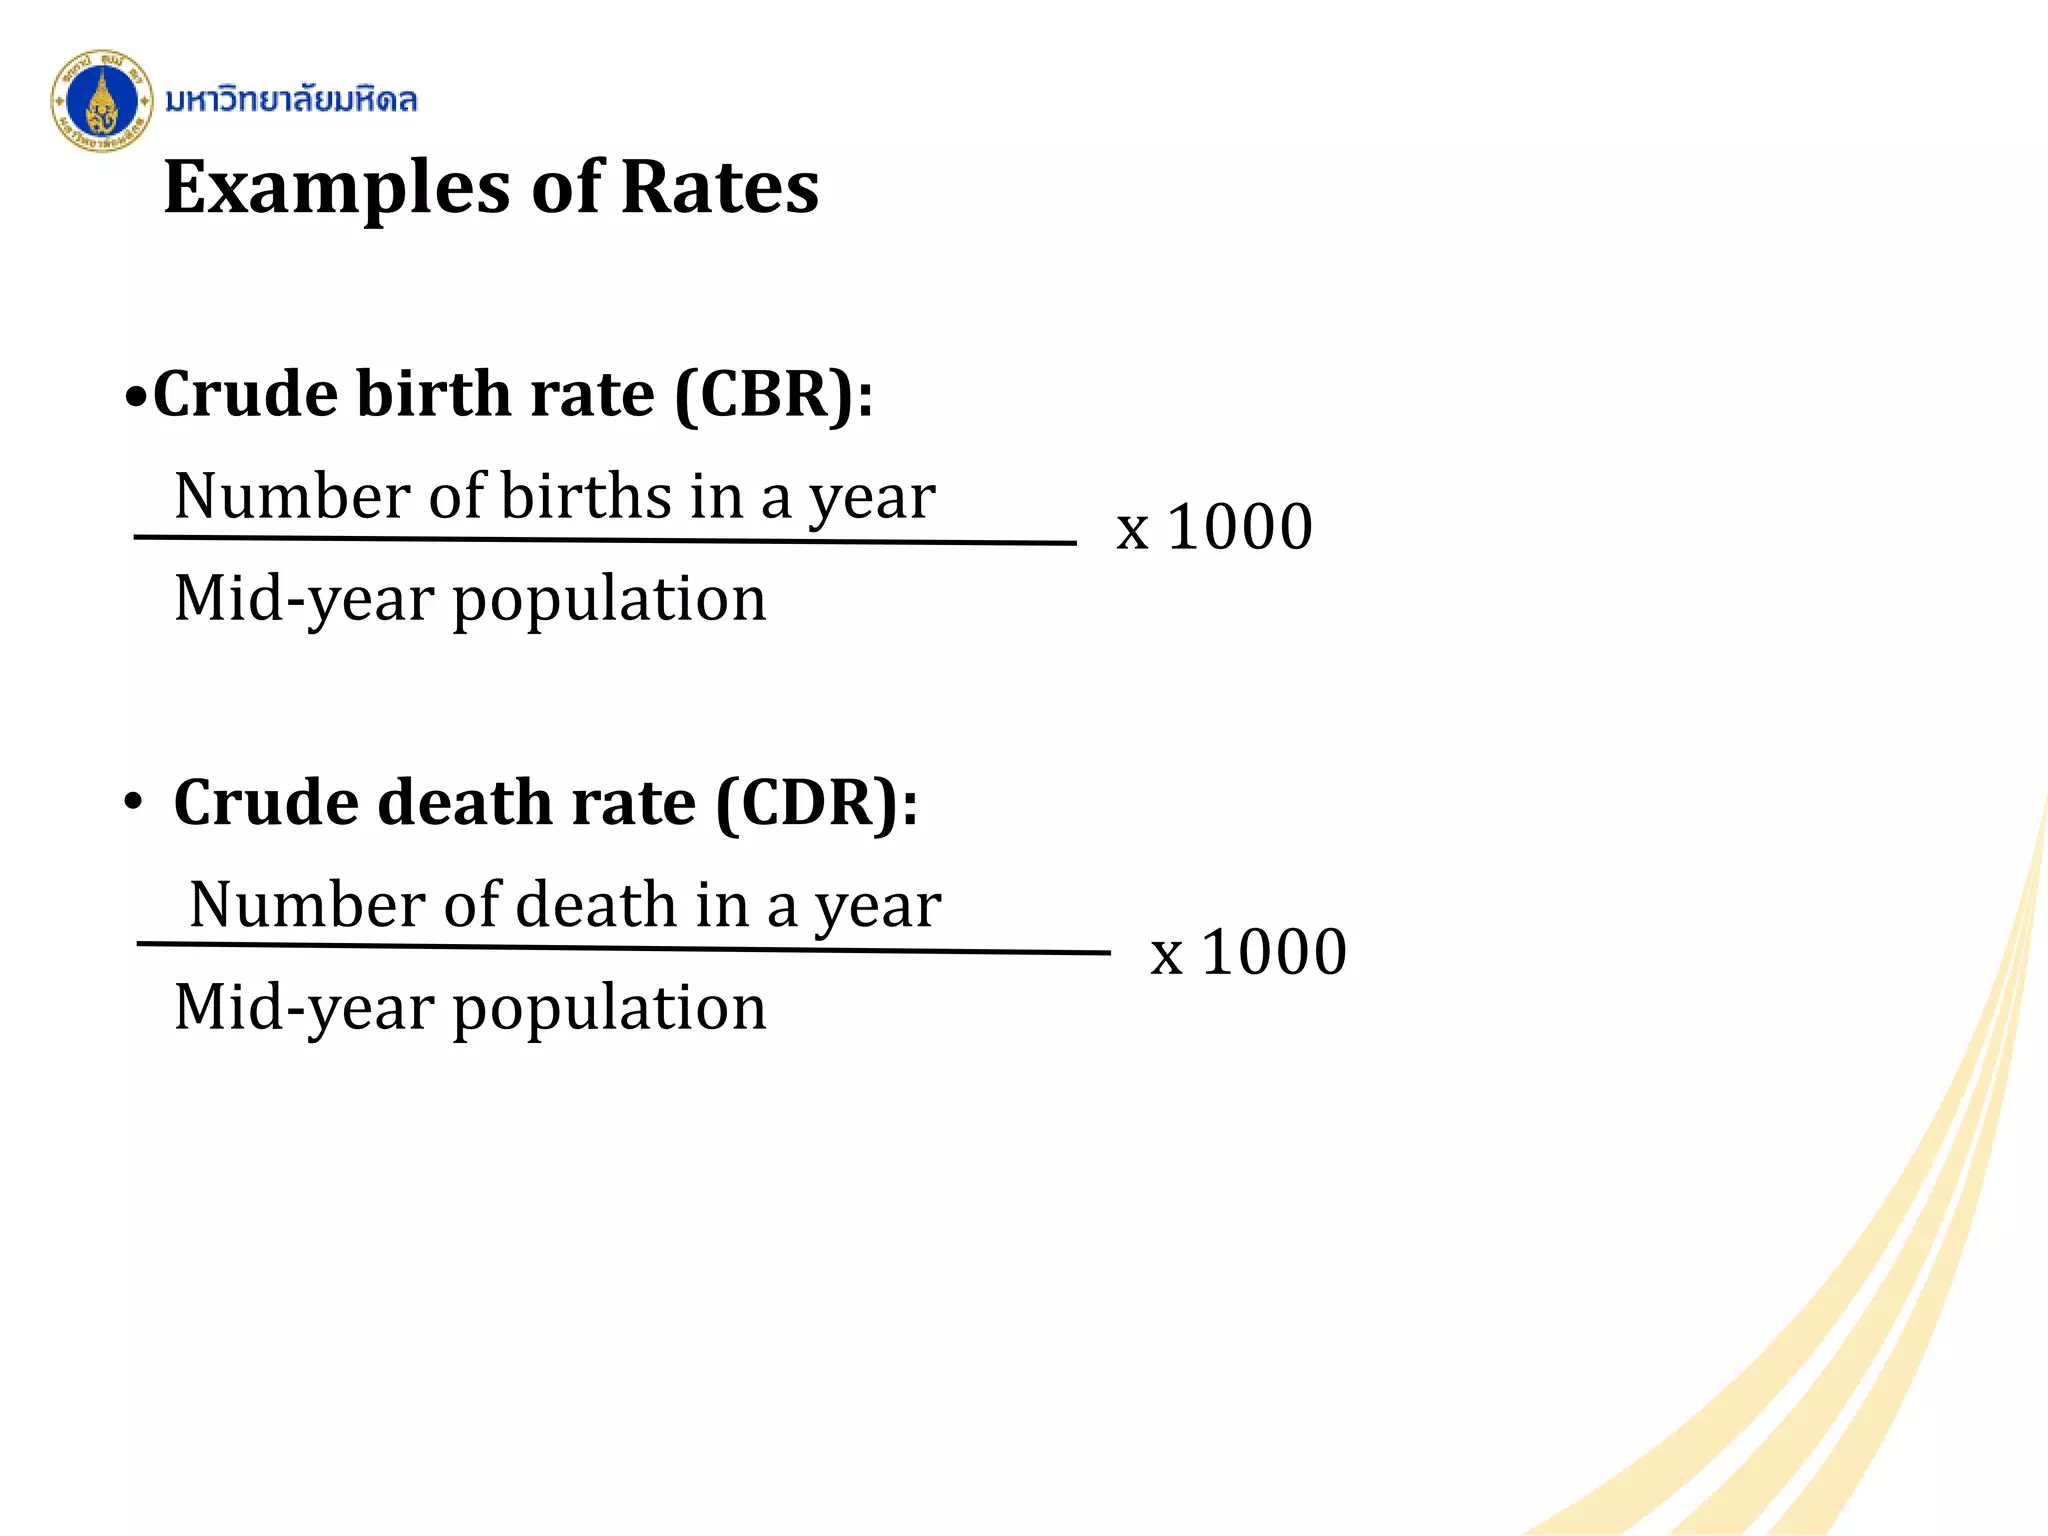
Fundamental measurements such as fertility, mortality, and migration statistics.
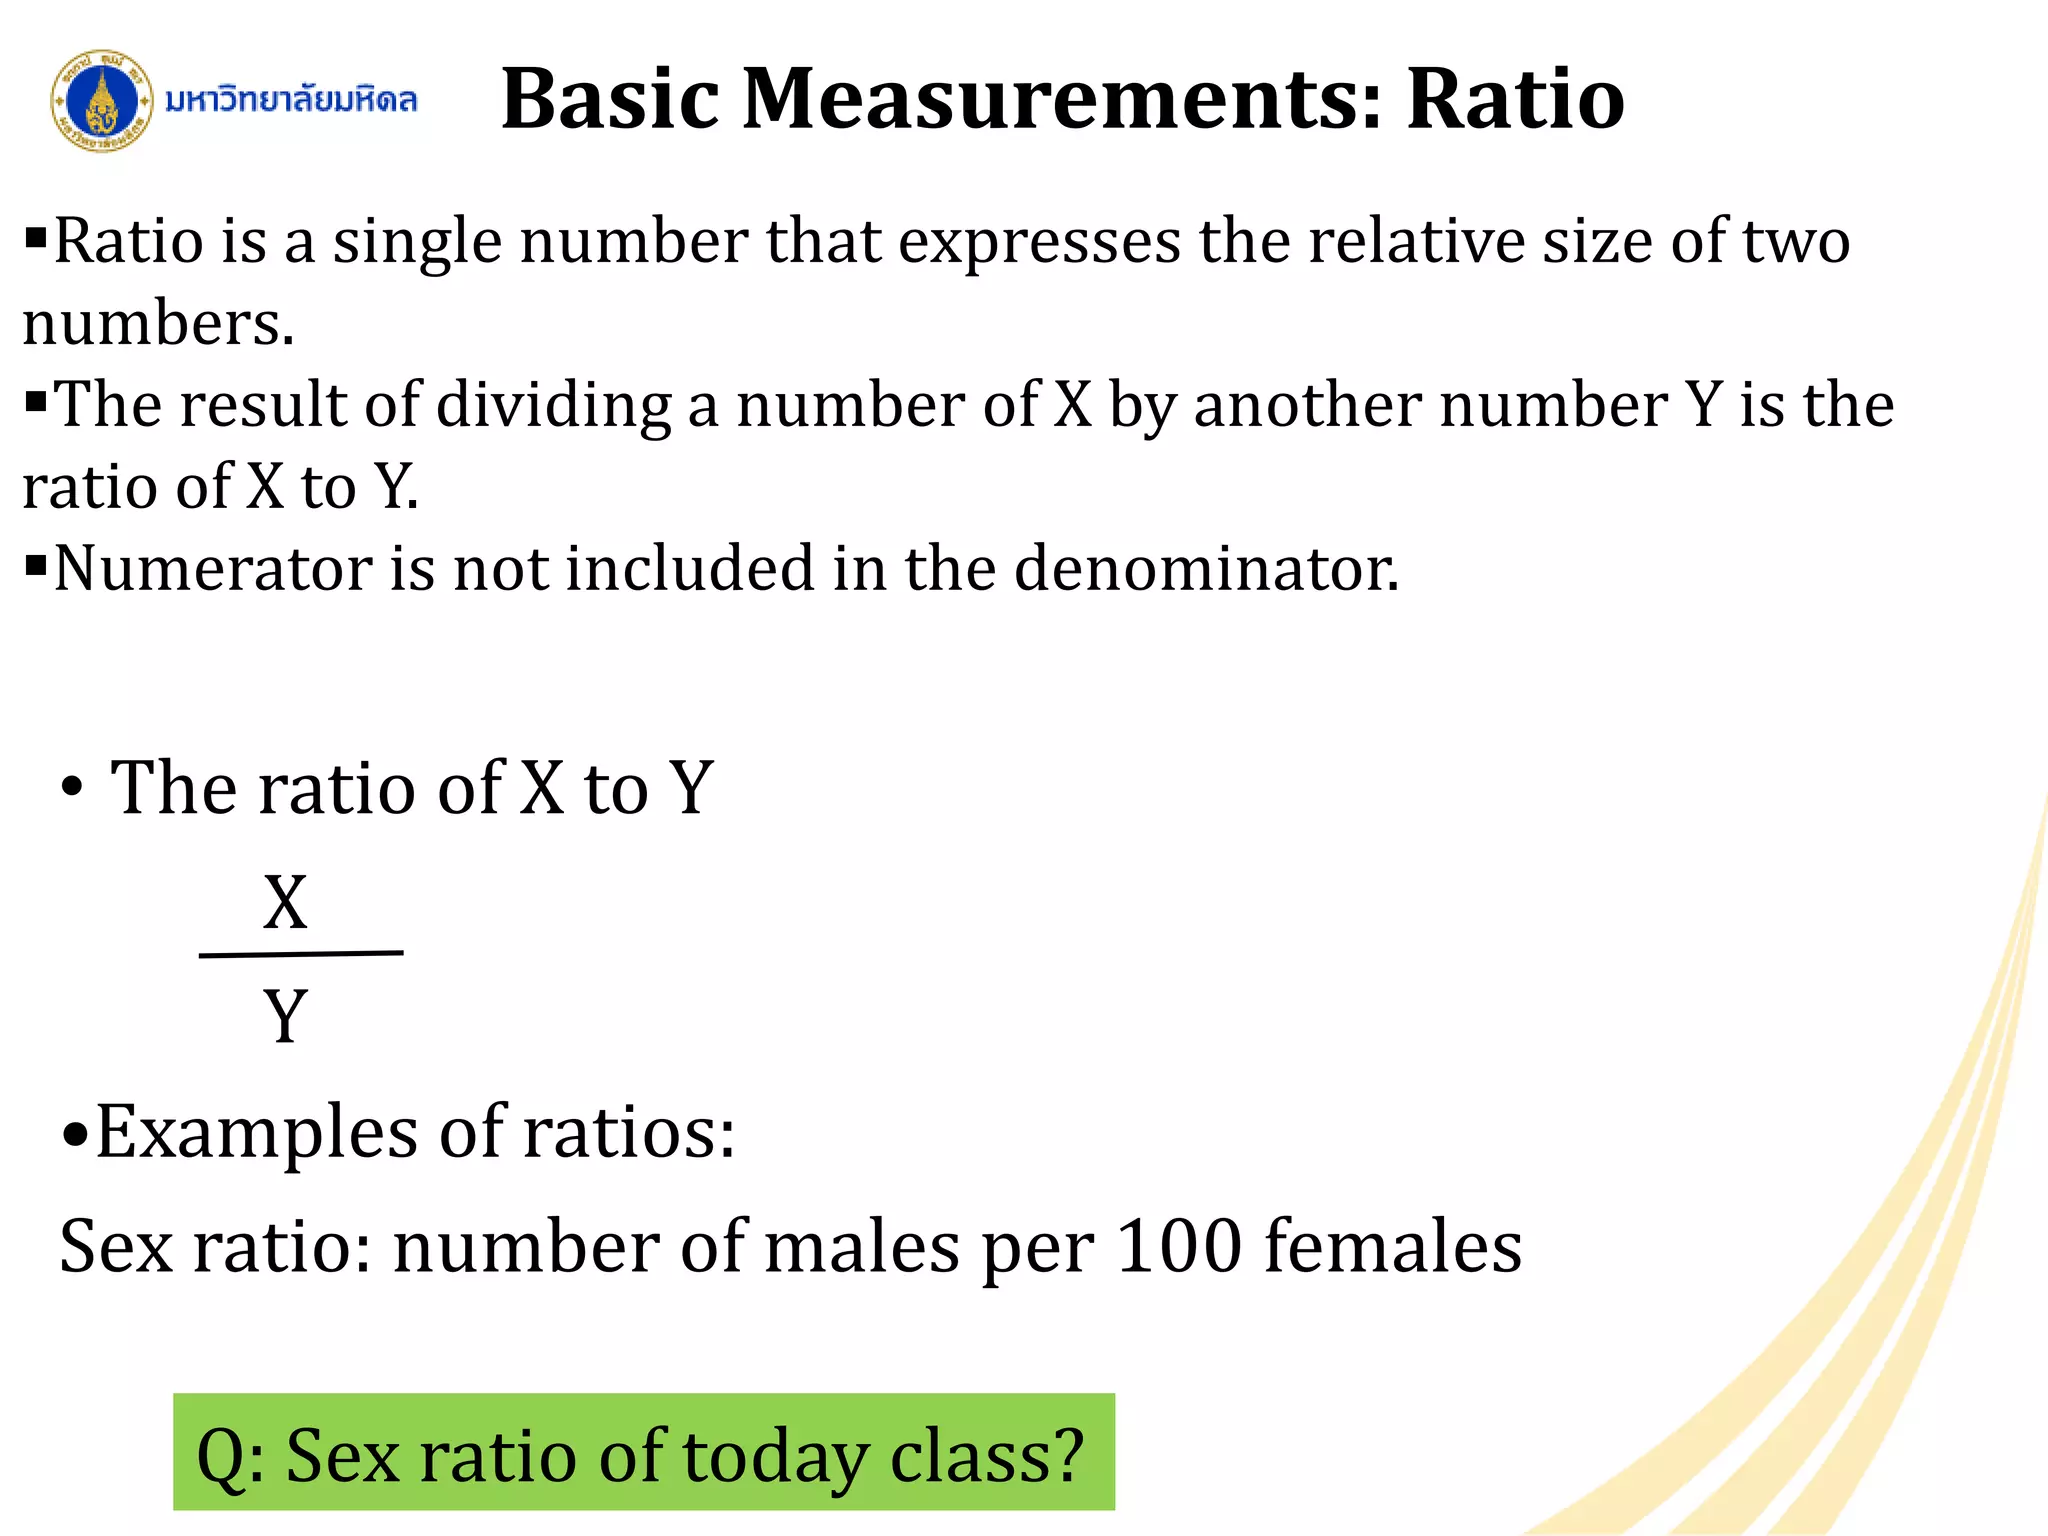
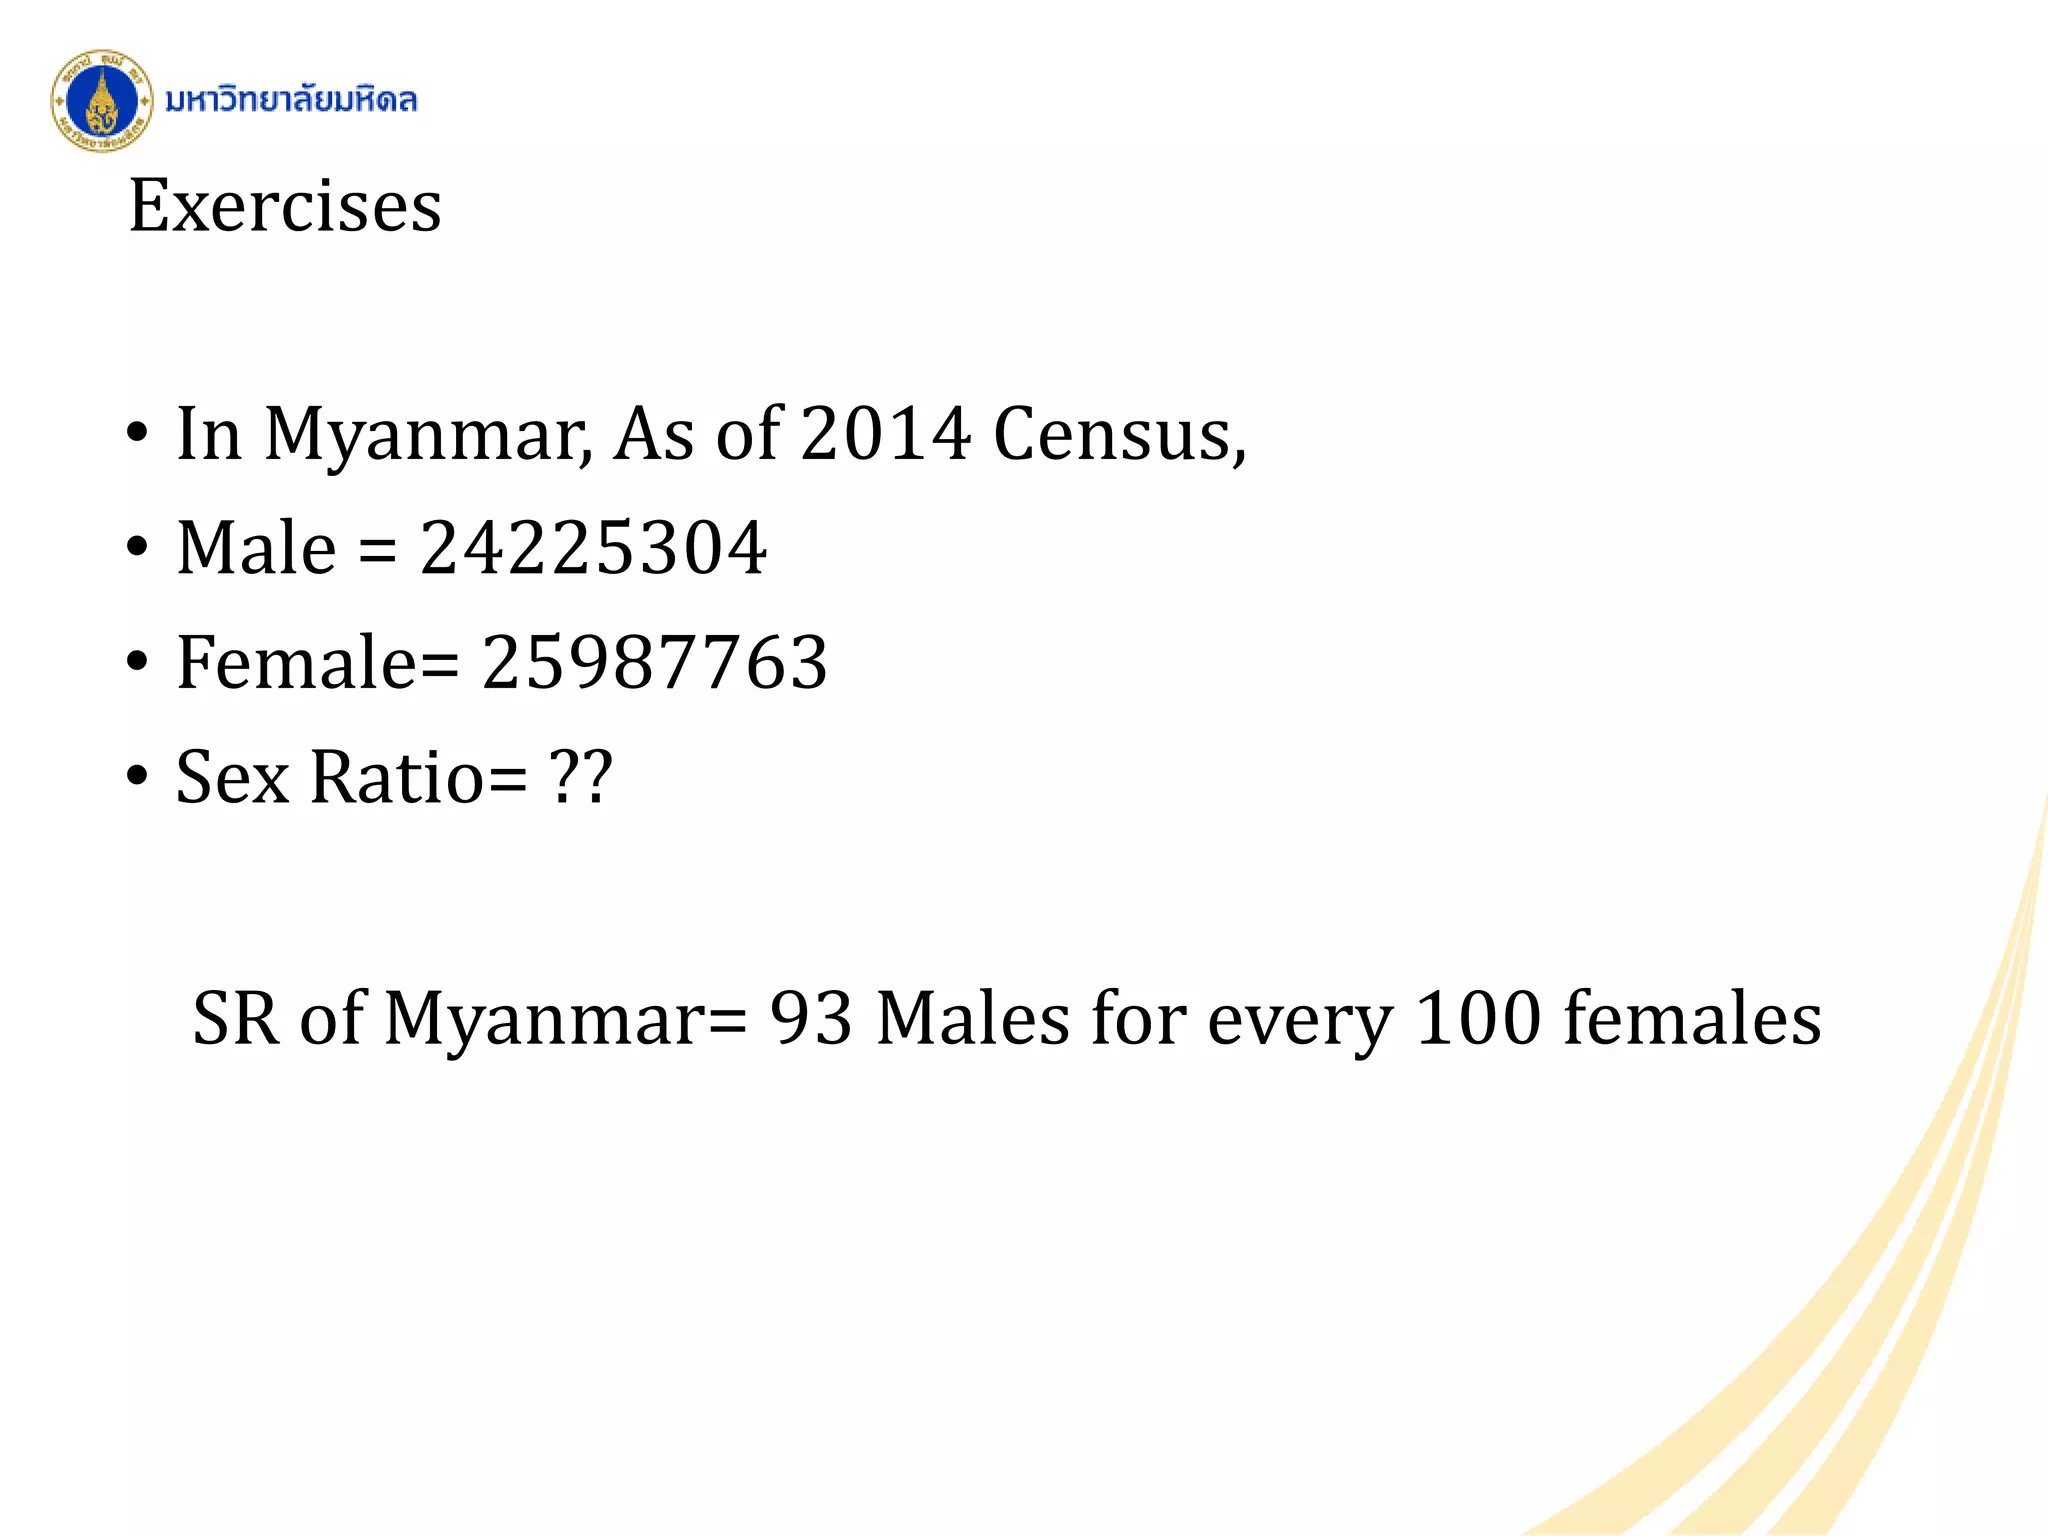
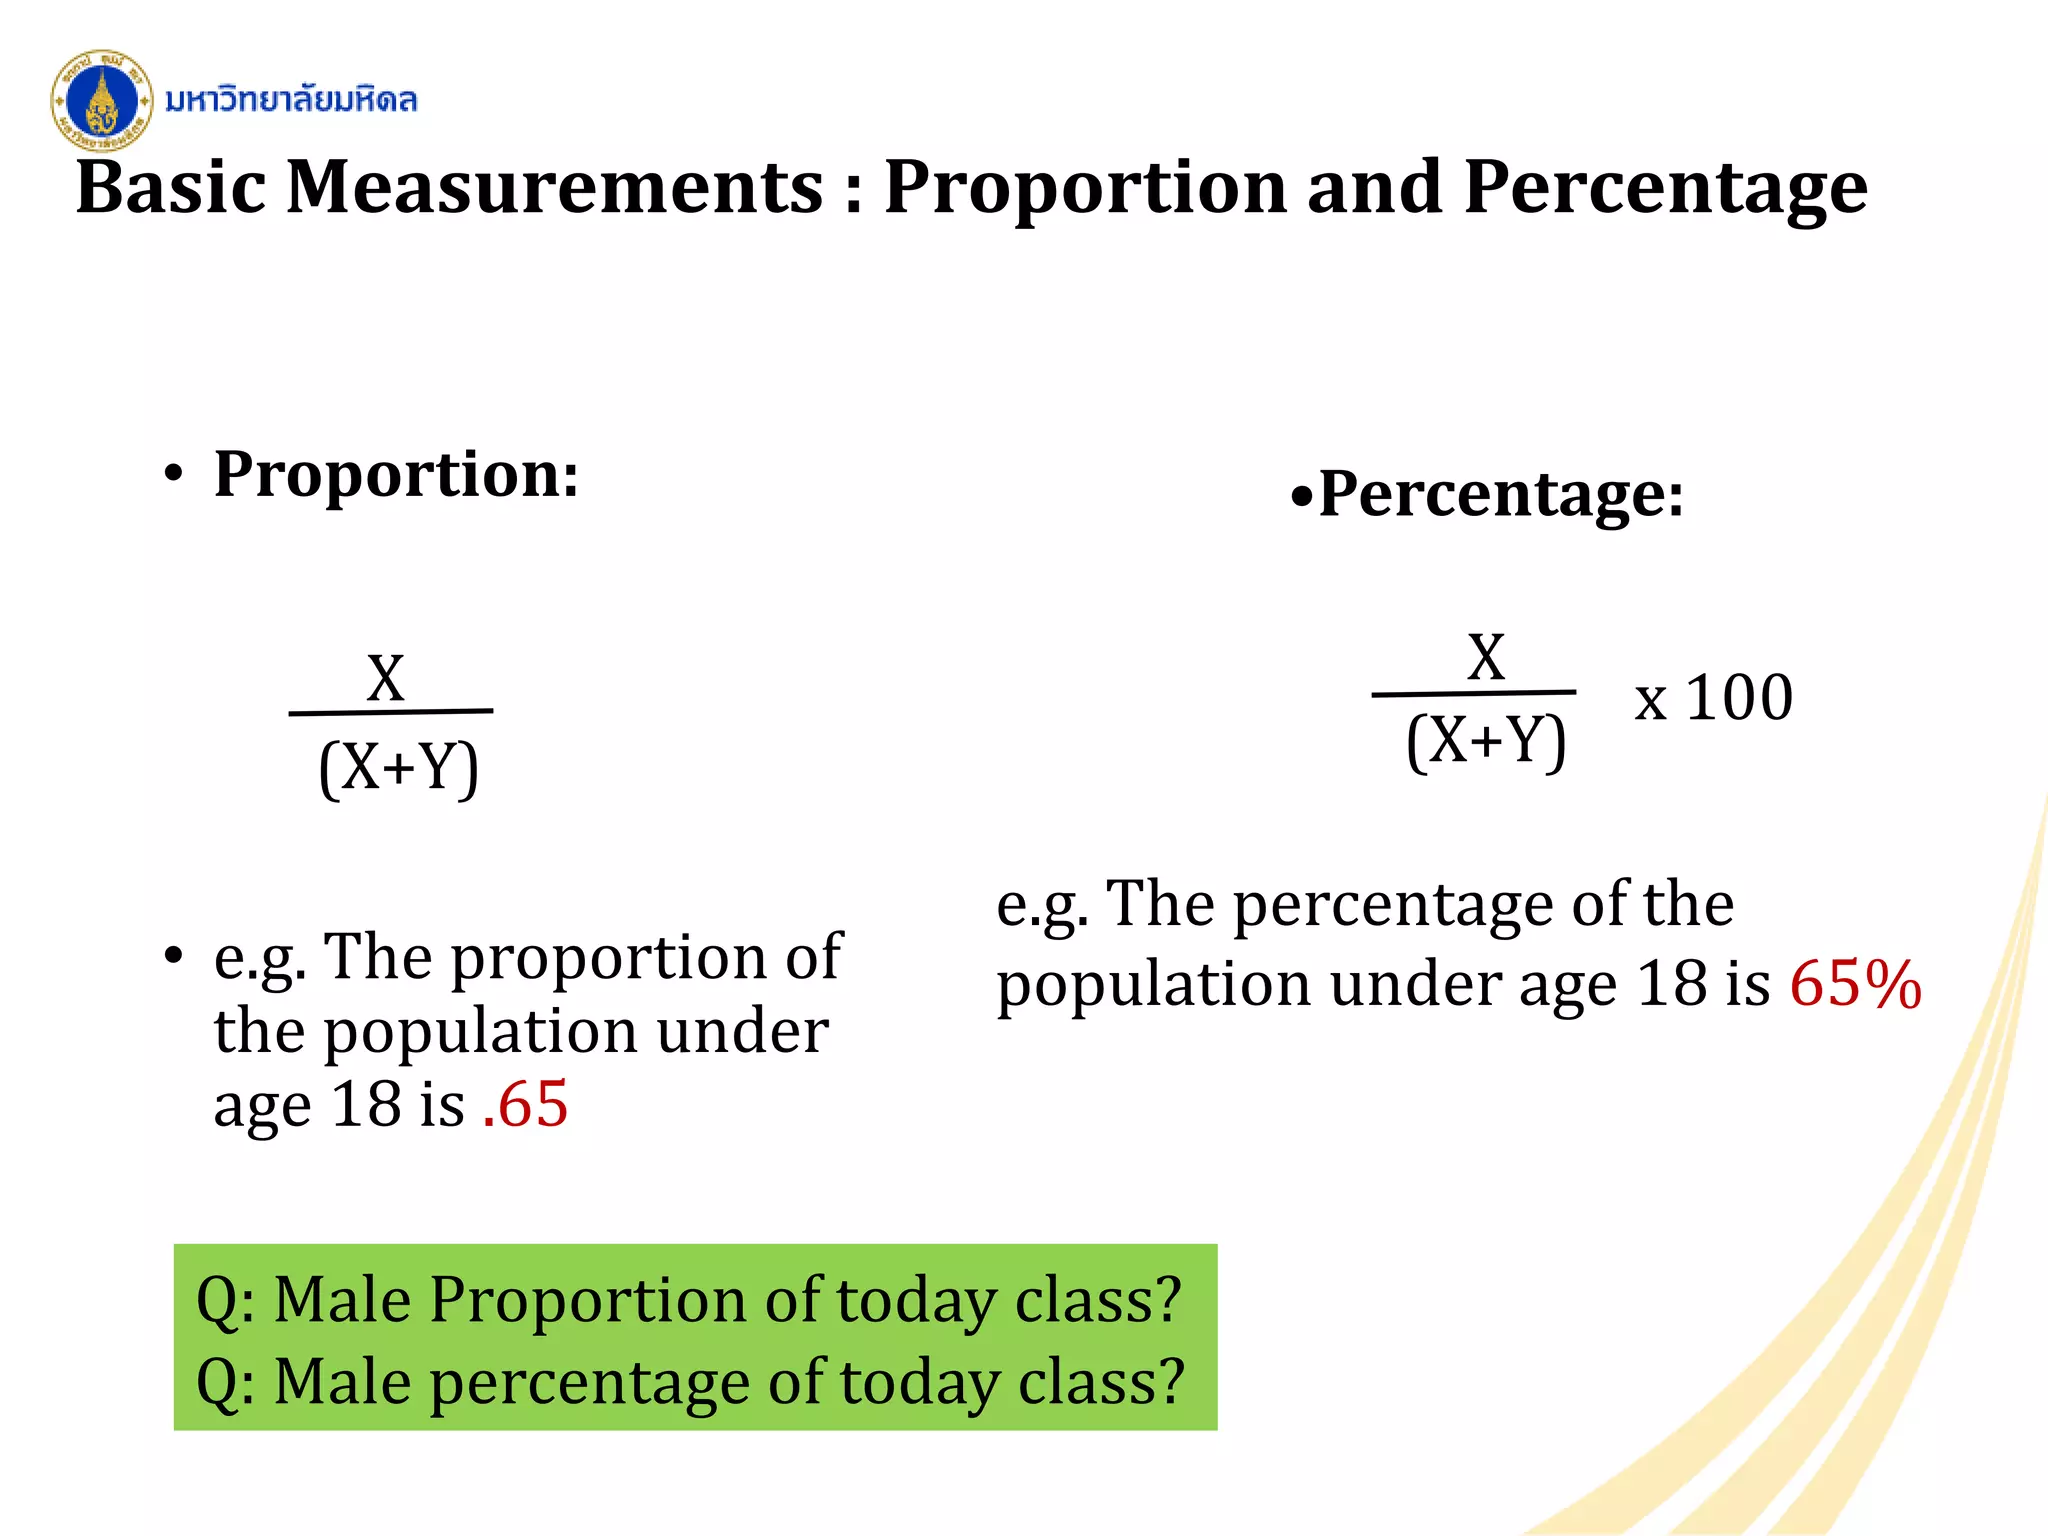
Detailed coverage of demographic ratios, examples, calculations, and significance in demographic analysis.
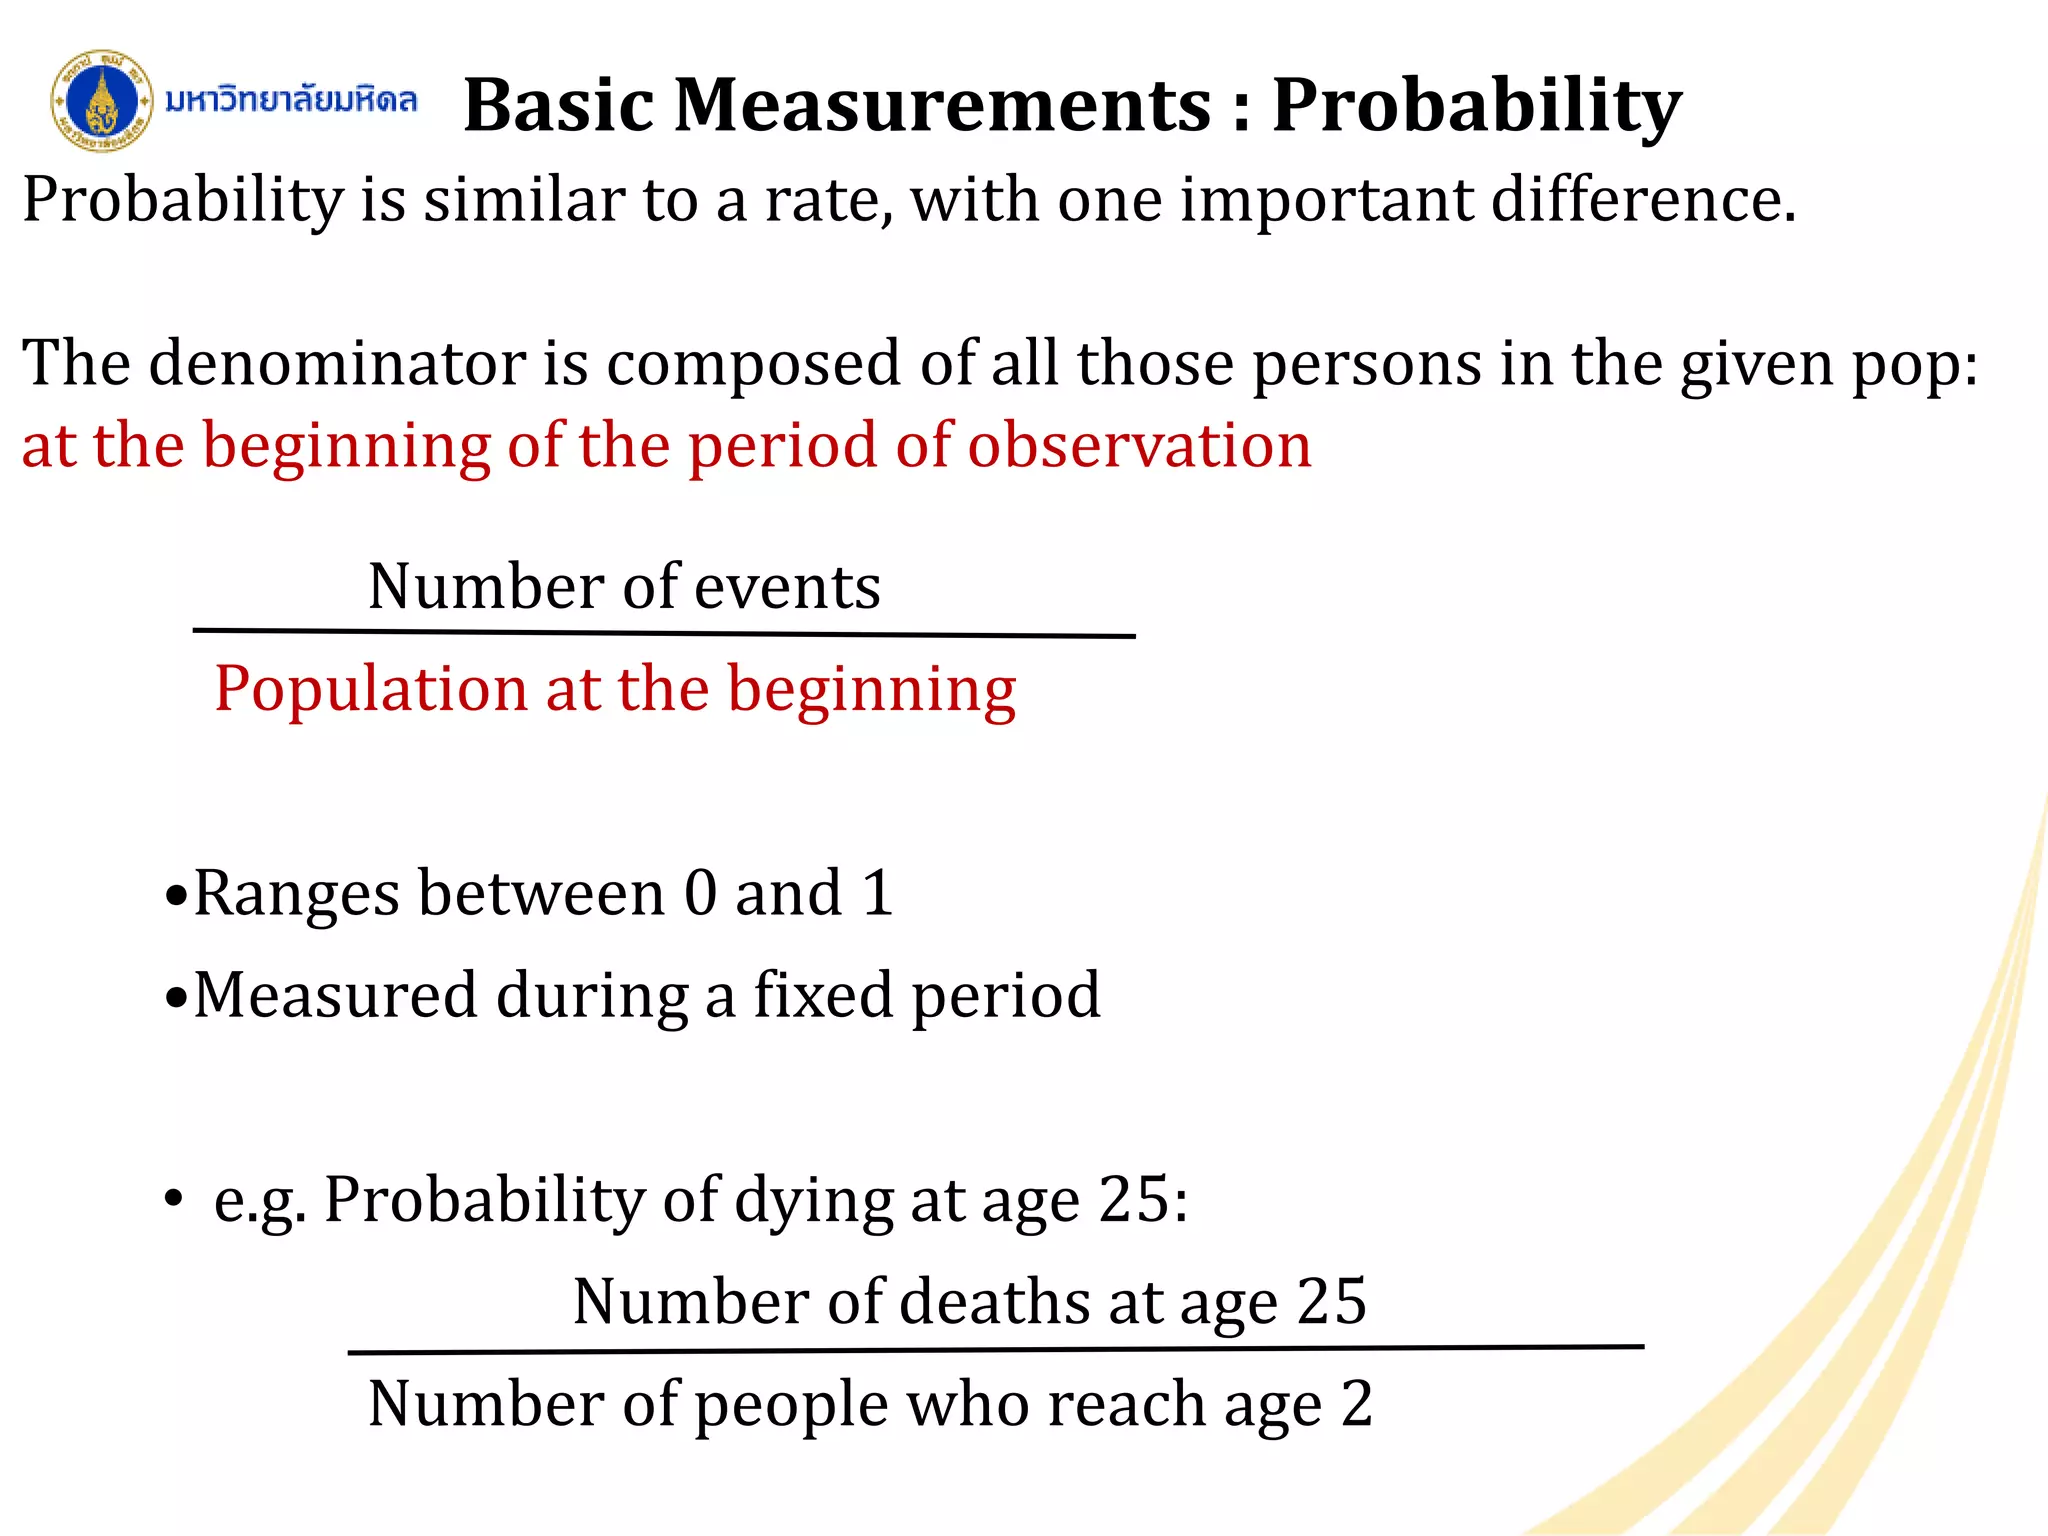
Introduction to the concept of probability in demographics and its importance in analyses.
Interactive component for participants to summarize and reflect on key learnings from the session.
Recommended readings for further insights into demographic measures and methods.


![CAPE SOCIOLOGY Age and sex structure[1]](https://cdn.slidesharecdn.com/ss_thumbnails/ageandsexstructure1-140118141140-phpapp02-thumbnail.jpg?width=640&height=640&fit=bounds)


![Understanding Parkinson’s Disease: Causes, Symptoms, and Treatment [2025]](https://cdn.slidesharecdn.com/ss_thumbnails/understandingparkinson-251208102525-80ba3223-thumbnail.jpg?width=640&height=640&fit=bounds)


