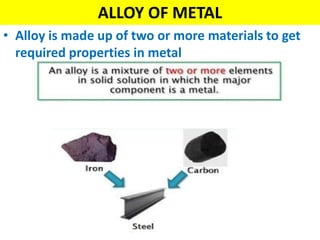
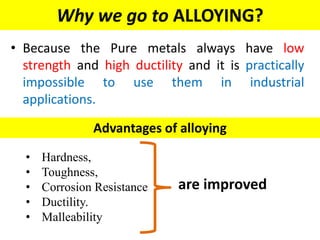
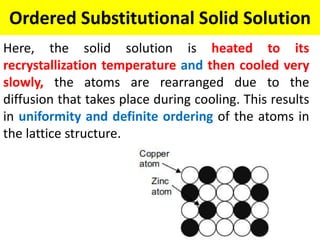
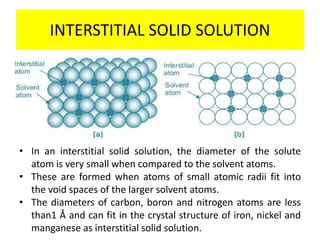
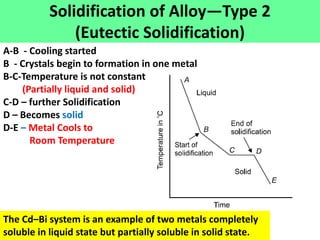
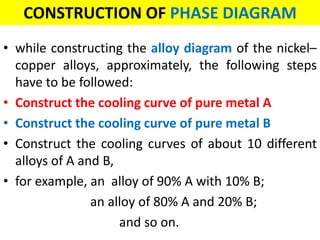
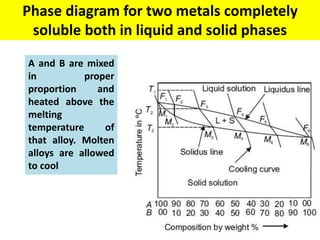
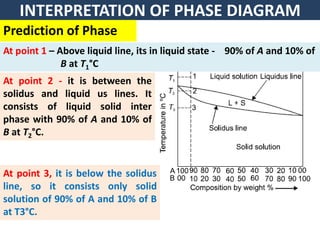
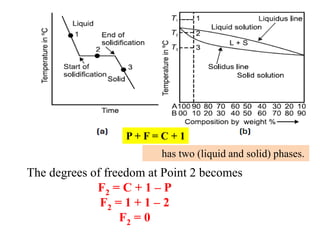
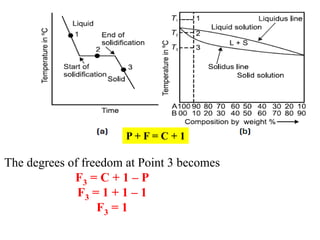
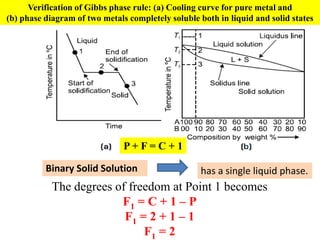
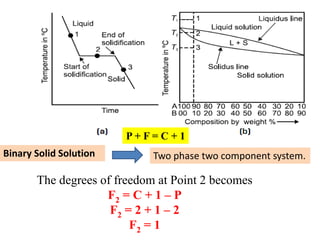
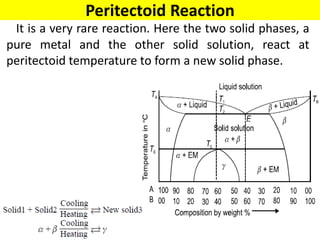
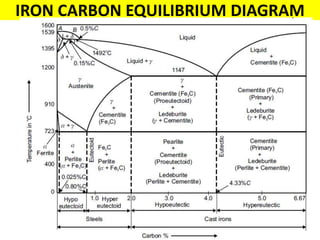
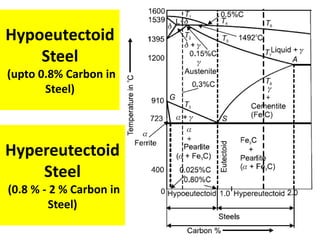
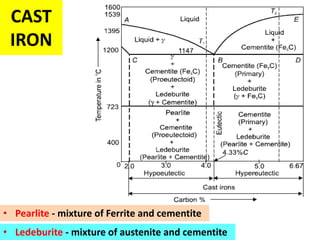
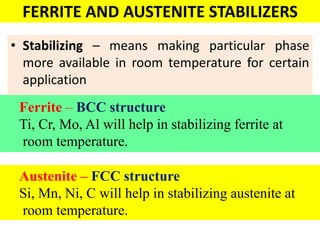
UNIT-1
CONSTITUTION OF
ALLOYS
20ME304
- ENGINEERING METALLURGY
ALLOY OF METAL
• Alloy is made up of two or more materials to get
required properties in metal
Why we go to ALLOYING?
• Because the Pure metals always have low
strength and high ductility and it is practically
impossible to use them in industrial
applications.
• Hardness,
• Toughness,
• Corrosion Resistance
• Ductility.
• Malleability
Advantages of alloying
are improved
SOLID SOLUTIONS
A solid solution describes a family of
materials which have a range of
compositions and a single crystal
structure.
A solid solution is a homogeneous mixture of
two or more kinds of atoms in a solid state or
more than two types of atoms combined in a
single-space lattice.
Types of Solid Solution
(a) Substitutional solid solutions.
• Disordered substitutional solid solution
• Ordered substitutional solid solution.
(b) Interstitial solid solutions.
SUBSTITUTIONAL SOLID SOLUTION
• The solute atom substitutes the atoms of solvent in the crystal structure. The
crystal structure of the parent element is unchanged, but the lattice (பின
்னல்)
may be distorted by the presence of the solute atoms.
• In a substitutional solid solution, the two atoms (solvent and solute)are equal or
approximately equal in diameter and the crystal structure of the two elements
must be the same.
• Brass is alloy of copper and zinc. The atomic diameter of copper is 1.278 Å and that
of zinc is1.332 Å and the two metals form substitutional solid solution.
• Figure shows that the zinc atoms replace some copper atoms in the lattice
structure of copper.
Disordered Substitutional Solid Solution
Here, the solute atoms do not follow any specific
order, but the atoms are distributed randomly in the
lattice structure of the solvent.
Ordered Substitutional Solid Solution
Here, the solid solution is heated to its
recrystallization temperature and then cooled very
slowly, the atoms are rearranged due to the
diffusion that takes place during cooling. This results
in uniformity and definite ordering of the atoms in
the lattice structure.
INTERSTITIAL SOLID SOLUTION
• In an interstitial solid solution, the diameter of the solute
atom is very small when compared to the solvent atoms.
• These are formed when atoms of small atomic radii fit into
the void spaces of the larger solvent atoms.
• The diameters of carbon, boron and nitrogen atoms are less
than1 Å and can fit in the crystal structure of iron, nickel and
manganese as interstitial solid solution.
Phase Diagram (constitutional diagram)
• The solidification of a metal or an alloy is
clearly understood by means of a phase
diagram.
• A plot with the temperature on the vertical
scale and the percentage of composition by
weight on the horizontal scale is termed a
phase diagram.
Cooling curve
• The solidification of molten metal is plotted as
a graph is called cooling curve.
• X – axis – Time
• Y – axis - Temperature
This curve is used for studying the changes that
occur during the solidification of alloys. If a plot is
drawn between temperature and time at a constant
composition, the resulting cooling curve shows a
change of slope when a phase change occurs.
Types of cooling curve
1. Cooling curve for Pure metal or compound
(liquid , solid)
2. Cooling curve of a binary solution (liquid,
solid ,liquid + solid)
3. Cooling curve of a binary Eutectic system
(liquid, solid ,liquid + solid)
.
Cooling Curve for Pure Metals or Solidification
of Pure Metals
Liquid metal cools from A to B.
The crystal begins to form at B.
From B to C molten metal liberates latent heat of fusion and the
temperature remains constant until the entire liquid metal is solidified.
Between B and C, the metal is partially solid and partially liquid. On
further cooling, i.e., from C to D, solid metal tends to reach the room
temperature.
Cooling Curve for Binary Alloy
(Type-1)
A - Cooling started
B - Crystals begin to form
B-C-Temperature is not constant
(Partially liquid and solid)
C-D – further Solidification
D – Becomes solid
The Cu–Ni system is an example .
Solidification of Alloy—Type 2
(Eutectic Solidification)
A-B - Cooling started
B - Crystals begin to formation in one metal
B-C-Temperature is not constant
(Partially liquid and solid)
C-D – further Solidification
D – Becomes solid
D-E – Metal Cools to
Room Temperature
The Cd–Bi system is an example of two metals completely
soluble in liquid state but partially soluble in solid state.
CONSTRUCTION OF PHASE DIAGRAM
• while constructing the alloy diagram of the nickel–
copper alloys, approximately, the following steps
have to be followed:
• Construct the cooling curve of pure metal A
• Construct the cooling curve of pure metal B
• Construct the cooling curves of about 10 different
alloys of A and B,
• for example, an alloy of 90% A with 10% B;
an alloy of 80% A and 20% B;
and so on.
Phase diagram for two metals completely
soluble both in liquid and solid phases
A and B are mixed
in proper
proportion and
heated above the
melting
temperature of
that alloy. Molten
alloys are allowed
to cool
INTERPRETATION OF PHASE DIAGRAM
Prediction of Phase
At point 1 – Above liquid line, its in liquid state - 90% of A and 10% of
B at T1°C
At point 2 - it is between the
solidus and liquid us lines. It
consists of liquid solid inter
phase with 90% of A and 10% of
B at T2°C.
At point 3, it is below the solidus
line, so it consists only solid
solution of 90% of A and 10% of B
at T3°C.
Draw a horizontal line, that intercepts at O and P on solidus and
liquid us line. From the points O and P, project vertical lines to confirm
the composition. At point P, the composition 35% of A and 65% of B
starts freezing. The composition 80% of A and 20% of B starts melting.
Prediction of Amount of Phase
(Lever-arm Rule)
Mathematically, the lever rule can be expressed as
Total amount of solid phase = (ON/MN) × 100
Total amount of liquid phase = (OM/MN) × 100
GIBBS PHASE RULE
Where,
F = number of degrees of freedom or number of physical variables
C = number of components in the system
P = number of phases in the system
N = number of external factors -temperature and pressure.
The number of variable factors which define the state of a
system is called the degree of freedom.
P + F = C + N
P + F = C + 1
or
F = C + 1 – P
The number of degrees of freedom cannot be less than 0. So,
C + 1 – P ≥ 0
or
P ≤ C + 1
P + F = C + 1
The degrees of freedom at Point 1 becomes
F1 = C + 1 – P
F1 = 1 + 1 – 1
F1 = 1
Verification of Gibbs phase rule: (a) Cooling curve for pure metal and
(b) phase diagram of two metals completely soluble both in liquid and solid states
P + F = C + 1
The degrees of freedom at Point 2 becomes
F2 = C + 1 – P
F2 = 1 + 1 – 2
F2 = 0
has two (liquid and solid) phases.
P + F = C + 1
The degrees of freedom at Point 3 becomes
F3 = C + 1 – P
F3 = 1 + 1 – 1
F3 = 1
P + F = C + 1
The degrees of freedom at Point 1 becomes
F1 = C + 1 – P
F1 = 2 + 1 – 1
F1 = 2
Binary Solid Solution has a single liquid phase.
Verification of Gibbs phase rule: (a) Cooling curve for pure metal and
(b) phase diagram of two metals completely soluble both in liquid and solid states
P + F = C + 1
The degrees of freedom at Point 2 becomes
F2 = C + 1 – P
F2 = 2 + 1 – 2
F2 = 1
Binary Solid Solution Two phase two component system.
P + F = C + 1
The degrees of freedom at Point 3 becomes
F3 = C + 1 – P
F3 = 2 + 1 – 1
F3 = 2
Binary Solid Solution Only Solid phase
LIQUID AND SOLID-STATE TRANSFORMATION
Eutectic Reaction
(Transformation)
Peritectic Reaction
Here the liquid phase reacts with
the solid phase to give a solid phase
of different structure, at a constant
temperature.
Consider a liquid of composition of
25% silver and75% platinum. The
solidification starts at T1°C and ‘α’
begins to form till peritectic
temperature (TE). At this
temperature, the ‘α’ crystals begin
to react with remaining liquid and
form δ solid solution.
Eutectoid Reaction
The solid-state transformations is the eutectoid reaction in
which one solid phase decomposes isothermally into a mixture
of two solid phases.
Peritectoid Reaction
It is a very rare reaction. Here the two solid phases, a
pure metal and the other solid solution, react at
peritectoid temperature to form a new solid phase.
IRON CARBON EQUILIBRIUM DIAGRAM
Phases in Iron Carbide –Phase Diagram
The phases that occur in iron carbon alloys are
molten alloys,
austenite,
ferrite,
cementite,
ledeburite
pearlite.
δ-Ferrite –
• at 1539°C - BCC crystal - called δ-ferrite.
• At 1492°C, solubility of carbon 0.1% and 0.15%.
• It is soft, ductile and converted into γ solid solution by
reacting with residue liquid of iron at 1395°C.
Austenite–
• at 1147°C - FCC crystal - called Austenite
• solubility of carbon up to 2 %
• It is a nonmagnetic iron
• On cooling below 723°C, it starts transferring into
ferrite and pearlite.
Ferrite –
• The structural modification of pure iron at room
temperature is known as ferrite.
• BCC crystal
• solubility of carbon 0.025% at 723°C
• It is soft, ductile and low strength
Cementite
• When carbon in iron exceeds the solubility limit, it
forms ----- carbon up to 6.67%
• This is also called iron carbide (Fe3C)
• low tensile strength but high compressive strength
and ferromagnetic
• It is hardest structure in iron carbide system.
Pearlite –
• The mixture of ferrite and cementite formed at 727°C on
very slow cooling. Alternate layers have seen.
• Pearlite is fairly soft and its hardness lies between that of
ferrite and cementite.
• It appears like a fingerprint in structure.
Ledeburite
• mixture of austenite and cementite
• It contains 6.67% carbon and is formed at 1147°C
• ledeburite is unstable and transfers into ferrite and
cementite at 726°C.
• It is hard and brittle.
REACTIONS IN IRON CARBON SYSTEM
• Peritectic reaction
- Liquid & Solid to another Solid Transformation
at 1492oC
• Eutectic reaction
- Solid to Solid Transformation
at 723oC
• Eutectoid reaction.
- Liquid to Solid Transformation
at 1147oC
STEELS
• Steels ----- Carbon 0.008% to 2%
low carbon steels — 0.2% – 0.3% carbon,
medium carbon steels— 0.3% – 0.6% carbon
high carbon steels — 0.6% – 1.7% carbon.
Hypoeutectoid steel - Steels with carbon content from
0.025% to 0.8%
Hypereutectoid steel - Steels with carbon content from
0.8% to 2 %
Hypoeutectoid
Steel
(upto 0.8% Carbon in
Steel)
Hypereutectoid
Steel
(0.8 % - 2 % Carbon in
Steel)
CAST IRON
• Hypoeutectic cast iron has carbon content
between 2% and 4.33%
Hypereutectic cast iron has carbon content
between 4.33% and 6.67%.
CAST
IRON
• Ledeburite - mixture of austenite and cementite
• Pearlite - mixture of Ferrite and cementite
FERRITE AND AUSTENITE STABILIZERS
• Stabilizing – means making particular phase
more available in room temperature for certain
application
Austenite – FCC structure
Si, Mn, Ni, C will help in stabilizing austenite at
room temperature.
Ferrite – BCC structure
Ti, Cr, Mo, Al will help in stabilizing ferrite at
room temperature.

UNIT - I.pptx

  • 1.
  • 2.
    ALLOY OF METAL •Alloy is made up of two or more materials to get required properties in metal
  • 3.
    Why we goto ALLOYING? • Because the Pure metals always have low strength and high ductility and it is practically impossible to use them in industrial applications. • Hardness, • Toughness, • Corrosion Resistance • Ductility. • Malleability Advantages of alloying are improved
  • 4.
    SOLID SOLUTIONS A solidsolution describes a family of materials which have a range of compositions and a single crystal structure. A solid solution is a homogeneous mixture of two or more kinds of atoms in a solid state or more than two types of atoms combined in a single-space lattice.
  • 5.
    Types of SolidSolution (a) Substitutional solid solutions. • Disordered substitutional solid solution • Ordered substitutional solid solution. (b) Interstitial solid solutions.
  • 6.
    SUBSTITUTIONAL SOLID SOLUTION •The solute atom substitutes the atoms of solvent in the crystal structure. The crystal structure of the parent element is unchanged, but the lattice (பின ்னல்) may be distorted by the presence of the solute atoms. • In a substitutional solid solution, the two atoms (solvent and solute)are equal or approximately equal in diameter and the crystal structure of the two elements must be the same. • Brass is alloy of copper and zinc. The atomic diameter of copper is 1.278 Å and that of zinc is1.332 Å and the two metals form substitutional solid solution. • Figure shows that the zinc atoms replace some copper atoms in the lattice structure of copper.
  • 7.
    Disordered Substitutional SolidSolution Here, the solute atoms do not follow any specific order, but the atoms are distributed randomly in the lattice structure of the solvent.
  • 8.
    Ordered Substitutional SolidSolution Here, the solid solution is heated to its recrystallization temperature and then cooled very slowly, the atoms are rearranged due to the diffusion that takes place during cooling. This results in uniformity and definite ordering of the atoms in the lattice structure.
  • 9.
    INTERSTITIAL SOLID SOLUTION •In an interstitial solid solution, the diameter of the solute atom is very small when compared to the solvent atoms. • These are formed when atoms of small atomic radii fit into the void spaces of the larger solvent atoms. • The diameters of carbon, boron and nitrogen atoms are less than1 Å and can fit in the crystal structure of iron, nickel and manganese as interstitial solid solution.
  • 10.
    Phase Diagram (constitutionaldiagram) • The solidification of a metal or an alloy is clearly understood by means of a phase diagram. • A plot with the temperature on the vertical scale and the percentage of composition by weight on the horizontal scale is termed a phase diagram.
  • 11.
    Cooling curve • Thesolidification of molten metal is plotted as a graph is called cooling curve. • X – axis – Time • Y – axis - Temperature This curve is used for studying the changes that occur during the solidification of alloys. If a plot is drawn between temperature and time at a constant composition, the resulting cooling curve shows a change of slope when a phase change occurs.
  • 12.
    Types of coolingcurve 1. Cooling curve for Pure metal or compound (liquid , solid) 2. Cooling curve of a binary solution (liquid, solid ,liquid + solid) 3. Cooling curve of a binary Eutectic system (liquid, solid ,liquid + solid)
  • 13.
  • 14.
    Cooling Curve forPure Metals or Solidification of Pure Metals Liquid metal cools from A to B. The crystal begins to form at B. From B to C molten metal liberates latent heat of fusion and the temperature remains constant until the entire liquid metal is solidified. Between B and C, the metal is partially solid and partially liquid. On further cooling, i.e., from C to D, solid metal tends to reach the room temperature.
  • 15.
    Cooling Curve forBinary Alloy (Type-1) A - Cooling started B - Crystals begin to form B-C-Temperature is not constant (Partially liquid and solid) C-D – further Solidification D – Becomes solid The Cu–Ni system is an example .
  • 16.
    Solidification of Alloy—Type2 (Eutectic Solidification) A-B - Cooling started B - Crystals begin to formation in one metal B-C-Temperature is not constant (Partially liquid and solid) C-D – further Solidification D – Becomes solid D-E – Metal Cools to Room Temperature The Cd–Bi system is an example of two metals completely soluble in liquid state but partially soluble in solid state.
  • 17.
    CONSTRUCTION OF PHASEDIAGRAM • while constructing the alloy diagram of the nickel– copper alloys, approximately, the following steps have to be followed: • Construct the cooling curve of pure metal A • Construct the cooling curve of pure metal B • Construct the cooling curves of about 10 different alloys of A and B, • for example, an alloy of 90% A with 10% B; an alloy of 80% A and 20% B; and so on.
  • 18.
    Phase diagram fortwo metals completely soluble both in liquid and solid phases A and B are mixed in proper proportion and heated above the melting temperature of that alloy. Molten alloys are allowed to cool
  • 19.
    INTERPRETATION OF PHASEDIAGRAM Prediction of Phase At point 1 – Above liquid line, its in liquid state - 90% of A and 10% of B at T1°C At point 2 - it is between the solidus and liquid us lines. It consists of liquid solid inter phase with 90% of A and 10% of B at T2°C. At point 3, it is below the solidus line, so it consists only solid solution of 90% of A and 10% of B at T3°C.
  • 20.
    Draw a horizontalline, that intercepts at O and P on solidus and liquid us line. From the points O and P, project vertical lines to confirm the composition. At point P, the composition 35% of A and 65% of B starts freezing. The composition 80% of A and 20% of B starts melting.
  • 21.
    Prediction of Amountof Phase (Lever-arm Rule) Mathematically, the lever rule can be expressed as Total amount of solid phase = (ON/MN) × 100 Total amount of liquid phase = (OM/MN) × 100
  • 22.
    GIBBS PHASE RULE Where, F= number of degrees of freedom or number of physical variables C = number of components in the system P = number of phases in the system N = number of external factors -temperature and pressure. The number of variable factors which define the state of a system is called the degree of freedom. P + F = C + N P + F = C + 1 or F = C + 1 – P The number of degrees of freedom cannot be less than 0. So, C + 1 – P ≥ 0 or P ≤ C + 1
  • 23.
    P + F= C + 1 The degrees of freedom at Point 1 becomes F1 = C + 1 – P F1 = 1 + 1 – 1 F1 = 1 Verification of Gibbs phase rule: (a) Cooling curve for pure metal and (b) phase diagram of two metals completely soluble both in liquid and solid states
  • 24.
    P + F= C + 1 The degrees of freedom at Point 2 becomes F2 = C + 1 – P F2 = 1 + 1 – 2 F2 = 0 has two (liquid and solid) phases.
  • 25.
    P + F= C + 1 The degrees of freedom at Point 3 becomes F3 = C + 1 – P F3 = 1 + 1 – 1 F3 = 1
  • 26.
    P + F= C + 1 The degrees of freedom at Point 1 becomes F1 = C + 1 – P F1 = 2 + 1 – 1 F1 = 2 Binary Solid Solution has a single liquid phase. Verification of Gibbs phase rule: (a) Cooling curve for pure metal and (b) phase diagram of two metals completely soluble both in liquid and solid states
  • 27.
    P + F= C + 1 The degrees of freedom at Point 2 becomes F2 = C + 1 – P F2 = 2 + 1 – 2 F2 = 1 Binary Solid Solution Two phase two component system.
  • 28.
    P + F= C + 1 The degrees of freedom at Point 3 becomes F3 = C + 1 – P F3 = 2 + 1 – 1 F3 = 2 Binary Solid Solution Only Solid phase
  • 29.
    LIQUID AND SOLID-STATETRANSFORMATION Eutectic Reaction (Transformation)
  • 30.
    Peritectic Reaction Here theliquid phase reacts with the solid phase to give a solid phase of different structure, at a constant temperature. Consider a liquid of composition of 25% silver and75% platinum. The solidification starts at T1°C and ‘α’ begins to form till peritectic temperature (TE). At this temperature, the ‘α’ crystals begin to react with remaining liquid and form δ solid solution.
  • 31.
    Eutectoid Reaction The solid-statetransformations is the eutectoid reaction in which one solid phase decomposes isothermally into a mixture of two solid phases.
  • 32.
    Peritectoid Reaction It isa very rare reaction. Here the two solid phases, a pure metal and the other solid solution, react at peritectoid temperature to form a new solid phase.
  • 33.
  • 34.
    Phases in IronCarbide –Phase Diagram The phases that occur in iron carbon alloys are molten alloys, austenite, ferrite, cementite, ledeburite pearlite.
  • 35.
    δ-Ferrite – • at1539°C - BCC crystal - called δ-ferrite. • At 1492°C, solubility of carbon 0.1% and 0.15%. • It is soft, ductile and converted into γ solid solution by reacting with residue liquid of iron at 1395°C. Austenite– • at 1147°C - FCC crystal - called Austenite • solubility of carbon up to 2 % • It is a nonmagnetic iron • On cooling below 723°C, it starts transferring into ferrite and pearlite.
  • 36.
    Ferrite – • Thestructural modification of pure iron at room temperature is known as ferrite. • BCC crystal • solubility of carbon 0.025% at 723°C • It is soft, ductile and low strength Cementite • When carbon in iron exceeds the solubility limit, it forms ----- carbon up to 6.67% • This is also called iron carbide (Fe3C) • low tensile strength but high compressive strength and ferromagnetic • It is hardest structure in iron carbide system.
  • 37.
    Pearlite – • Themixture of ferrite and cementite formed at 727°C on very slow cooling. Alternate layers have seen. • Pearlite is fairly soft and its hardness lies between that of ferrite and cementite. • It appears like a fingerprint in structure. Ledeburite • mixture of austenite and cementite • It contains 6.67% carbon and is formed at 1147°C • ledeburite is unstable and transfers into ferrite and cementite at 726°C. • It is hard and brittle.
  • 38.
    REACTIONS IN IRONCARBON SYSTEM • Peritectic reaction - Liquid & Solid to another Solid Transformation at 1492oC • Eutectic reaction - Solid to Solid Transformation at 723oC • Eutectoid reaction. - Liquid to Solid Transformation at 1147oC
  • 39.
    STEELS • Steels -----Carbon 0.008% to 2% low carbon steels — 0.2% – 0.3% carbon, medium carbon steels— 0.3% – 0.6% carbon high carbon steels — 0.6% – 1.7% carbon. Hypoeutectoid steel - Steels with carbon content from 0.025% to 0.8% Hypereutectoid steel - Steels with carbon content from 0.8% to 2 %
  • 40.
    Hypoeutectoid Steel (upto 0.8% Carbonin Steel) Hypereutectoid Steel (0.8 % - 2 % Carbon in Steel)
  • 41.
    CAST IRON • Hypoeutecticcast iron has carbon content between 2% and 4.33% Hypereutectic cast iron has carbon content between 4.33% and 6.67%.
  • 42.
    CAST IRON • Ledeburite -mixture of austenite and cementite • Pearlite - mixture of Ferrite and cementite
  • 43.
    FERRITE AND AUSTENITESTABILIZERS • Stabilizing – means making particular phase more available in room temperature for certain application Austenite – FCC structure Si, Mn, Ni, C will help in stabilizing austenite at room temperature. Ferrite – BCC structure Ti, Cr, Mo, Al will help in stabilizing ferrite at room temperature.