Downloaded 318 times
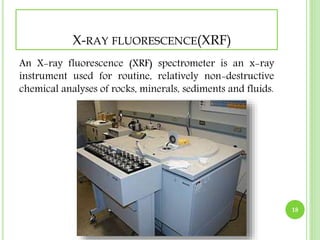
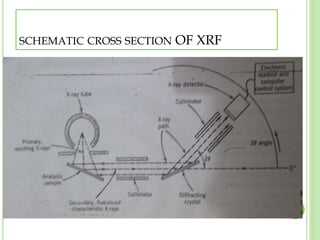


The document discusses various analytical instruments used in mineral science, including scanning electron microscopy (SEM), x-ray diffraction (XRD), and x-ray fluorescence (XRF), among others. It outlines the principles, applications, strengths, and limitations of each instrument, emphasizing their roles in analyzing crystalline materials and mineral identification. Additionally, it highlights techniques such as electron microprobe analysis (EPMA) and secondary ion mass spectrometry (SIMS), providing a comprehensive overview of their functionalities.


