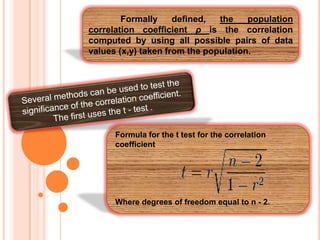
Downloaded 398 times


![Formula for the correlation
coefficient r
n ( ∑ xy) - ( ∑ x) ( ∑ y)
r=
√ [n ( ∑ x²) - ( ∑ x)² ] [n ( ∑ y²) - ( ∑ y)²
Where n is the number of data pairs.](https://image.slidesharecdn.com/pearsonproductmomentcorrelation-140226091913-phpapp02/85/Pearson-product-moment-correlation-4-320.jpg)
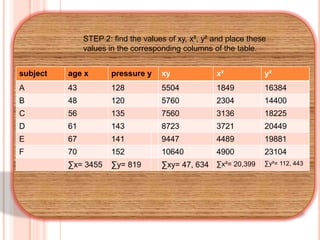
![Step 3 : Substitute in the formula and
solve for r.
n ( ∑ xy) - ( ∑ x) ( ∑ y)
r=
____
_______
[n ( ∑ x²) - ( ∑ x)² ] [n ( ∑ y²) - ( ∑ y)²]
6 ( 47,643) - ( 345) ( 819)
r=
___
[(6) (20,399) – (345)²] [(6) (112, 443) - (819) ²]
= 0.897
The correlation coefficient suggests a strong positive
relationship between age and blood pressure.](https://image.slidesharecdn.com/pearsonproductmomentcorrelation-140226091913-phpapp02/85/Pearson-product-moment-correlation-7-320.jpg)


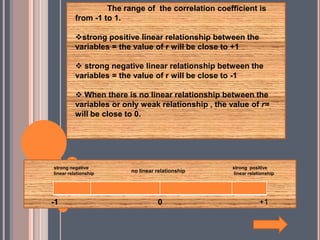
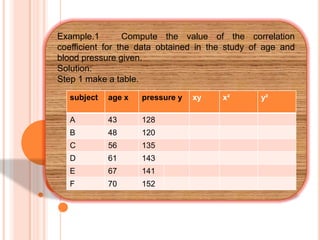
The document defines and provides information about correlation coefficients. It discusses how correlation coefficients measure the strength and direction of linear relationships between two variables. The range of correlation coefficients is from -1 to 1, where values closer to -1 or 1 indicate stronger linear relationships and a value of 0 indicates no linear relationship. It also provides the formula to calculate correlation coefficients and an example of calculating the correlation coefficient for age and blood pressure data.