Downloaded 526 times


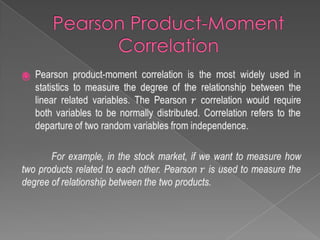
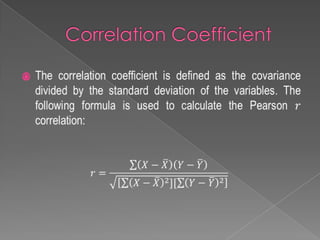

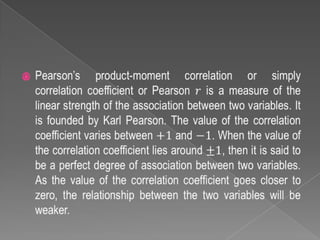
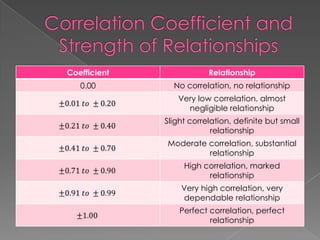
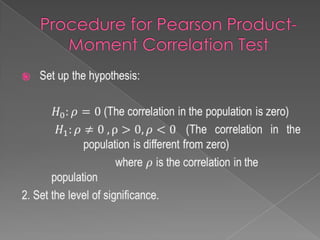
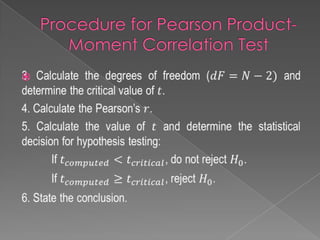
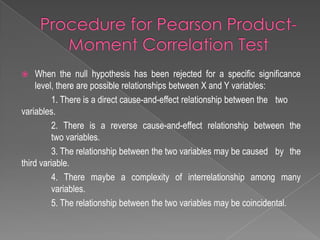


1. The document discusses the relationship between two variables and defines correlation coefficients ranging from 0 to 1 to indicate the strength of their relationship. 2. It then provides an example of a fruit shake store owner studying the correlation between temperature and sales over 12 summer days. Data is presented on the temperature, sales, and calculations for correlation analysis. 3. The results of the correlation analysis show a significant association between temperature and total sales, indicating higher temperatures are correlated with increased fruit shake sales.