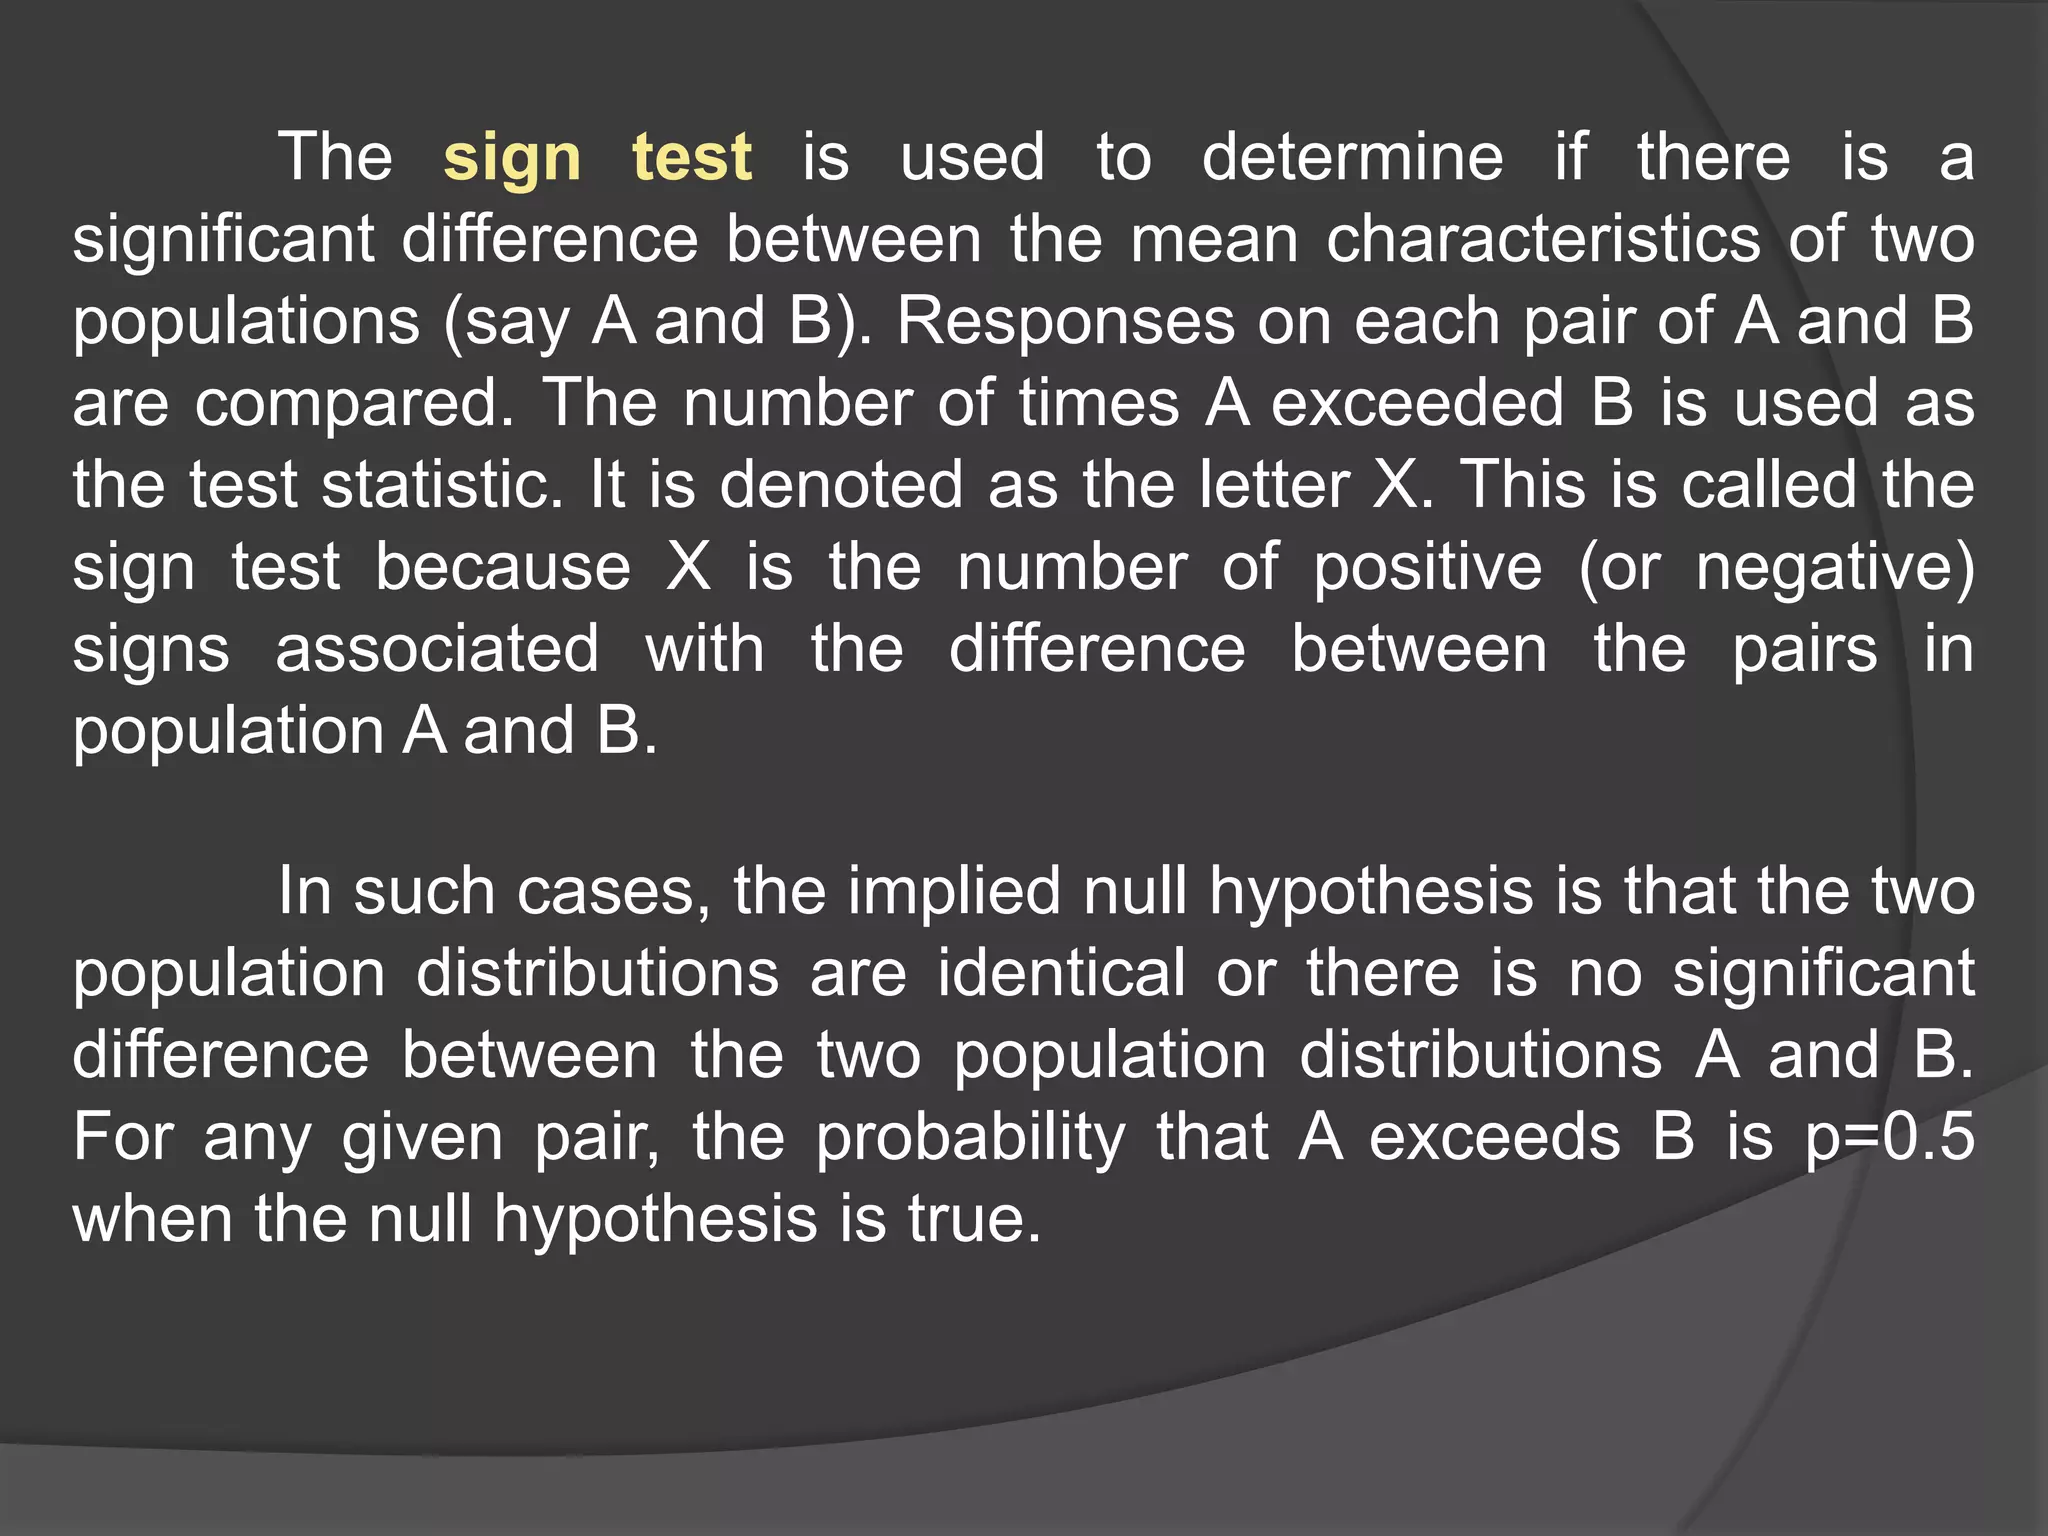
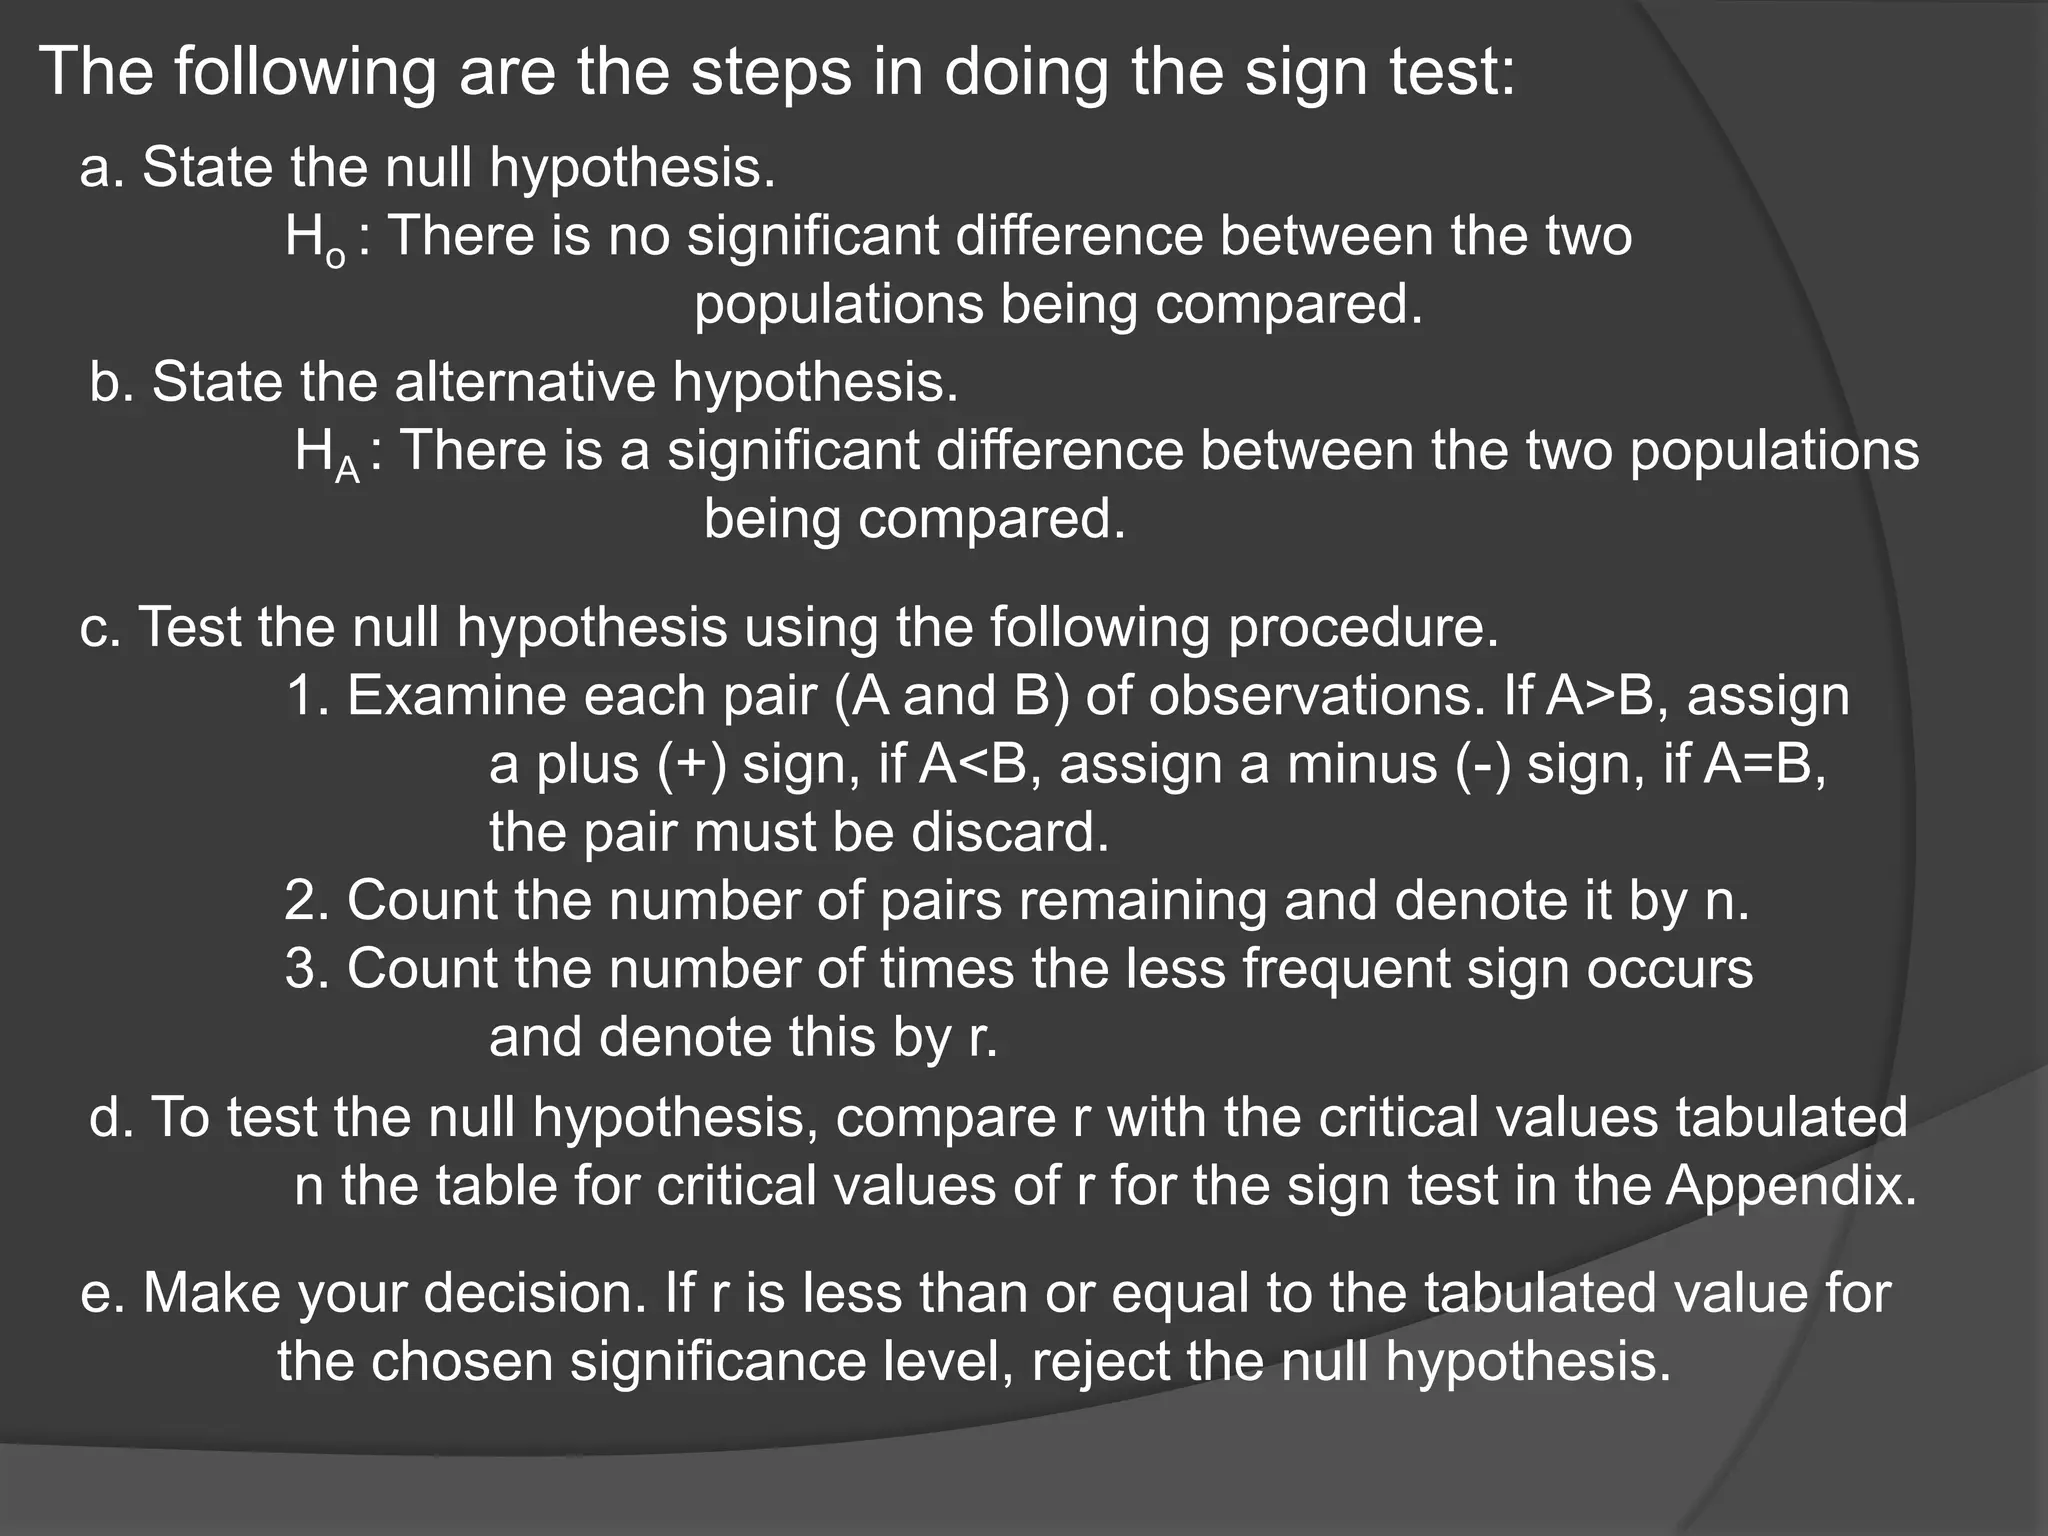
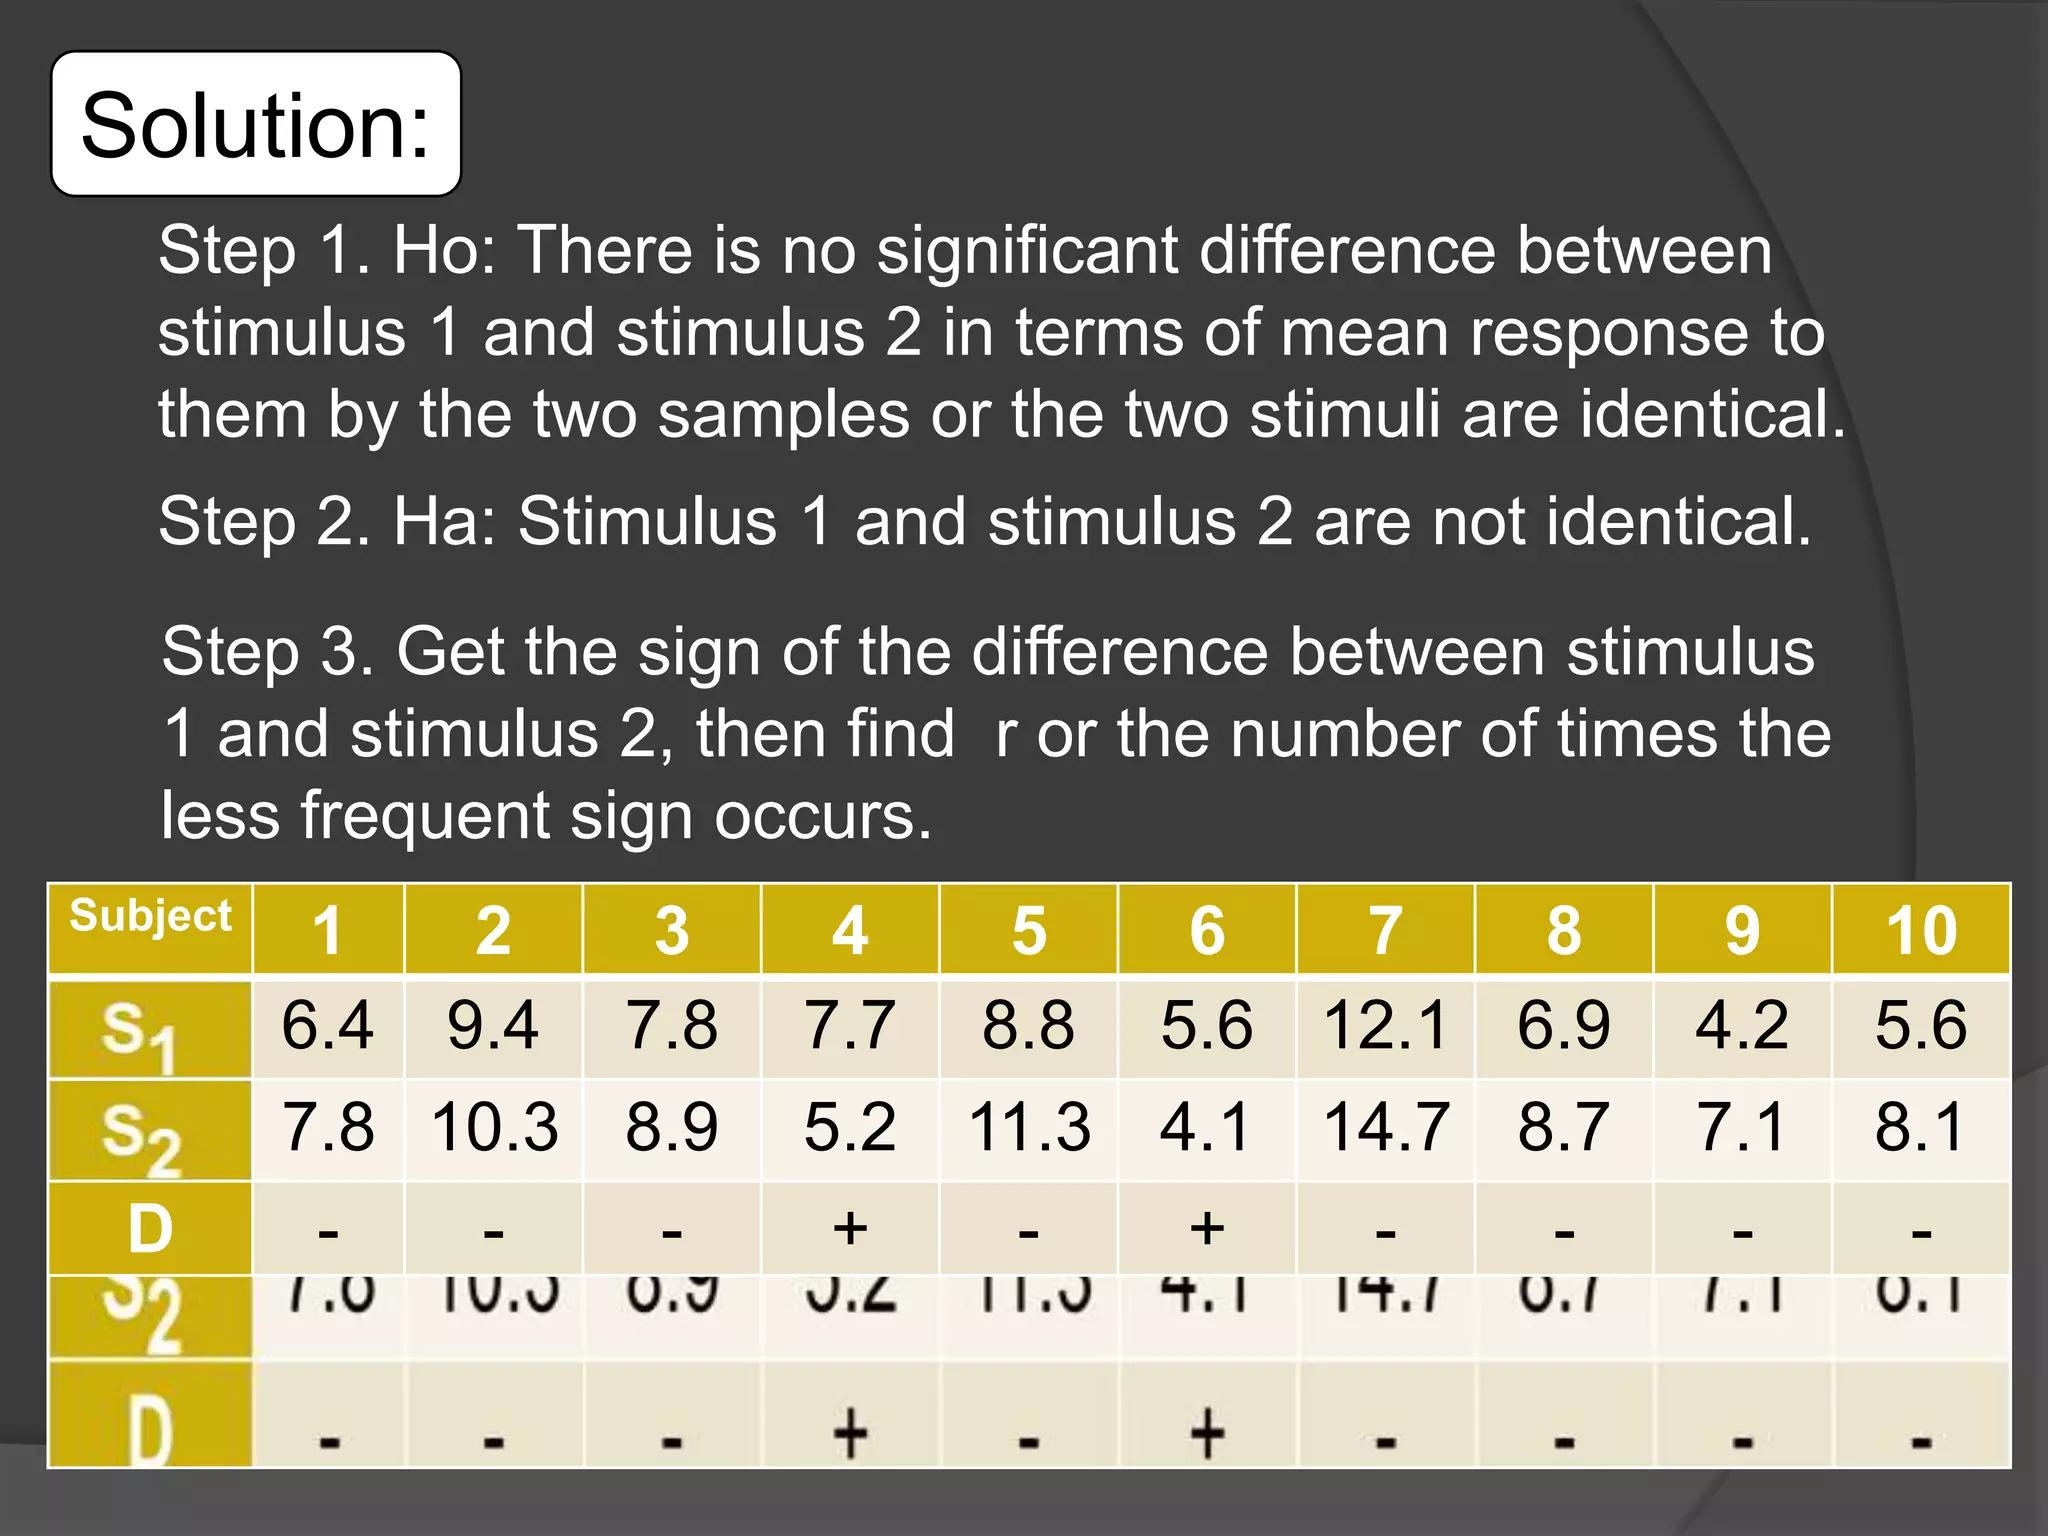
The sign test is used to compare two populations (A and B) by examining pairs of observations from each population. The number of times population A exceeds population B (X) is the test statistic. Under the null hypothesis, the two populations are identical and the probability of A exceeding B is 0.5.
To perform the sign test: (1) assign "+" if A>B, "-" if A<B, discard if equal; (2) count remaining pairs (n) and times the less frequent sign occurs (r); (3) compare r to critical values - if r is below the critical value, reject the null hypothesis that the two populations are identical.
The example tests if there is a
This presentation contains information about Mann Whitney U test, what is it, when to use it and how to use it. I have also put an example so that it may help you to easily understand it.
Please Subscribe to this Channel for more solutions and lectures
http://www.youtube.com/onlineteaching
Chapter 12: Analysis of Variance
12.2: Two-Way ANOVA
Analysis of variance (ANOVA) everything you need to knowStat Analytica
Most of the students may struggle with the analysis of variance (ANOVA). Here in this presentation you can clear all your doubts in analysis of variance with suitable examples.
Correlation- an introduction and application of spearman rank correlation by...Gunjan Verma
this presentation contains the types of correlation, uses, limitations, introduction to spearman rank correlation, and its application. a numerical is also given in the presentation
In Hypothesis testing parametric test is very important. in this ppt you can understand all types of parametric test with assumptions which covers Types of parametric, Z-test, T-test, ANOVA, F-test, Chi-Square test, Meaning of parametric, Fisher, one-sample z-test, Two-sample z-test, Analysis of Variance, two-way ANOVA.
Subscribe to Vision Academy for Video assistance
https://www.youtube.com/channel/UCjzpit_cXjdnzER_165mIiw
Through this ppt you could learn what is Wilcoxon Signed Ranked Test. This will teach you the condition and criteria where it can be run and the way to use the test.
this ppt gives you adequate information about Karl Pearsonscoefficient correlation and its calculation. its the widely used to calculate a relationship between two variables. The correlation shows a specific value of the degree of a linear relationship between the X and Y variables. it is also called as The Karl Pearson‘s product-moment correlation coefficient. the value of r is alwys lies between -1 to +1. + 0.1 shows Lower degree of +ve correlation, +0.8 shows Higher degree of +ve correlation.-0.1 shows Lower degree of -ve correlation. -0.8 shows Higher degree of -ve correlation.
In this document, I have tried to illustrate most of the hypothesis testing like 1 sample,2 samples, etc, which I have covered to analyze the machine learning algorithms. I have focused on Independent statistical testing.
Now the question is why we use statistical testing? the answer is that we use statistical testing for significance analysis of our results, which I am going to deliver
Assessment 3 ContextYou will review the theory, logic, and a.docxgalerussel59292
Assessment 3 Context
You will review the theory, logic, and application of t-tests. The t-test is a basic inferential statistic often reported in psychological research. You will discover that t-tests, as well as analysis of variance (ANOVA), compare group means on some quantitative outcome variable.
Recall that null hypothesis tests are of two types: (1) differences between group means and (2) association between variables. In both cases there is a null hypothesis and an alternative hypothesis. In the group means test, the null hypothesis is that the two groups have equal means, and the alternative hypothesis is that the two groups do not have equal means. In the association between variables type of test, the null hypothesis is that the correlation coefficient between the two variables is zero, and the alternative hypothesis is that the correlation coefficient is not zero.
Notice in each case that the hypotheses are mutually exclusive. If the null is false, the alternative must be true. The purpose of null hypothesis statistical tests is generally to show that the null has a low probability of being true (the p value is less than .05) – low enough that the researcher can legitimately claim it is false. The reason this is done is to support the allegation that the alternative hypothesis is true.
In this context you will be studying the details of the first type of test. This is the test of difference between group means. In variations on this model, the two groups can actually be the same people under different conditions, or one of the groups may be assigned a fixed theoretical value. The main idea is that two mean values are being compared. The two groups each have an average score or mean on some variable. The null hypothesis is that the difference between the means is zero. The alternative hypothesis is that the difference between the means is not zero. Notice that if the null is false, the alternative must be true. It is first instructive to consider some of the details of groups. Means, and difference between them.
Null Hypothesis Significance Test
The most common forms of the Null Hypothesis Significance Test (NHST) are three types of t tests, and the test of significance of a correlation. The NHST also extends to more complex tests, such as ANOVA, which will be discussed separately. Below, the null hypothesis and the alternative hypothesis are given for each of the following tests. It would be a valuable use of your time to commit the information below to memory. Once this is done, then when we refer to the tests later, you will have some structure to make sense of the more detailed explanations.
1. One-sample t test: The question in this test is whether a single sample group mean is significantly different from some stated or fixed theoretical value - the fixed value is called a parameter.
· Null Hypothesis: The difference between the sample group mean and the fixed value is zero in the population.
· Alternative hypothesis: T.
Chapter 11 Chi-Square Tests and ANOVA 359 Chapter .docxbartholomeocoombs
Chapter 11: Chi-Square Tests and ANOVA
359
Chapter 11: Chi-Square and ANOVA Tests
This chapter presents material on three more hypothesis tests. One is used to determine
significant relationship between two qualitative variables, the second is used to determine
if the sample data has a particular distribution, and the last is used to determine
significant relationships between means of 3 or more samples.
Section 11.1: Chi-Square Test for Independence
Remember, qualitative data is where you collect data on individuals that are categories or
names. Then you would count how many of the individuals had particular qualities. An
example is that there is a theory that there is a relationship between breastfeeding and
autism. To determine if there is a relationship, researchers could collect the time period
that a mother breastfed her child and if that child was diagnosed with autism. Then you
would have a table containing this information. Now you want to know if each cell is
independent of each other cell. Remember, independence says that one event does not
affect another event. Here it means that having autism is independent of being breastfed.
What you really want is to see if they are not independent. In other words, does one
affect the other? If you were to do a hypothesis test, this is your alternative hypothesis
and the null hypothesis is that they are independent. There is a hypothesis test for this
and it is called the Chi-Square Test for Independence. Technically it should be called
the Chi-Square Test for Dependence, but for historical reasons it is known as the test for
independence. Just as with previous hypothesis tests, all the steps are the same except for
the assumptions and the test statistic.
Hypothesis Test for Chi-Square Test
1. State the null and alternative hypotheses and the level of significance
Ho : the two variables are independent (this means that the one variable is not
affected by the other)
HA : the two variables are dependent (this means that the one variable is affected
by the other)
Also, state your α level here.
2. State and check the assumptions for the hypothesis test
a. A random sample is taken.
b. Expected frequencies for each cell are greater than or equal to 5 (The expected
frequencies, E, will be calculated later, and this assumption means E ≥ 5 ).
3. Find the test statistic and p-value
Finding the test statistic involves several steps. First the data is collected and
counted, and then it is organized into a table (in a table each entry is called a cell).
These values are known as the observed frequencies, which the symbol for an
observed frequency is O. Each table is made up of rows and columns. Then each
row is totaled to give a row total and each column is totaled to give a column
total.
Chapter 11: Chi-Squared Tests and ANOVA
360
The null hypothesis is that the variables are independent. Using the multiplication.
Please Subscribe to this Channel for more solutions and lectures
http://www.youtube.com/onlineteaching
Elementary Statistics Practice Test 5
Module 5
Chapter 10: Correlation and Regression
Chapter 11: Goodness of Fit and Contingency Tables
Chapter 12: Analysis of Variance
2.0.statistical methods and determination of sample sizesalummkata1
statistical methods and determination of sample size
These guidelines focus on the validation of the bioanalytical methods generating quantitative concentration data used for pharmacokinetic and toxicokinetic parameter determinations.
The Roman Empire A Historical Colossus.pdfkaushalkr1407
The Roman Empire, a vast and enduring power, stands as one of history's most remarkable civilizations, leaving an indelible imprint on the world. It emerged from the Roman Republic, transitioning into an imperial powerhouse under the leadership of Augustus Caesar in 27 BCE. This transformation marked the beginning of an era defined by unprecedented territorial expansion, architectural marvels, and profound cultural influence.
The empire's roots lie in the city of Rome, founded, according to legend, by Romulus in 753 BCE. Over centuries, Rome evolved from a small settlement to a formidable republic, characterized by a complex political system with elected officials and checks on power. However, internal strife, class conflicts, and military ambitions paved the way for the end of the Republic. Julius Caesar’s dictatorship and subsequent assassination in 44 BCE created a power vacuum, leading to a civil war. Octavian, later Augustus, emerged victorious, heralding the Roman Empire’s birth.
Under Augustus, the empire experienced the Pax Romana, a 200-year period of relative peace and stability. Augustus reformed the military, established efficient administrative systems, and initiated grand construction projects. The empire's borders expanded, encompassing territories from Britain to Egypt and from Spain to the Euphrates. Roman legions, renowned for their discipline and engineering prowess, secured and maintained these vast territories, building roads, fortifications, and cities that facilitated control and integration.
The Roman Empire’s society was hierarchical, with a rigid class system. At the top were the patricians, wealthy elites who held significant political power. Below them were the plebeians, free citizens with limited political influence, and the vast numbers of slaves who formed the backbone of the economy. The family unit was central, governed by the paterfamilias, the male head who held absolute authority.
Culturally, the Romans were eclectic, absorbing and adapting elements from the civilizations they encountered, particularly the Greeks. Roman art, literature, and philosophy reflected this synthesis, creating a rich cultural tapestry. Latin, the Roman language, became the lingua franca of the Western world, influencing numerous modern languages.
Roman architecture and engineering achievements were monumental. They perfected the arch, vault, and dome, constructing enduring structures like the Colosseum, Pantheon, and aqueducts. These engineering marvels not only showcased Roman ingenuity but also served practical purposes, from public entertainment to water supply.
Model Attribute Check Company Auto PropertyCeline George
In Odoo, the multi-company feature allows you to manage multiple companies within a single Odoo database instance. Each company can have its own configurations while still sharing common resources such as products, customers, and suppliers.
How to Split Bills in the Odoo 17 POS ModuleCeline George
Bills have a main role in point of sale procedure. It will help to track sales, handling payments and giving receipts to customers. Bill splitting also has an important role in POS. For example, If some friends come together for dinner and if they want to divide the bill then it is possible by POS bill splitting. This slide will show how to split bills in odoo 17 POS.
Instructions for Submissions thorugh G- Classroom.pptxJheel Barad
This presentation provides a briefing on how to upload submissions and documents in Google Classroom. It was prepared as part of an orientation for new Sainik School in-service teacher trainees. As a training officer, my goal is to ensure that you are comfortable and proficient with this essential tool for managing assignments and fostering student engagement.
Synthetic Fiber Construction in lab .pptxPavel ( NSTU)
Synthetic fiber production is a fascinating and complex field that blends chemistry, engineering, and environmental science. By understanding these aspects, students can gain a comprehensive view of synthetic fiber production, its impact on society and the environment, and the potential for future innovations. Synthetic fibers play a crucial role in modern society, impacting various aspects of daily life, industry, and the environment. ynthetic fibers are integral to modern life, offering a range of benefits from cost-effectiveness and versatility to innovative applications and performance characteristics. While they pose environmental challenges, ongoing research and development aim to create more sustainable and eco-friendly alternatives. Understanding the importance of synthetic fibers helps in appreciating their role in the economy, industry, and daily life, while also emphasizing the need for sustainable practices and innovation.
2024.06.01 Introducing a competency framework for languag learning materials ...Sandy Millin
http://sandymillin.wordpress.com/iateflwebinar2024
Published classroom materials form the basis of syllabuses, drive teacher professional development, and have a potentially huge influence on learners, teachers and education systems. All teachers also create their own materials, whether a few sentences on a blackboard, a highly-structured fully-realised online course, or anything in between. Despite this, the knowledge and skills needed to create effective language learning materials are rarely part of teacher training, and are mostly learnt by trial and error.
Knowledge and skills frameworks, generally called competency frameworks, for ELT teachers, trainers and managers have existed for a few years now. However, until I created one for my MA dissertation, there wasn’t one drawing together what we need to know and do to be able to effectively produce language learning materials.
This webinar will introduce you to my framework, highlighting the key competencies I identified from my research. It will also show how anybody involved in language teaching (any language, not just English!), teacher training, managing schools or developing language learning materials can benefit from using the framework.
We all have good and bad thoughts from time to time and situation to situation. We are bombarded daily with spiraling thoughts(both negative and positive) creating all-consuming feel , making us difficult to manage with associated suffering. Good thoughts are like our Mob Signal (Positive thought) amidst noise(negative thought) in the atmosphere. Negative thoughts like noise outweigh positive thoughts. These thoughts often create unwanted confusion, trouble, stress and frustration in our mind as well as chaos in our physical world. Negative thoughts are also known as “distorted thinking”.
The French Revolution, which began in 1789, was a period of radical social and political upheaval in France. It marked the decline of absolute monarchies, the rise of secular and democratic republics, and the eventual rise of Napoleon Bonaparte. This revolutionary period is crucial in understanding the transition from feudalism to modernity in Europe.
For more information, visit-www.vavaclasses.com
Palestine last event orientationfvgnh .pptxRaedMohamed3
An EFL lesson about the current events in Palestine. It is intended to be for intermediate students who wish to increase their listening skills through a short lesson in power point.
How to Make a Field invisible in Odoo 17Celine George
It is possible to hide or invisible some fields in odoo. Commonly using “invisible” attribute in the field definition to invisible the fields. This slide will show how to make a field invisible in odoo 17.
Students, digital devices and success - Andreas Schleicher - 27 May 2024..pptxEduSkills OECD
Andreas Schleicher presents at the OECD webinar ‘Digital devices in schools: detrimental distraction or secret to success?’ on 27 May 2024. The presentation was based on findings from PISA 2022 results and the webinar helped launch the PISA in Focus ‘Managing screen time: How to protect and equip students against distraction’ https://www.oecd-ilibrary.org/education/managing-screen-time_7c225af4-en and the OECD Education Policy Perspective ‘Students, digital devices and success’ can be found here - https://oe.cd/il/5yV
Students, digital devices and success - Andreas Schleicher - 27 May 2024..pptx
The Sign Test
1.
2. The sign test is used to determine if there is a
significant difference between the mean characteristics of two
populations (say A and B). Responses on each pair of A and B
are compared. The number of times A exceeded B is used as
the test statistic. It is denoted as the letter X. This is called the
sign test because X is the number of positive (or negative)
signs associated with the difference between the pairs in
population A and B.
In such cases, the implied null hypothesis is that the two
population distributions are identical or there is no significant
difference between the two population distributions A and B.
For any given pair, the probability that A exceeds B is p=0.5
when the null hypothesis is true.
3. The following are the steps in doing the sign test:
a. State the null hypothesis.
Ho : There is no significant difference between the two
populations being compared.
b. State the alternative hypothesis.
HA : There is a significant difference between the two populations
being compared.
c. Test the null hypothesis using the following procedure.
1. Examine each pair (A and B) of observations. If A>B, assign
a plus (+) sign, if A<B, assign a minus (-) sign, if A=B,
the pair must be discard.
2. Count the number of pairs remaining and denote it by n.
3. Count the number of times the less frequent sign occurs
and denote this by r.
d. To test the null hypothesis, compare r with the critical values tabulated
n the table for critical values of r for the sign test in the Appendix.
e. Make your decision. If r is less than or equal to the tabulated value for
the chosen significance level, reject the null hypothesis.
4. Example:
The response time, in seconds, for two
different stimuli (S1 and S2) were recorded for 10
subjects who participated in a psychological
experiment. The following data were obtained.
Subject
S1
S2
1
2
3
6.4 9.4 7.8
7.8 10.3 8.9
4
7.7
5.2
5
8.8
11.3
6
7
8
5.6 12.1 6.9
4.1 14.7 8.7
9
4.2
7.1
10
5.6
8.1
Use the sign test to test the null hypothesis that
state that there is no significant difference between
stimulus 1 and stimulus 2 in terms of mean
response to them by the subjects.
5. Solution:
Step 1. Ho: There is no significant difference between
stimulus 1 and stimulus 2 in terms of mean response to
them by the two samples or the two stimuli are identical.
Step 2. Ha: Stimulus 1 and stimulus 2 are not identical.
Step 3. Get the sign of the difference between stimulus
1 and stimulus 2, then find r or the number of times the
less frequent sign occurs.
Subject
D
1
2
3
6.4 9.4 7.8
7.8 10.3 8.9
-
4
5
6
7
8
7.7 8.8 5.6 12.1 6.9
5.2 11.3 4.1 14.7 8.7
+
+
-
9
4.2
7.1
-
10
5.6
8.1
-
6. Step 4. Compare r=2 to the critical value of r.
Step 5. Make the decision. Since r=2 is
greater than rcritical =1, Ho is not rejected.
There is no significant difference between the
two stimuli in terms of the reaction time of the
subjects on them.