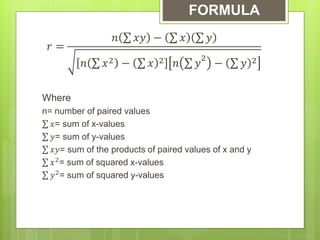
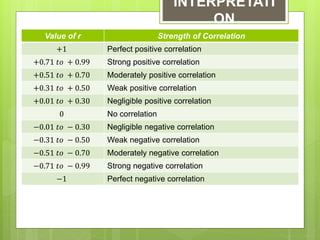
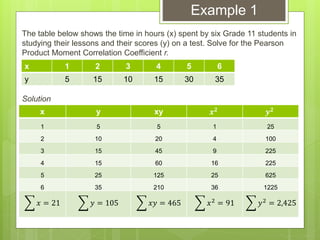
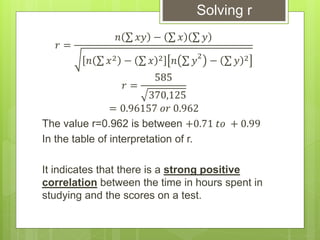
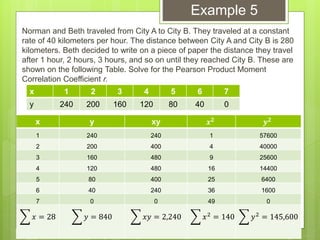
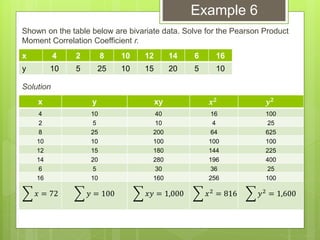
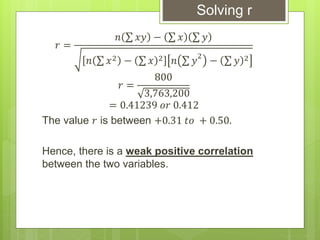
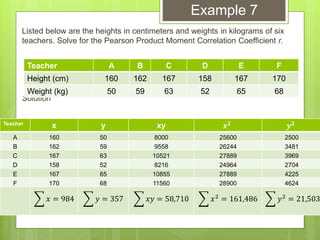
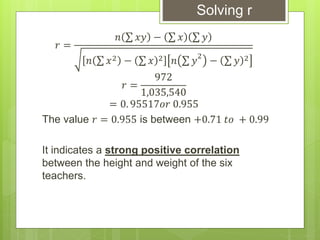
The document provides examples for calculating the Pearson Product Moment Correlation Coefficient (r) from bivariate data. It defines r as a measure of the strength of the linear relationship between two variables. Several fully worked examples are shown calculating r from tables of paired data and interpreting the resulting r value based on established thresholds for strength of correlation. Formulas and steps for calculating r are demonstrated throughout.
Contents:
1. Geometric Sequence
2. Geometric Means
3. Geometric Series
with activities
Feel free to send me a message at regie.naungayan@deped.gov.ph for corrections or other suggestions
Contents:
1. Geometric Sequence
2. Geometric Means
3. Geometric Series
with activities
Feel free to send me a message at regie.naungayan@deped.gov.ph for corrections or other suggestions
Finding the relationship between two quantitative variables without being able to infer causal relationships
Correlation is a statistical technique used to determine the degree to which two variables are related
Regression analysis is a mathematical measure of the average relationship between two or more variables in terms of the original units of the data.
In regression analysis there are two types of variables. The variable whose value is influenced or is to be predicted is called dependent variable and the variable which influences the values or is used for prediction, is called independent variable.
In regression analysis independent variable is also known as regressor or predictor or explanatory variable while the dependent variable is also known as regressed or explained variable.
Please Subscribe to this Channel for more solutions and lectures
http://www.youtube.com/onlineteaching
Chapter 10: Correlation and Regression
10.2: Regression
1. Illustrate the t-distribution.
2. Construct the t-distribution.
3. Identify regions under the t-distribution corresponding to different values.
4. Identify percentiles using the t-table.
Visit the website for more services it can offer: https://cristinamontenegro92.wixsite.com/onevs
1. Illustrate point and interval estimations.
2. Distinguish between point and interval estimation.
Visit the website for more services it can offer:
https://cristinamontenegro92.wixsite.com/onevs
Distinguish between Parameter and Statistic.
Calculate sample variance and sample standard deviation.
Visit the website for more services: https://cristinamontenegro92.wixsite.com/onevs
Know the types of Random Sampling method and how it is being used.
Simple random sampling
Systematic sampling
Stratified Sampling
Cluster or Area sampling
Visit the website for more services: https://cristinamontenegro92.wixsite.com/onevs
Convert a normal random variable to a standard normal variable and vice versa.
Compute probabilities and percentiles using the standard normal table.
Visit the website for more services: https://cristinamontenegro92.wixsite.com/onevs
Determining the Mean, Variance, and Standard Deviation of a Discrete Random Variable
Visit the website for more services: https://cristinamontenegro92.wixsite.com/onevs
Illustrate the nature of bivariate data;
Construct a scatter plot;
Describe shapes (form), trend (direction), and variation (strength) based on the scatter plot; and
Estimate strength of association between the variables based on a scatter plot.
Visit the website for other Services: https://cristinamontenegro92.wixsite.com/onevs
1. Illustrate:
Null hypothesis
Alternative hypothesis
Level of significance
Rejection region; and
Types of error in hypothesis testing
2. Calculate the probabilities of commanding a Type I and Type II error.
Visit the website for more Services it can offer: https://cristinamontenegro92.wixsite.com/onevs
Identify the independent and dependent variable;
Draw the best fit line on a scatter plot;
Calculate the slope and the y-intercept of the regression line;
Interpret the calculated slope and the y-intercept of the regression line;
Predict the value of the dependent variable given the value of the independent variable; and
Solve problems involving regression analysis.
Visit the Website for more Services it can offer:
https://cristinamontenegro92.wixsite.com/onevs
Introduction to AI for Nonprofits with Tapp NetworkTechSoup
Dive into the world of AI! Experts Jon Hill and Tareq Monaur will guide you through AI's role in enhancing nonprofit websites and basic marketing strategies, making it easy to understand and apply.
Welcome to TechSoup New Member Orientation and Q&A (May 2024).pdfTechSoup
In this webinar you will learn how your organization can access TechSoup's wide variety of product discount and donation programs. From hardware to software, we'll give you a tour of the tools available to help your nonprofit with productivity, collaboration, financial management, donor tracking, security, and more.
Palestine last event orientationfvgnh .pptxRaedMohamed3
An EFL lesson about the current events in Palestine. It is intended to be for intermediate students who wish to increase their listening skills through a short lesson in power point.
A Strategic Approach: GenAI in EducationPeter Windle
Artificial Intelligence (AI) technologies such as Generative AI, Image Generators and Large Language Models have had a dramatic impact on teaching, learning and assessment over the past 18 months. The most immediate threat AI posed was to Academic Integrity with Higher Education Institutes (HEIs) focusing their efforts on combating the use of GenAI in assessment. Guidelines were developed for staff and students, policies put in place too. Innovative educators have forged paths in the use of Generative AI for teaching, learning and assessments leading to pockets of transformation springing up across HEIs, often with little or no top-down guidance, support or direction.
This Gasta posits a strategic approach to integrating AI into HEIs to prepare staff, students and the curriculum for an evolving world and workplace. We will highlight the advantages of working with these technologies beyond the realm of teaching, learning and assessment by considering prompt engineering skills, industry impact, curriculum changes, and the need for staff upskilling. In contrast, not engaging strategically with Generative AI poses risks, including falling behind peers, missed opportunities and failing to ensure our graduates remain employable. The rapid evolution of AI technologies necessitates a proactive and strategic approach if we are to remain relevant.
Read| The latest issue of The Challenger is here! We are thrilled to announce that our school paper has qualified for the NATIONAL SCHOOLS PRESS CONFERENCE (NSPC) 2024. Thank you for your unwavering support and trust. Dive into the stories that made us stand out!
2024.06.01 Introducing a competency framework for languag learning materials ...Sandy Millin
http://sandymillin.wordpress.com/iateflwebinar2024
Published classroom materials form the basis of syllabuses, drive teacher professional development, and have a potentially huge influence on learners, teachers and education systems. All teachers also create their own materials, whether a few sentences on a blackboard, a highly-structured fully-realised online course, or anything in between. Despite this, the knowledge and skills needed to create effective language learning materials are rarely part of teacher training, and are mostly learnt by trial and error.
Knowledge and skills frameworks, generally called competency frameworks, for ELT teachers, trainers and managers have existed for a few years now. However, until I created one for my MA dissertation, there wasn’t one drawing together what we need to know and do to be able to effectively produce language learning materials.
This webinar will introduce you to my framework, highlighting the key competencies I identified from my research. It will also show how anybody involved in language teaching (any language, not just English!), teacher training, managing schools or developing language learning materials can benefit from using the framework.
Unit 8 - Information and Communication Technology (Paper I).pdfThiyagu K
This slides describes the basic concepts of ICT, basics of Email, Emerging Technology and Digital Initiatives in Education. This presentations aligns with the UGC Paper I syllabus.
Francesca Gottschalk - How can education support child empowerment.pptxEduSkills OECD
Francesca Gottschalk from the OECD’s Centre for Educational Research and Innovation presents at the Ask an Expert Webinar: How can education support child empowerment?
June 3, 2024 Anti-Semitism Letter Sent to MIT President Kornbluth and MIT Cor...Levi Shapiro
Letter from the Congress of the United States regarding Anti-Semitism sent June 3rd to MIT President Sally Kornbluth, MIT Corp Chair, Mark Gorenberg
Dear Dr. Kornbluth and Mr. Gorenberg,
The US House of Representatives is deeply concerned by ongoing and pervasive acts of antisemitic
harassment and intimidation at the Massachusetts Institute of Technology (MIT). Failing to act decisively to ensure a safe learning environment for all students would be a grave dereliction of your responsibilities as President of MIT and Chair of the MIT Corporation.
This Congress will not stand idly by and allow an environment hostile to Jewish students to persist. The House believes that your institution is in violation of Title VI of the Civil Rights Act, and the inability or
unwillingness to rectify this violation through action requires accountability.
Postsecondary education is a unique opportunity for students to learn and have their ideas and beliefs challenged. However, universities receiving hundreds of millions of federal funds annually have denied
students that opportunity and have been hijacked to become venues for the promotion of terrorism, antisemitic harassment and intimidation, unlawful encampments, and in some cases, assaults and riots.
The House of Representatives will not countenance the use of federal funds to indoctrinate students into hateful, antisemitic, anti-American supporters of terrorism. Investigations into campus antisemitism by the Committee on Education and the Workforce and the Committee on Ways and Means have been expanded into a Congress-wide probe across all relevant jurisdictions to address this national crisis. The undersigned Committees will conduct oversight into the use of federal funds at MIT and its learning environment under authorities granted to each Committee.
• The Committee on Education and the Workforce has been investigating your institution since December 7, 2023. The Committee has broad jurisdiction over postsecondary education, including its compliance with Title VI of the Civil Rights Act, campus safety concerns over disruptions to the learning environment, and the awarding of federal student aid under the Higher Education Act.
• The Committee on Oversight and Accountability is investigating the sources of funding and other support flowing to groups espousing pro-Hamas propaganda and engaged in antisemitic harassment and intimidation of students. The Committee on Oversight and Accountability is the principal oversight committee of the US House of Representatives and has broad authority to investigate “any matter” at “any time” under House Rule X.
• The Committee on Ways and Means has been investigating several universities since November 15, 2023, when the Committee held a hearing entitled From Ivory Towers to Dark Corners: Investigating the Nexus Between Antisemitism, Tax-Exempt Universities, and Terror Financing. The Committee followed the hearing with letters to those institutions on January 10, 202
2. Learning Competencies
The learner will be able to:
1. Calculate the Pearson Product Moment
Correlation Coefficient; and
2. Solve problems involving correlation
analysis.
3. In the previous lesson on scatter plots, the degree or
strength of relationship between the two variables was not
numerically measured. The strength of relationship was only
estimated and described visually based on the dots plotted on
the xy coordinate plane.
The Pearson Product Moment Correlation Coefficient,
denoted by r, measures the strength of the linear
relationship.
4. 𝑟 =
𝑛 𝑥𝑦 − 𝑥 𝑦
𝑛 𝑥2 − 𝑥 2 𝑛 𝑦
2
− 𝑦 2
Where
n= number of paired values
𝑥= sum of x-values
𝑦= sum of y-values
𝑥𝑦= sum of the products of paired values of x and y
𝑥2
= sum of squared x-values
𝑦2= sum of squared y-values
FORMULA
6. The table below shows the time in hours (x) spent by six Grade 11 students in
studying their lessons and their scores (y) on a test. Solve for the Pearson
Product Moment Correlation Coefficient r.
Solution
x 1 2 3 4 5 6
y 5 15 10 15 30 35
x y xy 𝒙𝟐 𝒚𝟐
1 5 5 1 25
2 10 20 4 100
3 15 45 9 225
4 15 60 16 225
5 25 125 25 625
6 35 210 36 1225
𝑥 = 21 𝑦 = 105 𝑥𝑦 = 465 𝑥2
= 91 𝑦2
= 2,425
Example 1
7. 𝑟 =
𝑛 𝑥𝑦 − 𝑥 𝑦
𝑛 𝑥2 − 𝑥 2 𝑛 𝑦
2
− 𝑦 2
𝑟 =
585
370,125
= 0.96157 𝑜𝑟 0.962
The value r=0.962 is between +0.71 𝑡𝑜 + 0.99
In the table of interpretation of r.
It indicates that there is a strong positive
correlation between the time in hours spent in
studying and the scores on a test.
Solving r
9. The table below shows the time in hours (x) spent by six Grade 11 students in
playing computer games and the scores these students got on a math test (y).
Solve for the Pearson Product Moment Correlation Coefficient r.
Solution
x 1 2 3 4 5 6
y 30 25 25 10 15 5
x y xy 𝒙𝟐 𝒚𝟐
1 30 30 1 900
2 25 50 4 625
3 25 75 9 625
4 10 40 16 100
5 15 75 25 225
6 5 30 36 25
𝑥 = 21 𝑦 = 110 𝑥𝑦 = 300 𝑥2
= 91 𝑦2
= 2,500
Example 2
10. 𝑟 =
𝑛 𝑥𝑦 − 𝑥 𝑦
𝑛 𝑥2 − 𝑥 2 𝑛 𝑦
2
− 𝑦 2
𝑟 =
−510
304,500
= −0.92422 𝑜𝑟 − 0.924
The value 𝑟 = −0.924 is between−0.71 𝑡𝑜 − 0.99
In the table of interpretation of r.
It indicates that there is a strong negative
correlation between the time spent in playing
computer games and the scores on a test.
Solving r
12. The table below shows the number of selfies (x) posted online of students and
the scores (y) they obtained from a Science test. Solve for the Pearson Product
Moment Correlation Coefficient r.
Solution
x 1 2 3 4 5 6
y 25 5 20 40 25 9
x y xy 𝒙𝟐 𝒚𝟐
1 25 25 1 625
2 5 10 4 25
3 20 60 9 400
4 40 160 16 1600
5 25 125 25 625
6 9 54 36 81
𝑥 = 21 𝑦 = 124 𝑥𝑦 = 434 𝑥2
= 91 𝑦2
= 3,356
Example 3
13. 𝑟 =
𝑛 𝑥𝑦 − 𝑥 𝑦
𝑛 𝑥2 − 𝑥 2 𝑛 𝑦
2
− 𝑦 2
𝑟 =
0
499,800
= 0
The value 𝑟 = 0.
It indicates that there is no correlation
between the number of selfies posted online
and the scores obtained from a Science test.
Solving r
15. The table below shows the number of composition notebooks and the
corresponding costs. The cost per composition notebook is Php 25. Solve for
the Pearson Product Moment Correlation Coefficient r.
Solution
x 1 2 3 4 5 6
y 25 50 75 100 125 150
x y xy 𝒙𝟐 𝒚𝟐
1 25 25 1 625
2 50 100 4 2500
3 75 225 9 5625
4 100 400 16 10000
5 125 625 25 15625
6 150 900 36 22500
𝑥 = 21 𝑦 = 525 𝑥𝑦 = 2,275 𝑥2
= 91 𝑦2
= 56,875
Example 4
16. 𝑟 =
𝑛 𝑥𝑦 − 𝑥 𝑦
𝑛 𝑥2 − 𝑥 2 𝑛 𝑦
2
− 𝑦 2
𝑟 =
2,625
6,890,625
= 1
The value 𝑟 = 1.
It indicates that there is a perfect positive
correlation between the two variables.
Solving r
18. Norman and Beth traveled from City A to City B. They traveled at a constant
rate of 40 kilometers per hour. The distance between City A and City B is 280
kilometers. Beth decided to write on a piece of paper the distance they travel
after 1 hour, 2 hours, 3 hours, and so on until they reached City B. These are
shown on the following Table. Solve for the Pearson Product Moment
Correlation Coefficient r.
Solution
x 1 2 3 4 5 6 7
y 240 200 160 120 80 40 0
x y xy 𝒙𝟐 𝒚𝟐
1 240 240 1 57600
2 200 400 4 40000
3 160 480 9 25600
4 120 480 16 14400
5 80 400 25 6400
6 40 240 36 1600
7 0 0 49 0
𝑥 = 28 𝑦 = 840 𝑥𝑦 = 2,240 𝑥2
= 140 𝑦2
= 145,600
Example 5
19. 𝑟 =
𝑛 𝑥𝑦 − 𝑥 𝑦
𝑛 𝑥2 − 𝑥 2 𝑛 𝑦
2
− 𝑦 2
𝑟 =
−7,840
61,465,600
= −1
The value 𝑟 = −1.
It indicates that there is a perfect negative
correlation between the two variables.
Solving r
21. Shown on the table below are bivariate data. Solve for the Pearson Product
Moment Correlation Coefficient r.
Solution
x 4 2 8 10 12 14 6 16
y 10 5 25 10 15 20 5 10
x y xy 𝒙𝟐
𝒚𝟐
4 10 40 16 100
2 5 10 4 25
8 25 200 64 625
10 10 100 100 100
12 15 180 144 225
14 20 280 196 400
6 5 30 36 25
16 10 160 256 100
𝑥 = 72 𝑦 = 100 𝑥𝑦 = 1,000 𝑥2
= 816 𝑦2
= 1,600
Example 6
22. 𝑟 =
𝑛 𝑥𝑦 − 𝑥 𝑦
𝑛 𝑥2 − 𝑥 2 𝑛 𝑦
2
− 𝑦 2
𝑟 =
800
3,763,200
= 0.41239 𝑜𝑟 0.412
The value 𝑟 is between +0.31 𝑡𝑜 + 0.50.
Hence, there is a weak positive correlation
between the two variables.
Solving r
24. Listed below are the heights in centimeters and weights in kilograms of six
teachers. Solve for the Pearson Product Moment Correlation Coefficient r.
Solution
Teacher A B C D E F
Height (cm) 160 162 167 158 167 170
Weight (kg) 50 59 63 52 65 68
Teacher x y xy 𝒙𝟐 𝒚𝟐
A 160 50 8000 25600 2500
B 162 59 9558 26244 3481
C 167 63 10521 27889 3969
D 158 52 8216 24964 2704
E 167 65 10855 27889 4225
F 170 68 11560 28900 4624
𝑥 = 984 𝑦 = 357 𝑥𝑦 = 58,710 𝑥2
= 161,486 𝑦2
= 21,503
Example 7
25. 𝑟 =
𝑛 𝑥𝑦 − 𝑥 𝑦
𝑛 𝑥2 − 𝑥 2 𝑛 𝑦
2
− 𝑦 2
𝑟 =
972
1,035,540
= 0. 95517𝑜𝑟 0.955
The value 𝑟 = 0.955 is between +0.71 𝑡𝑜 + 0.99
It indicates a strong positive correlation
between the height and weight of the six
teachers.
Solving r