Download to read offline

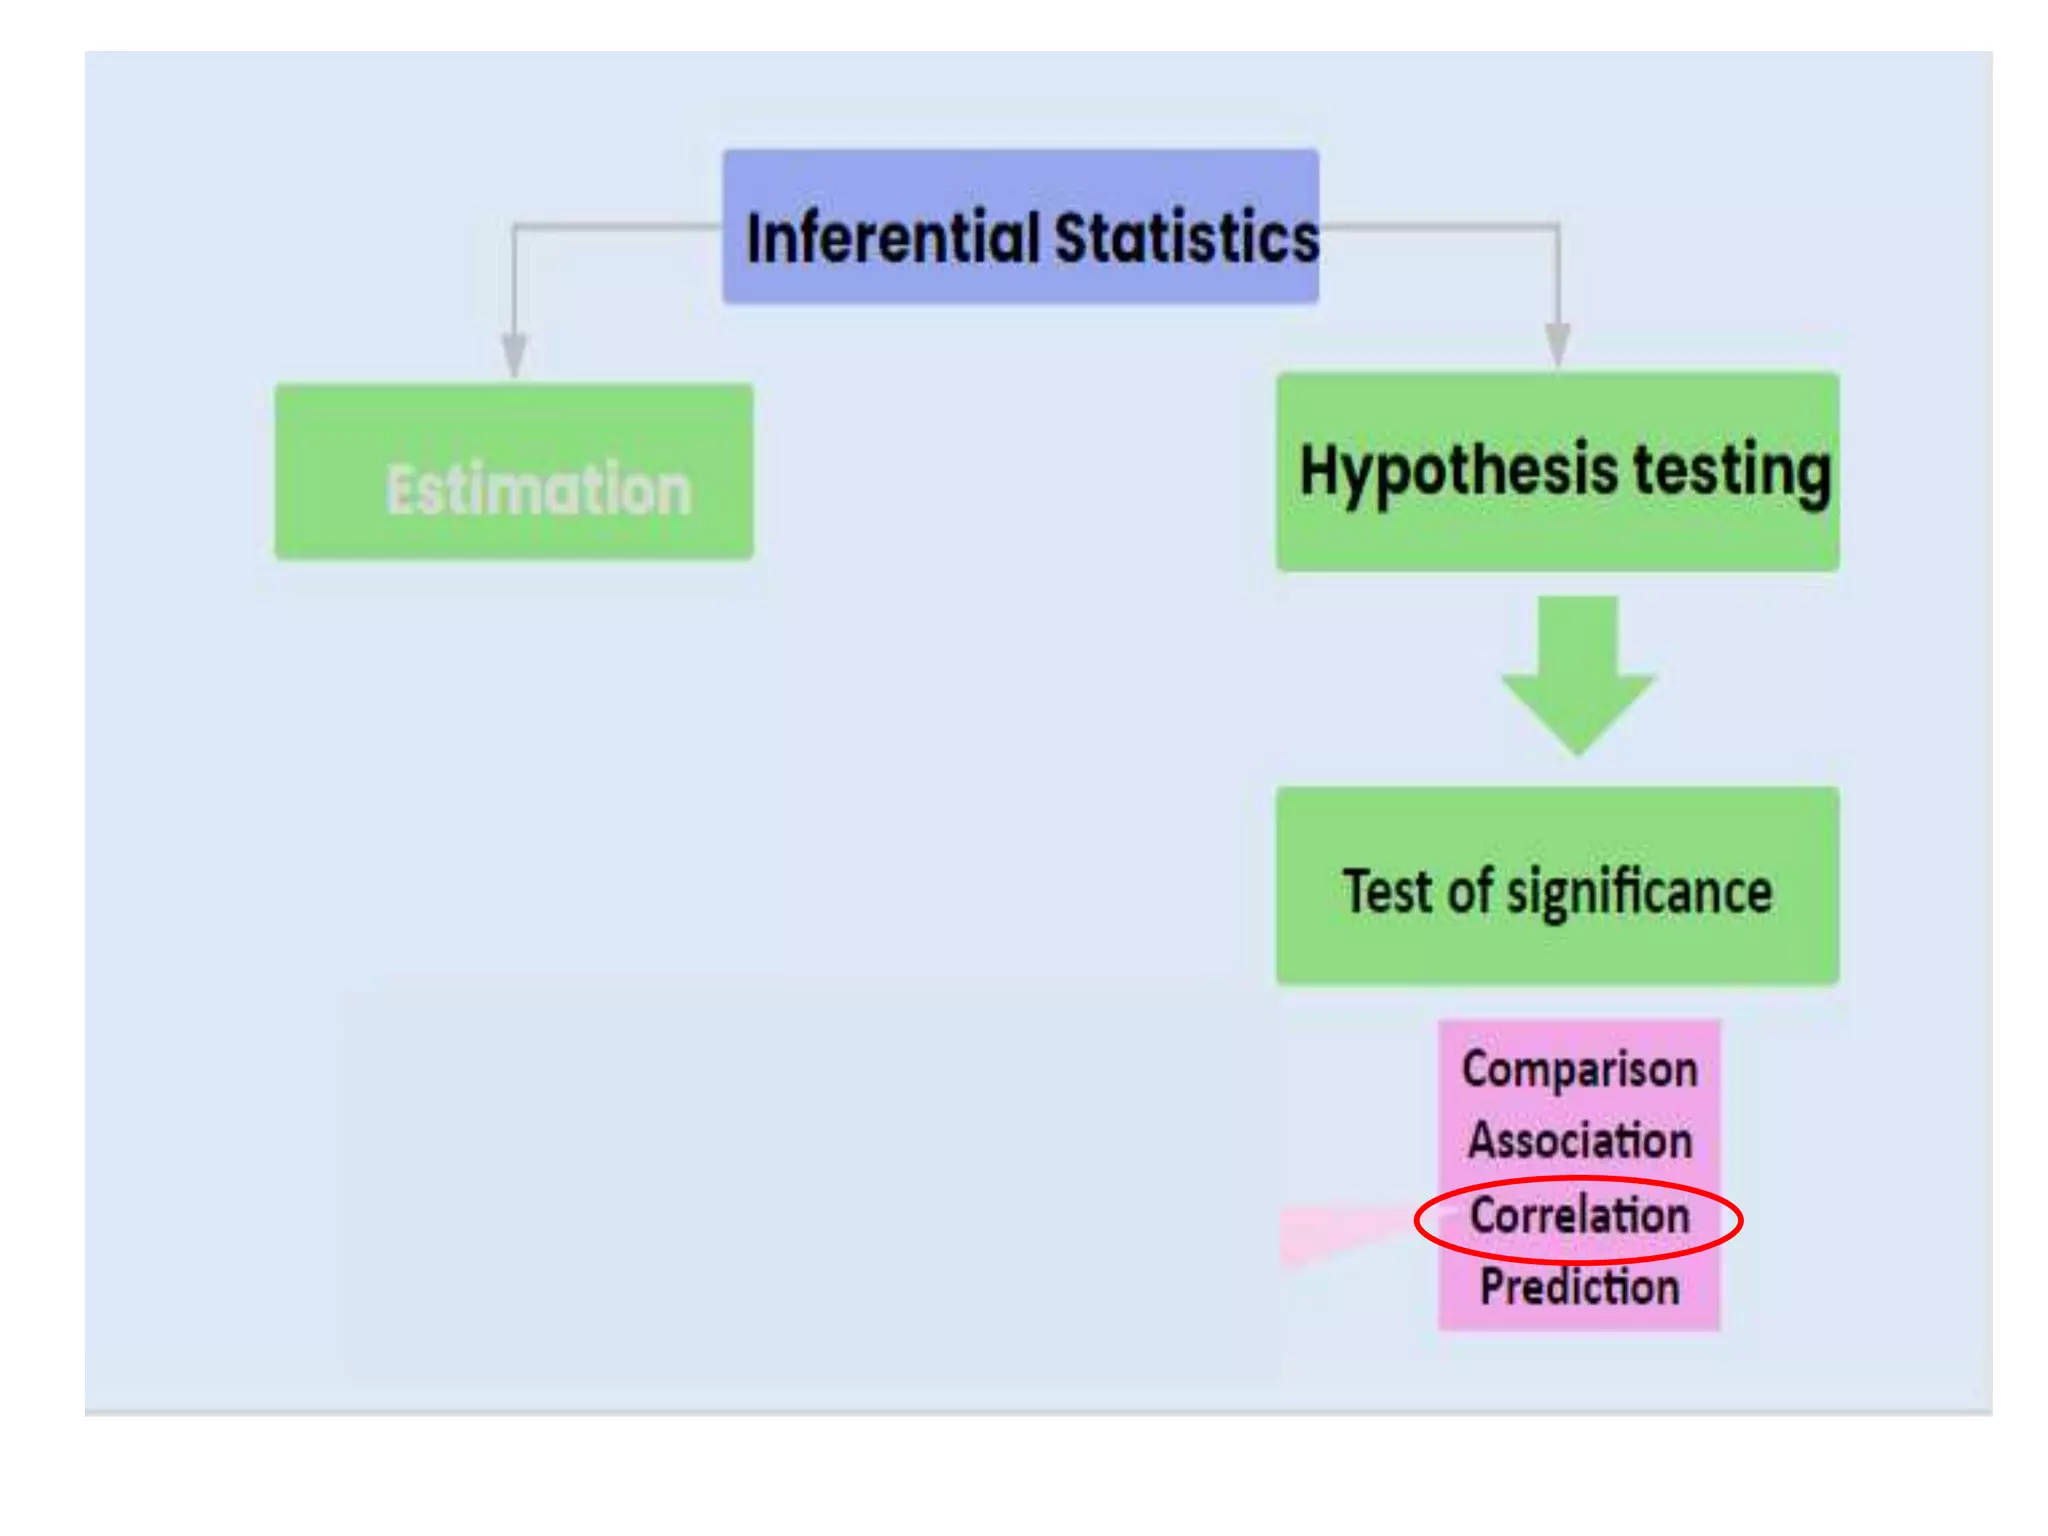

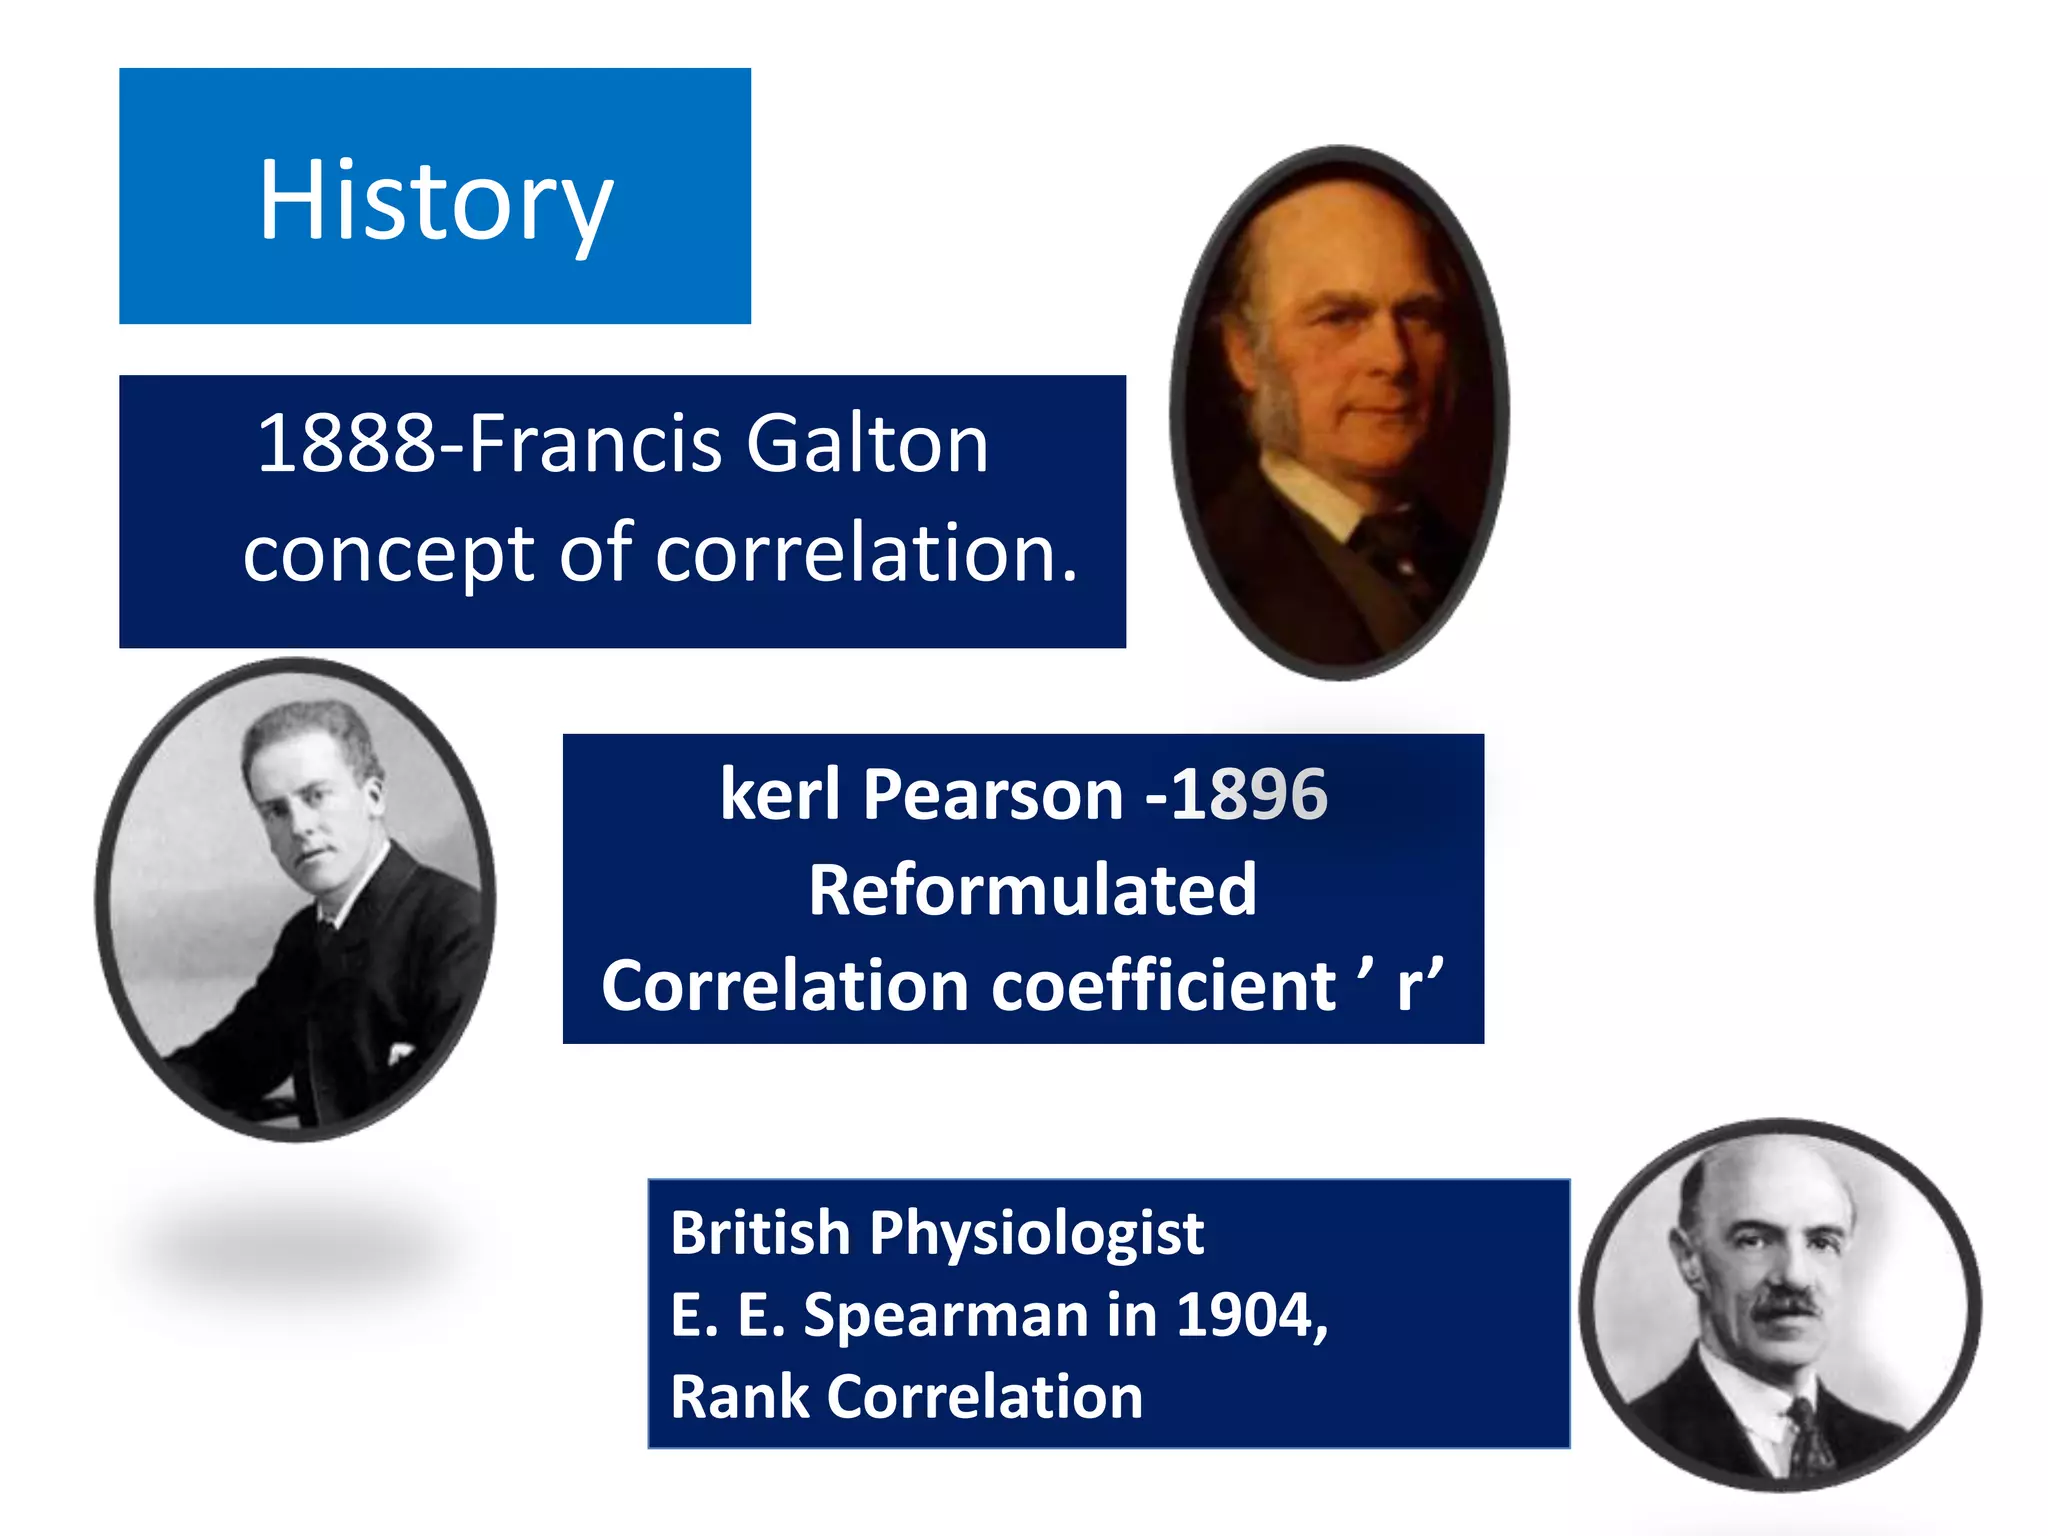

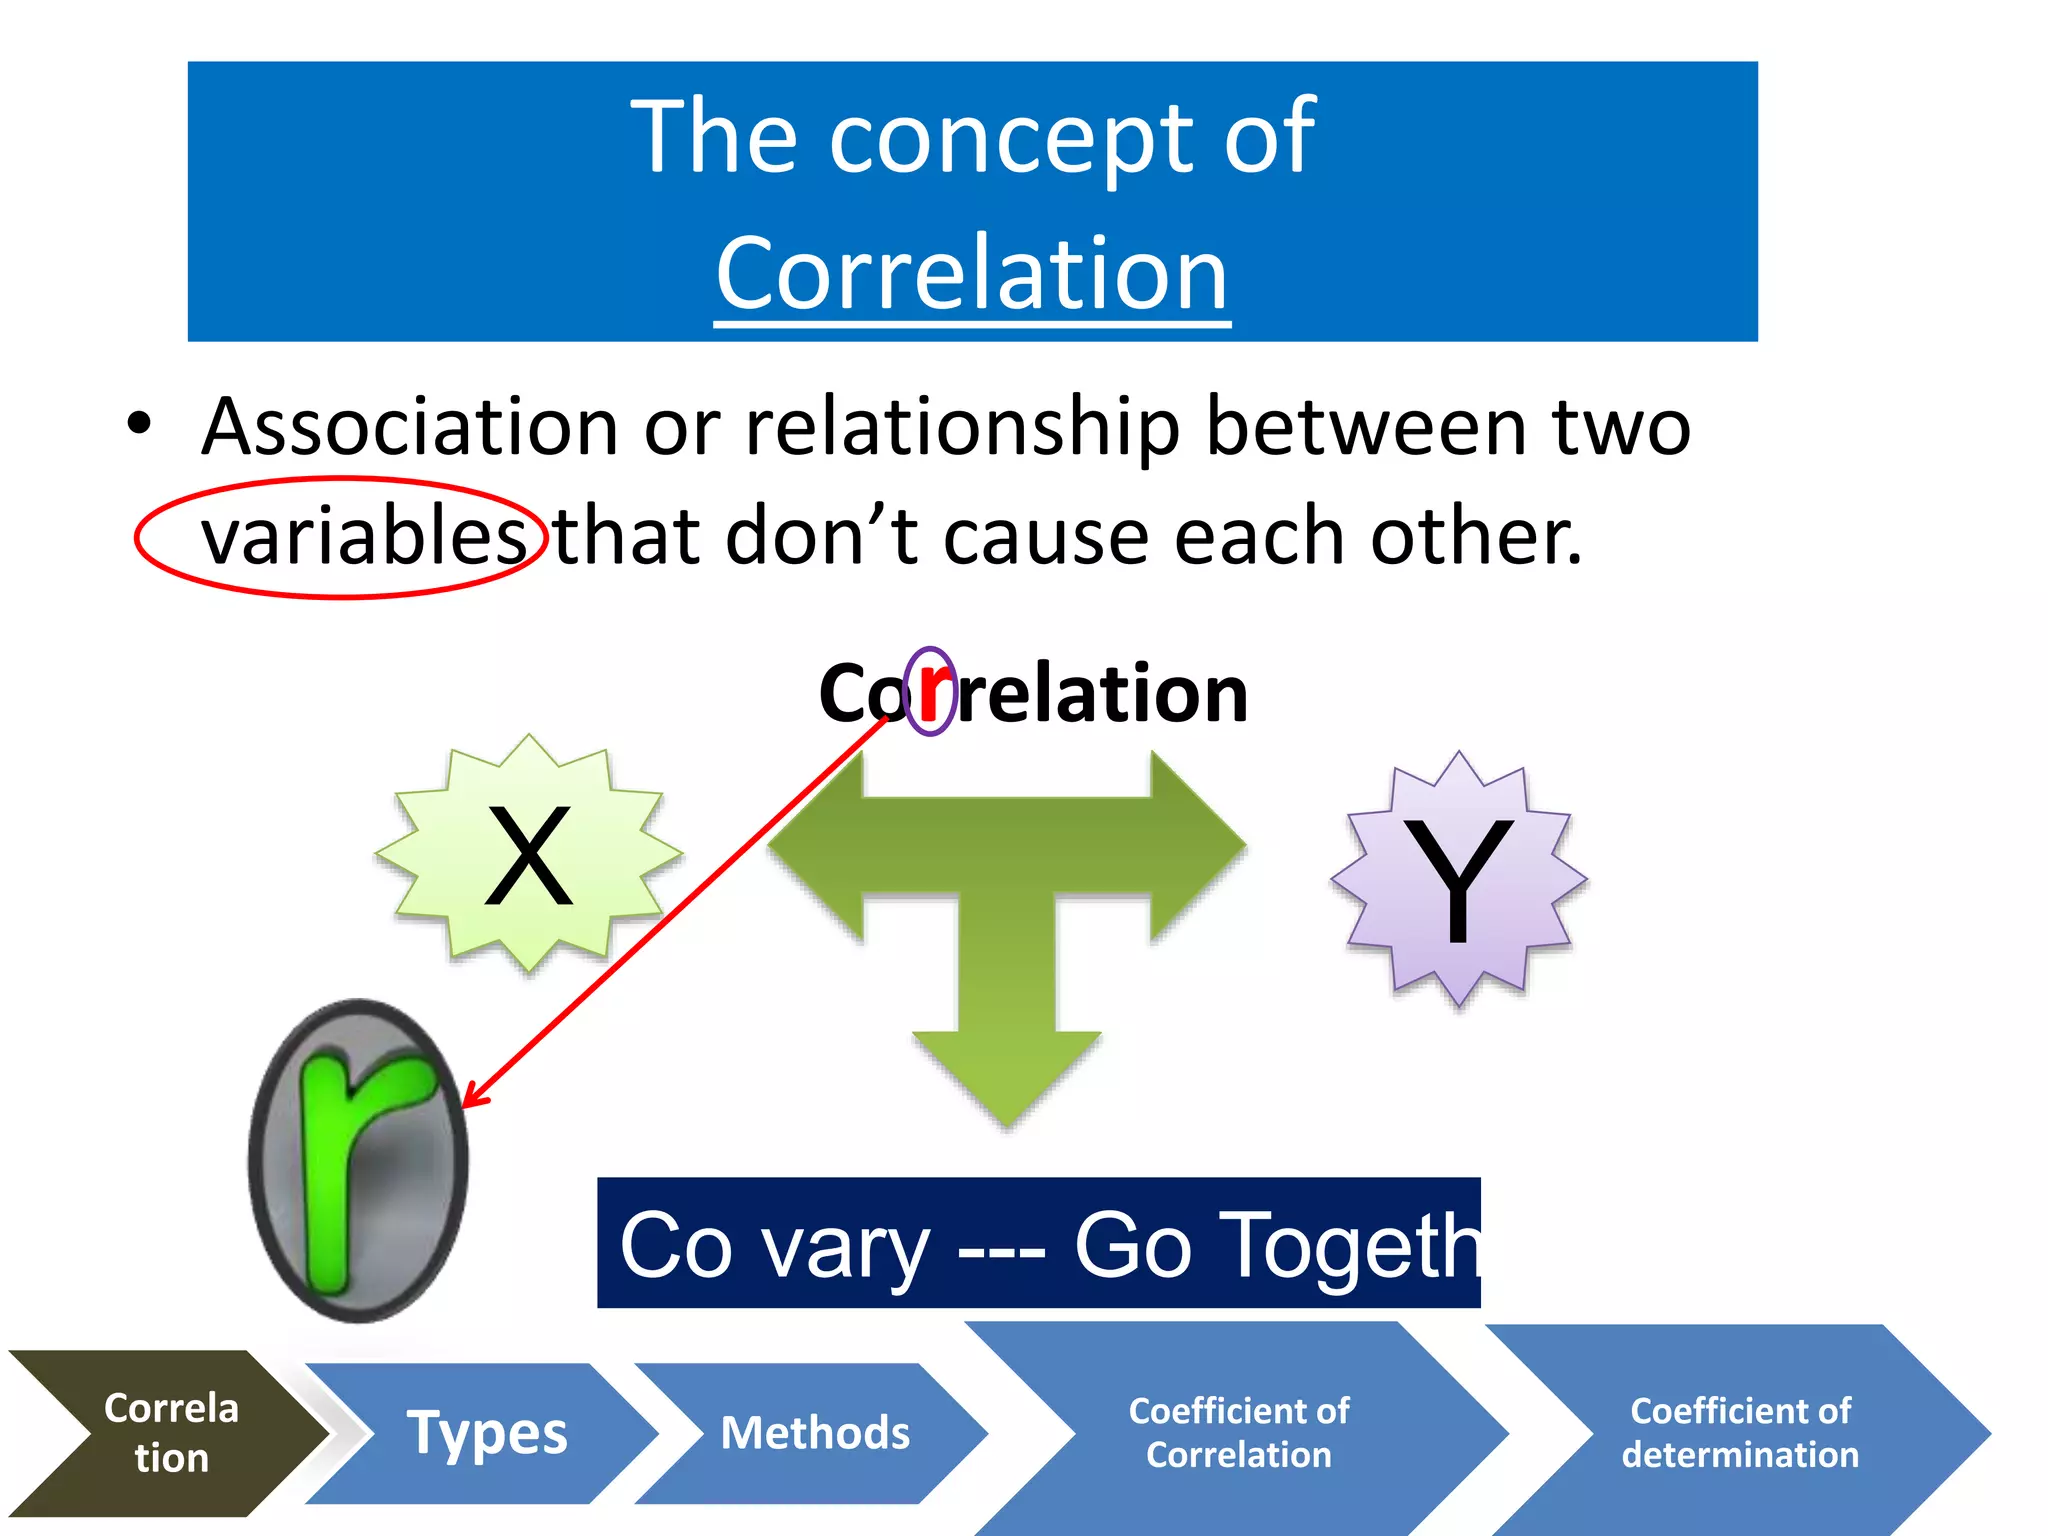


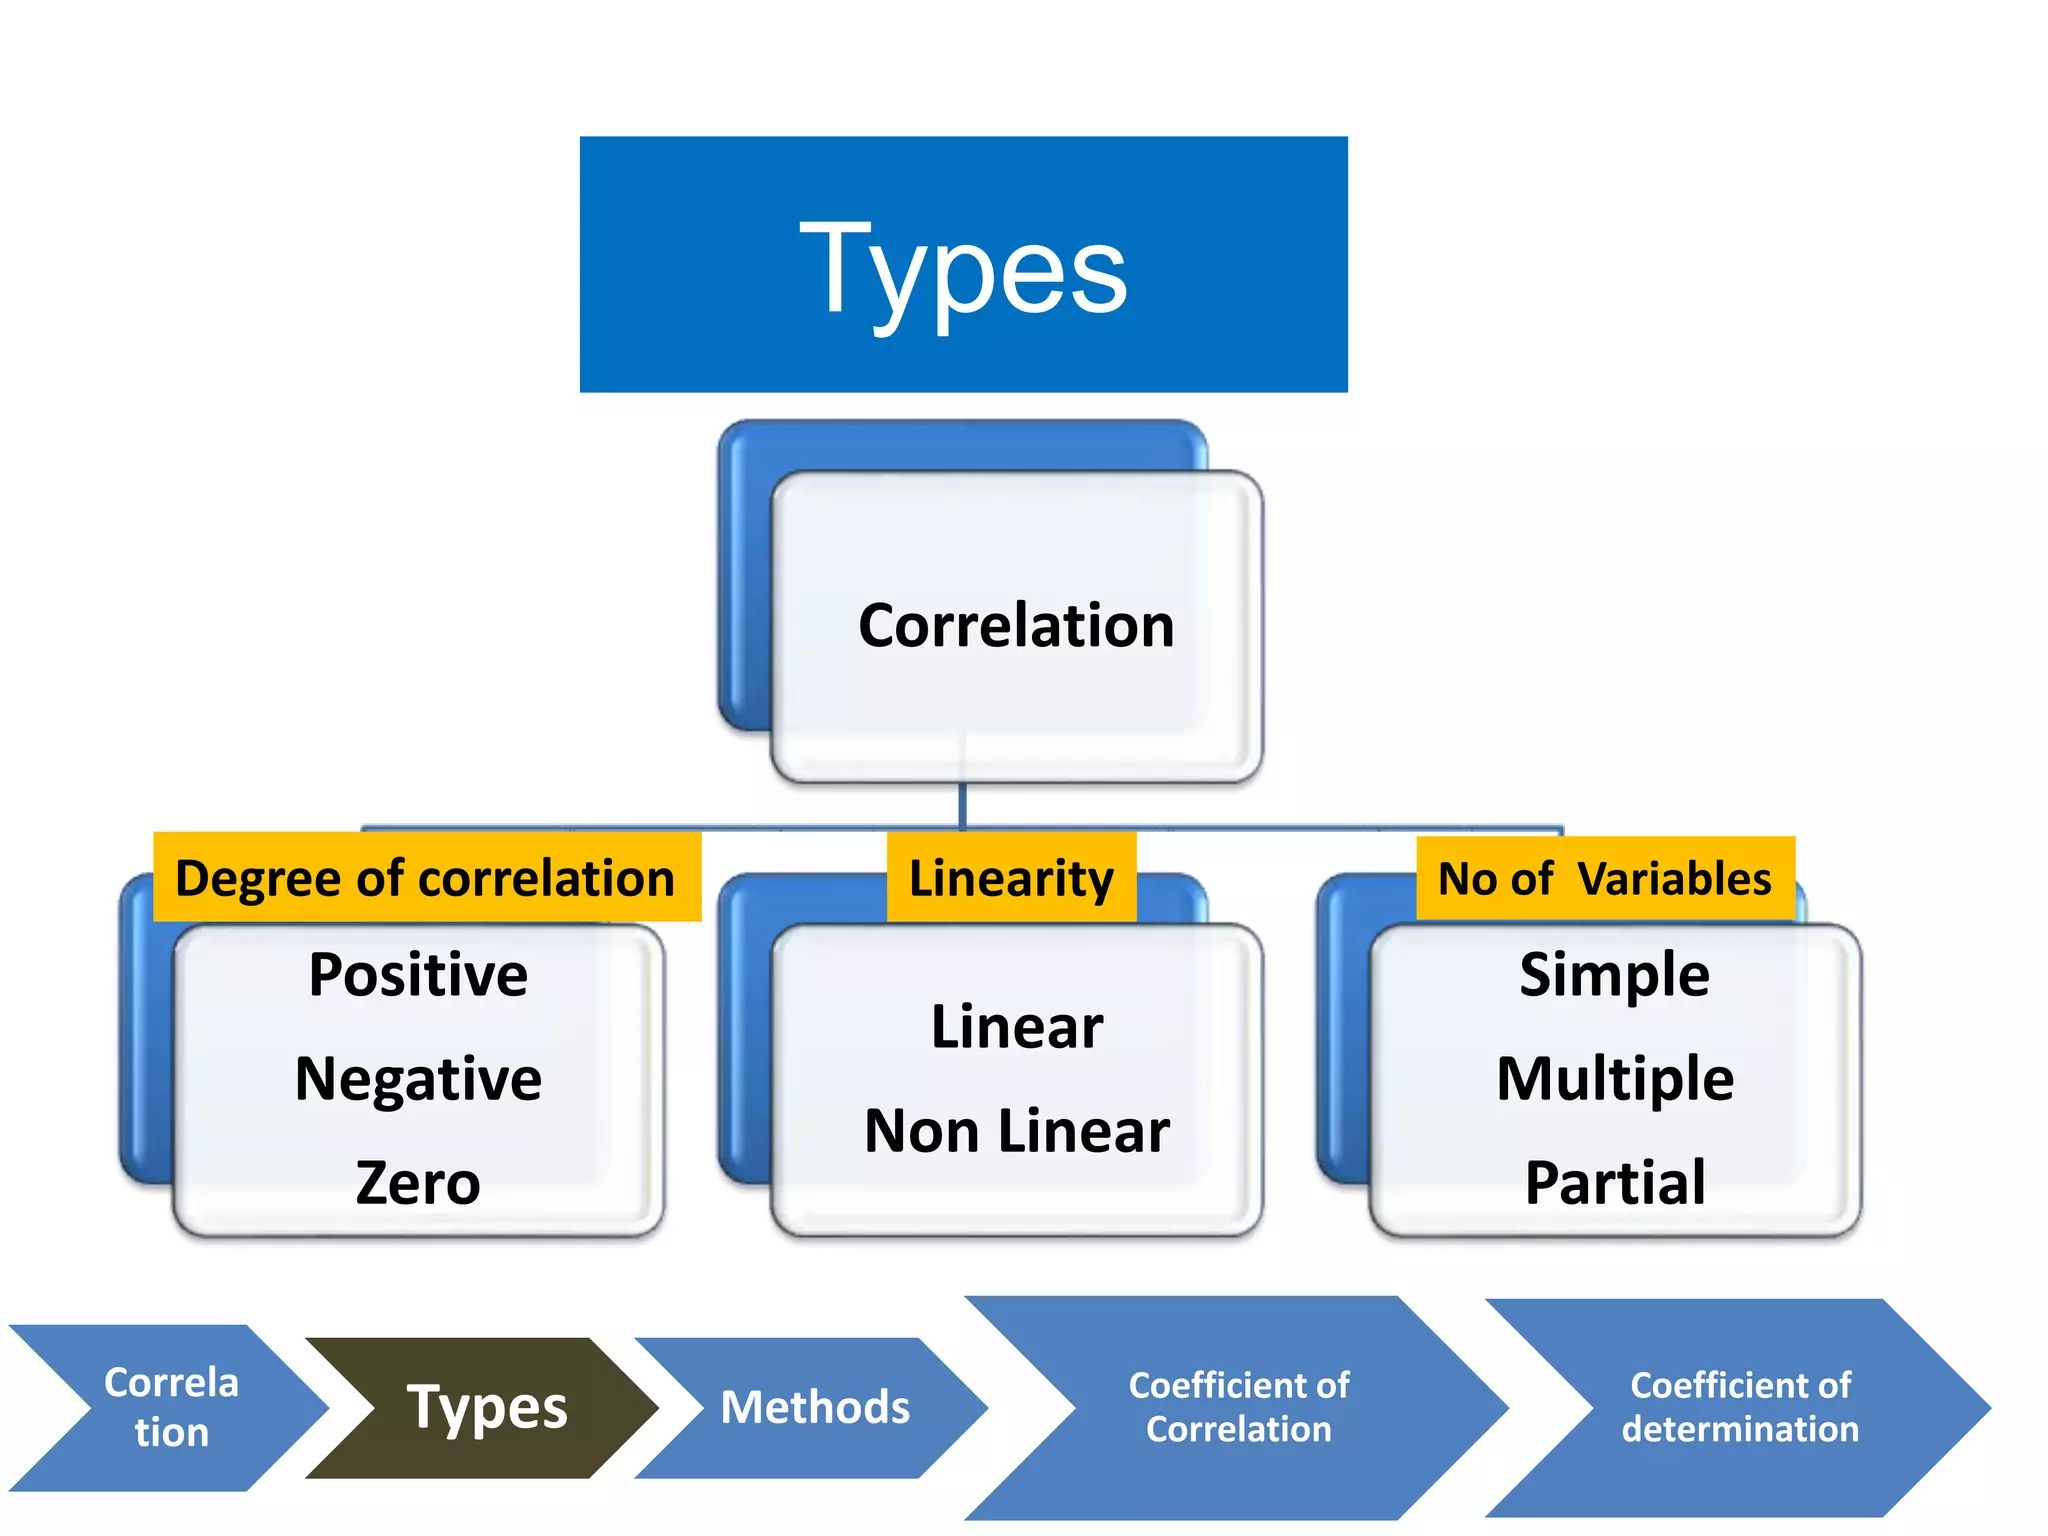


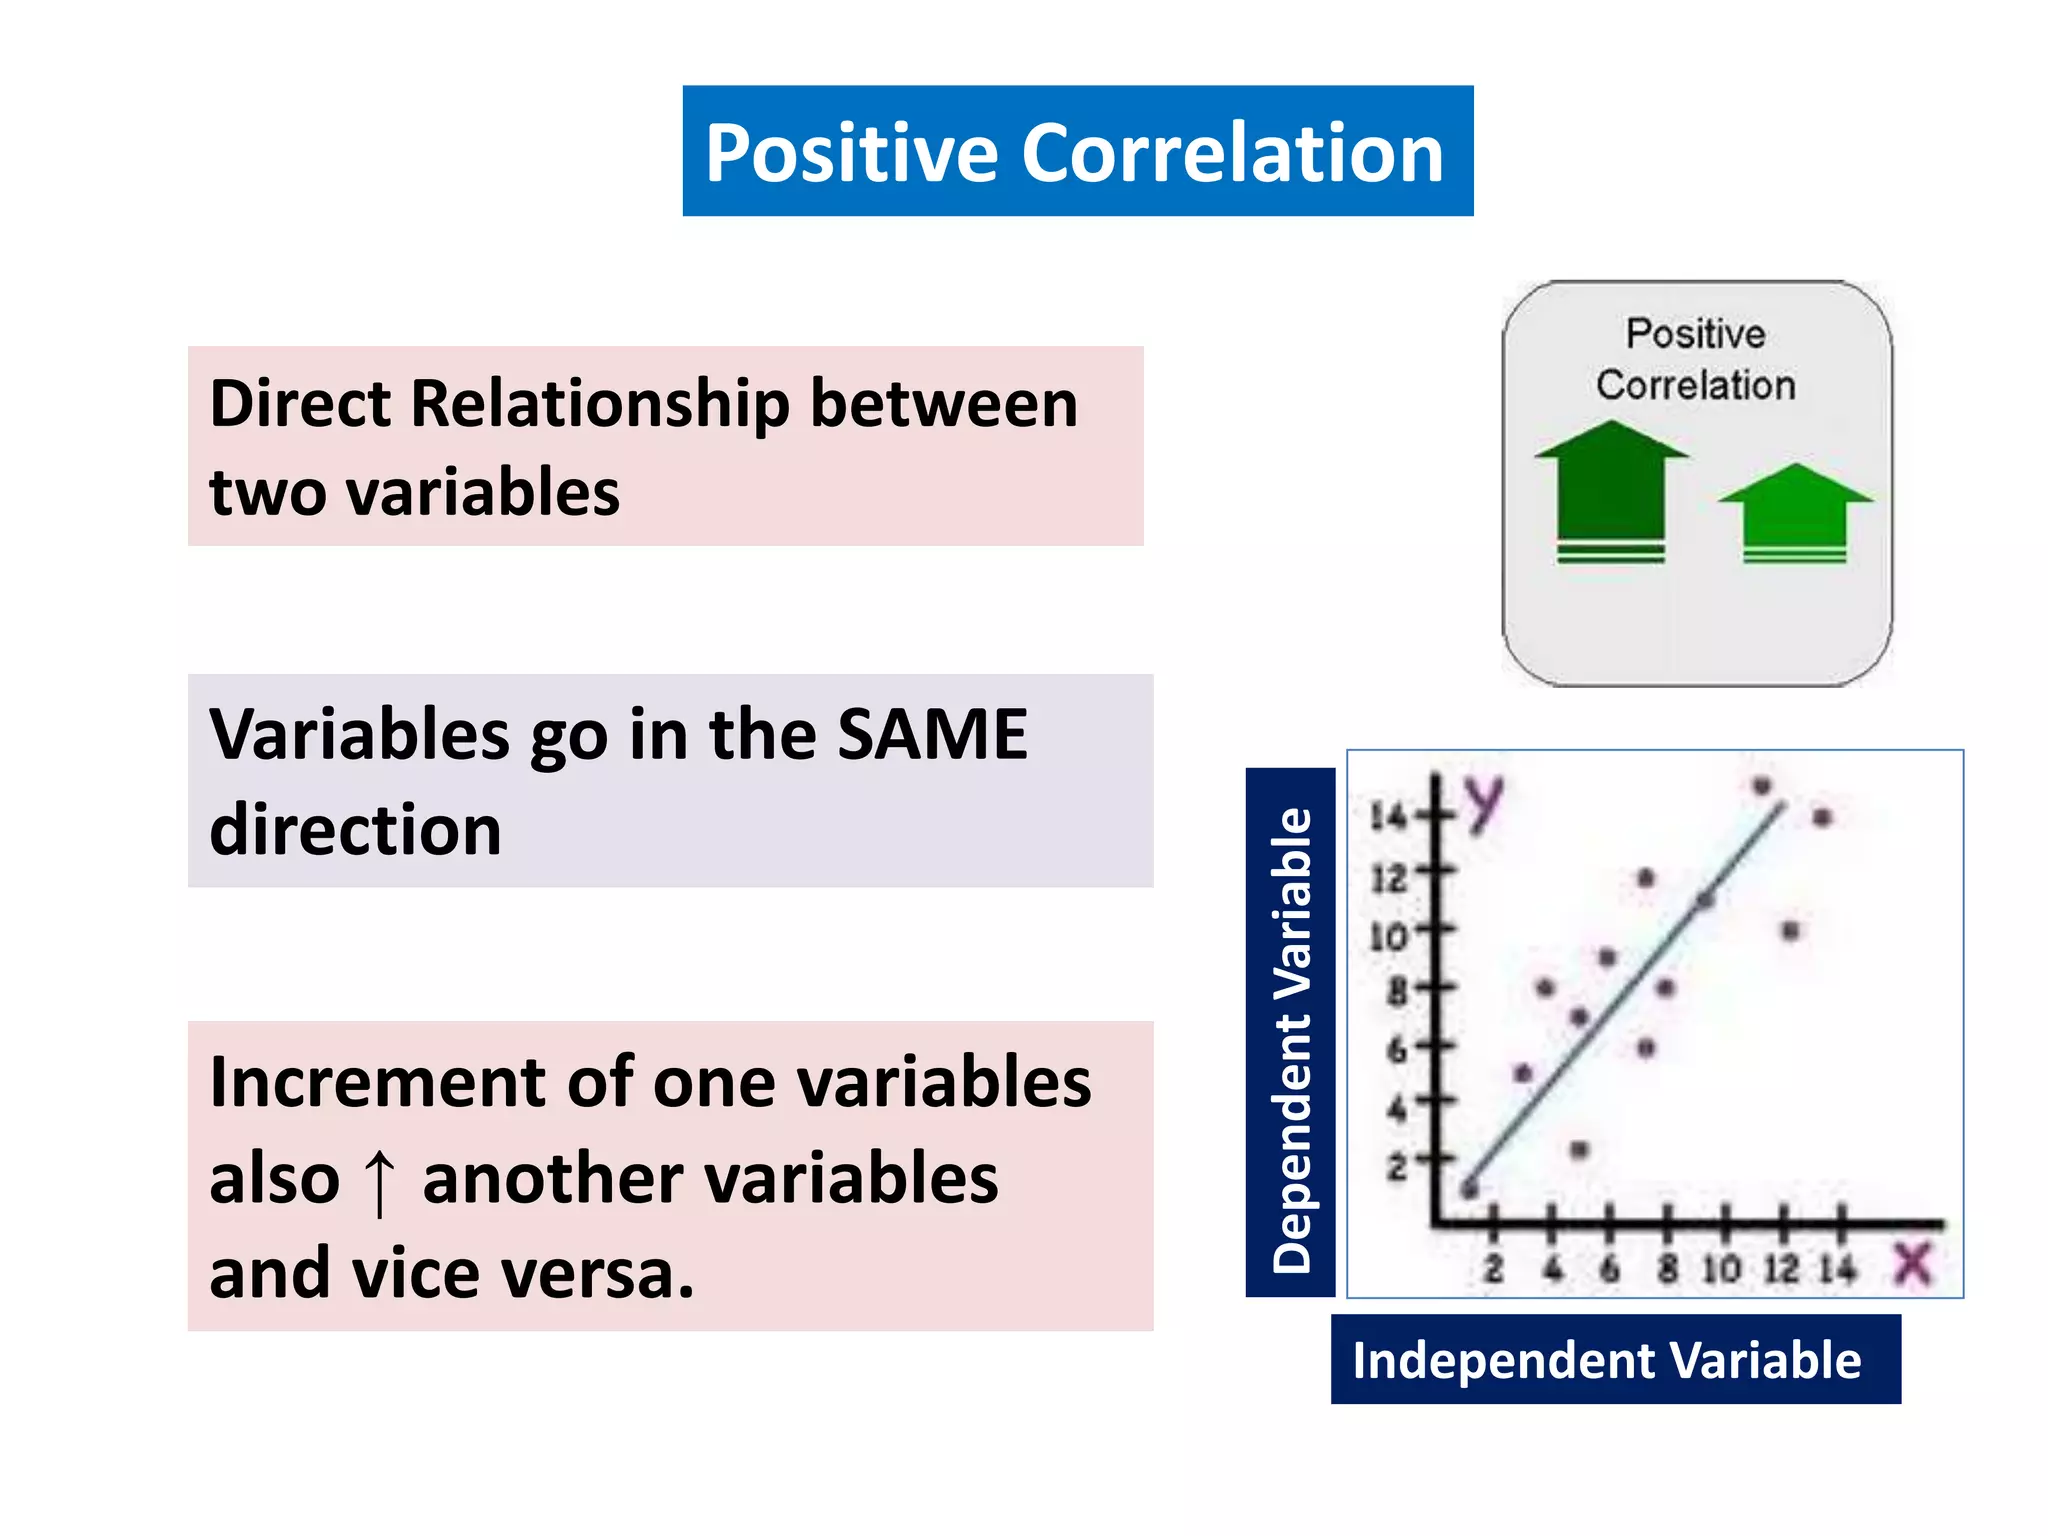
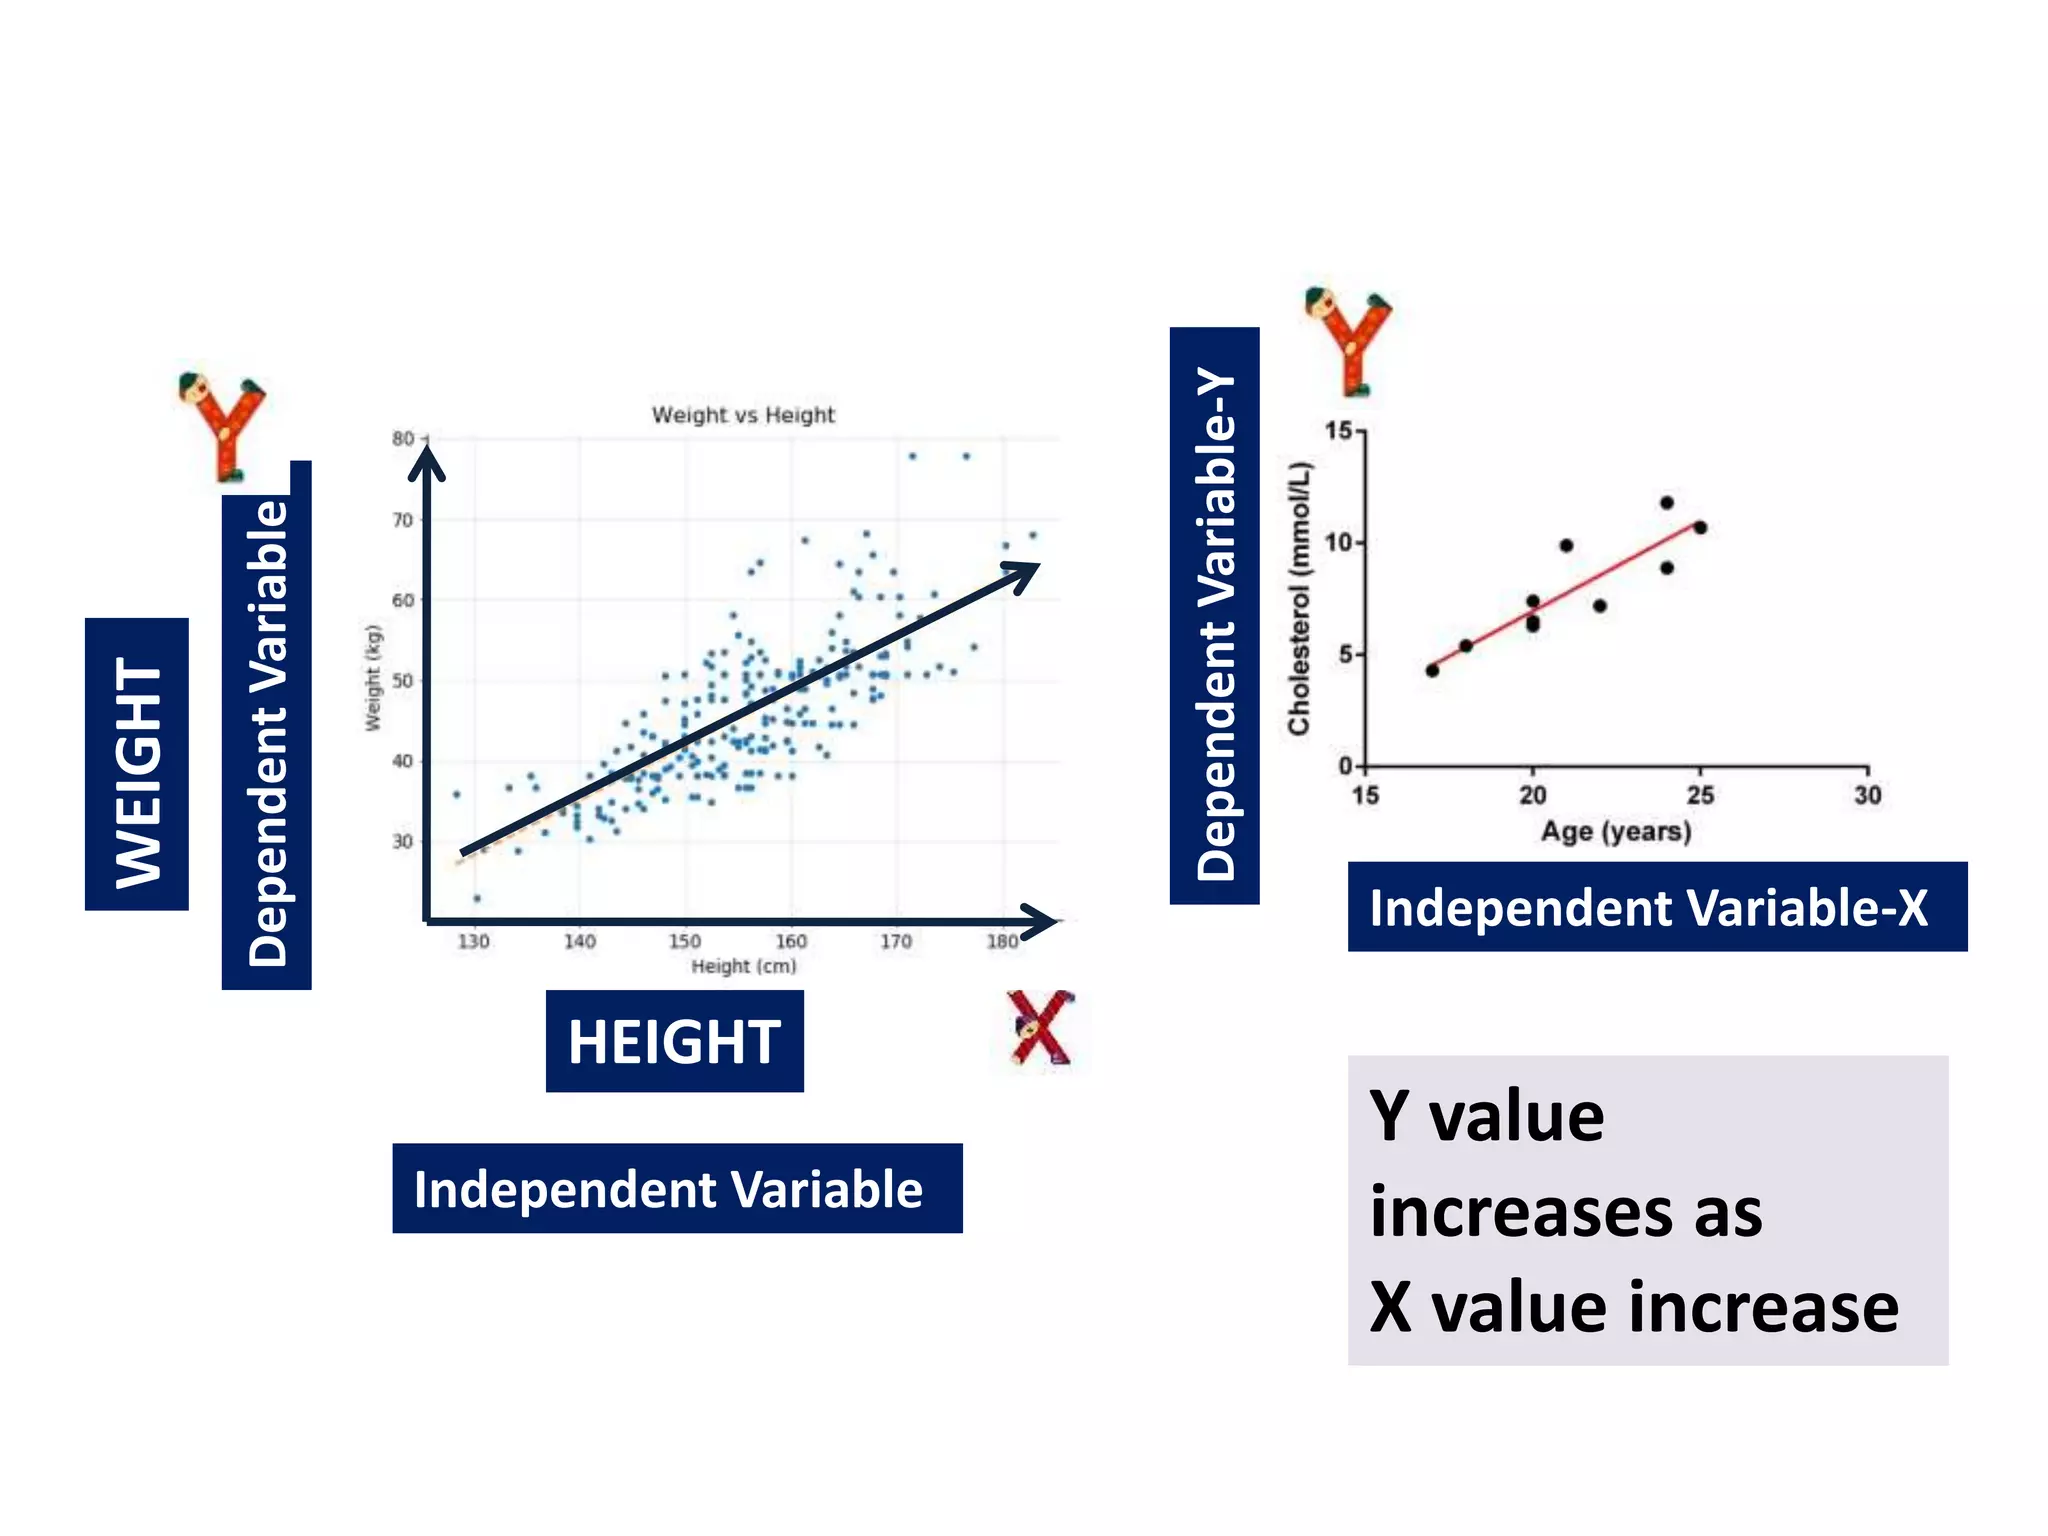


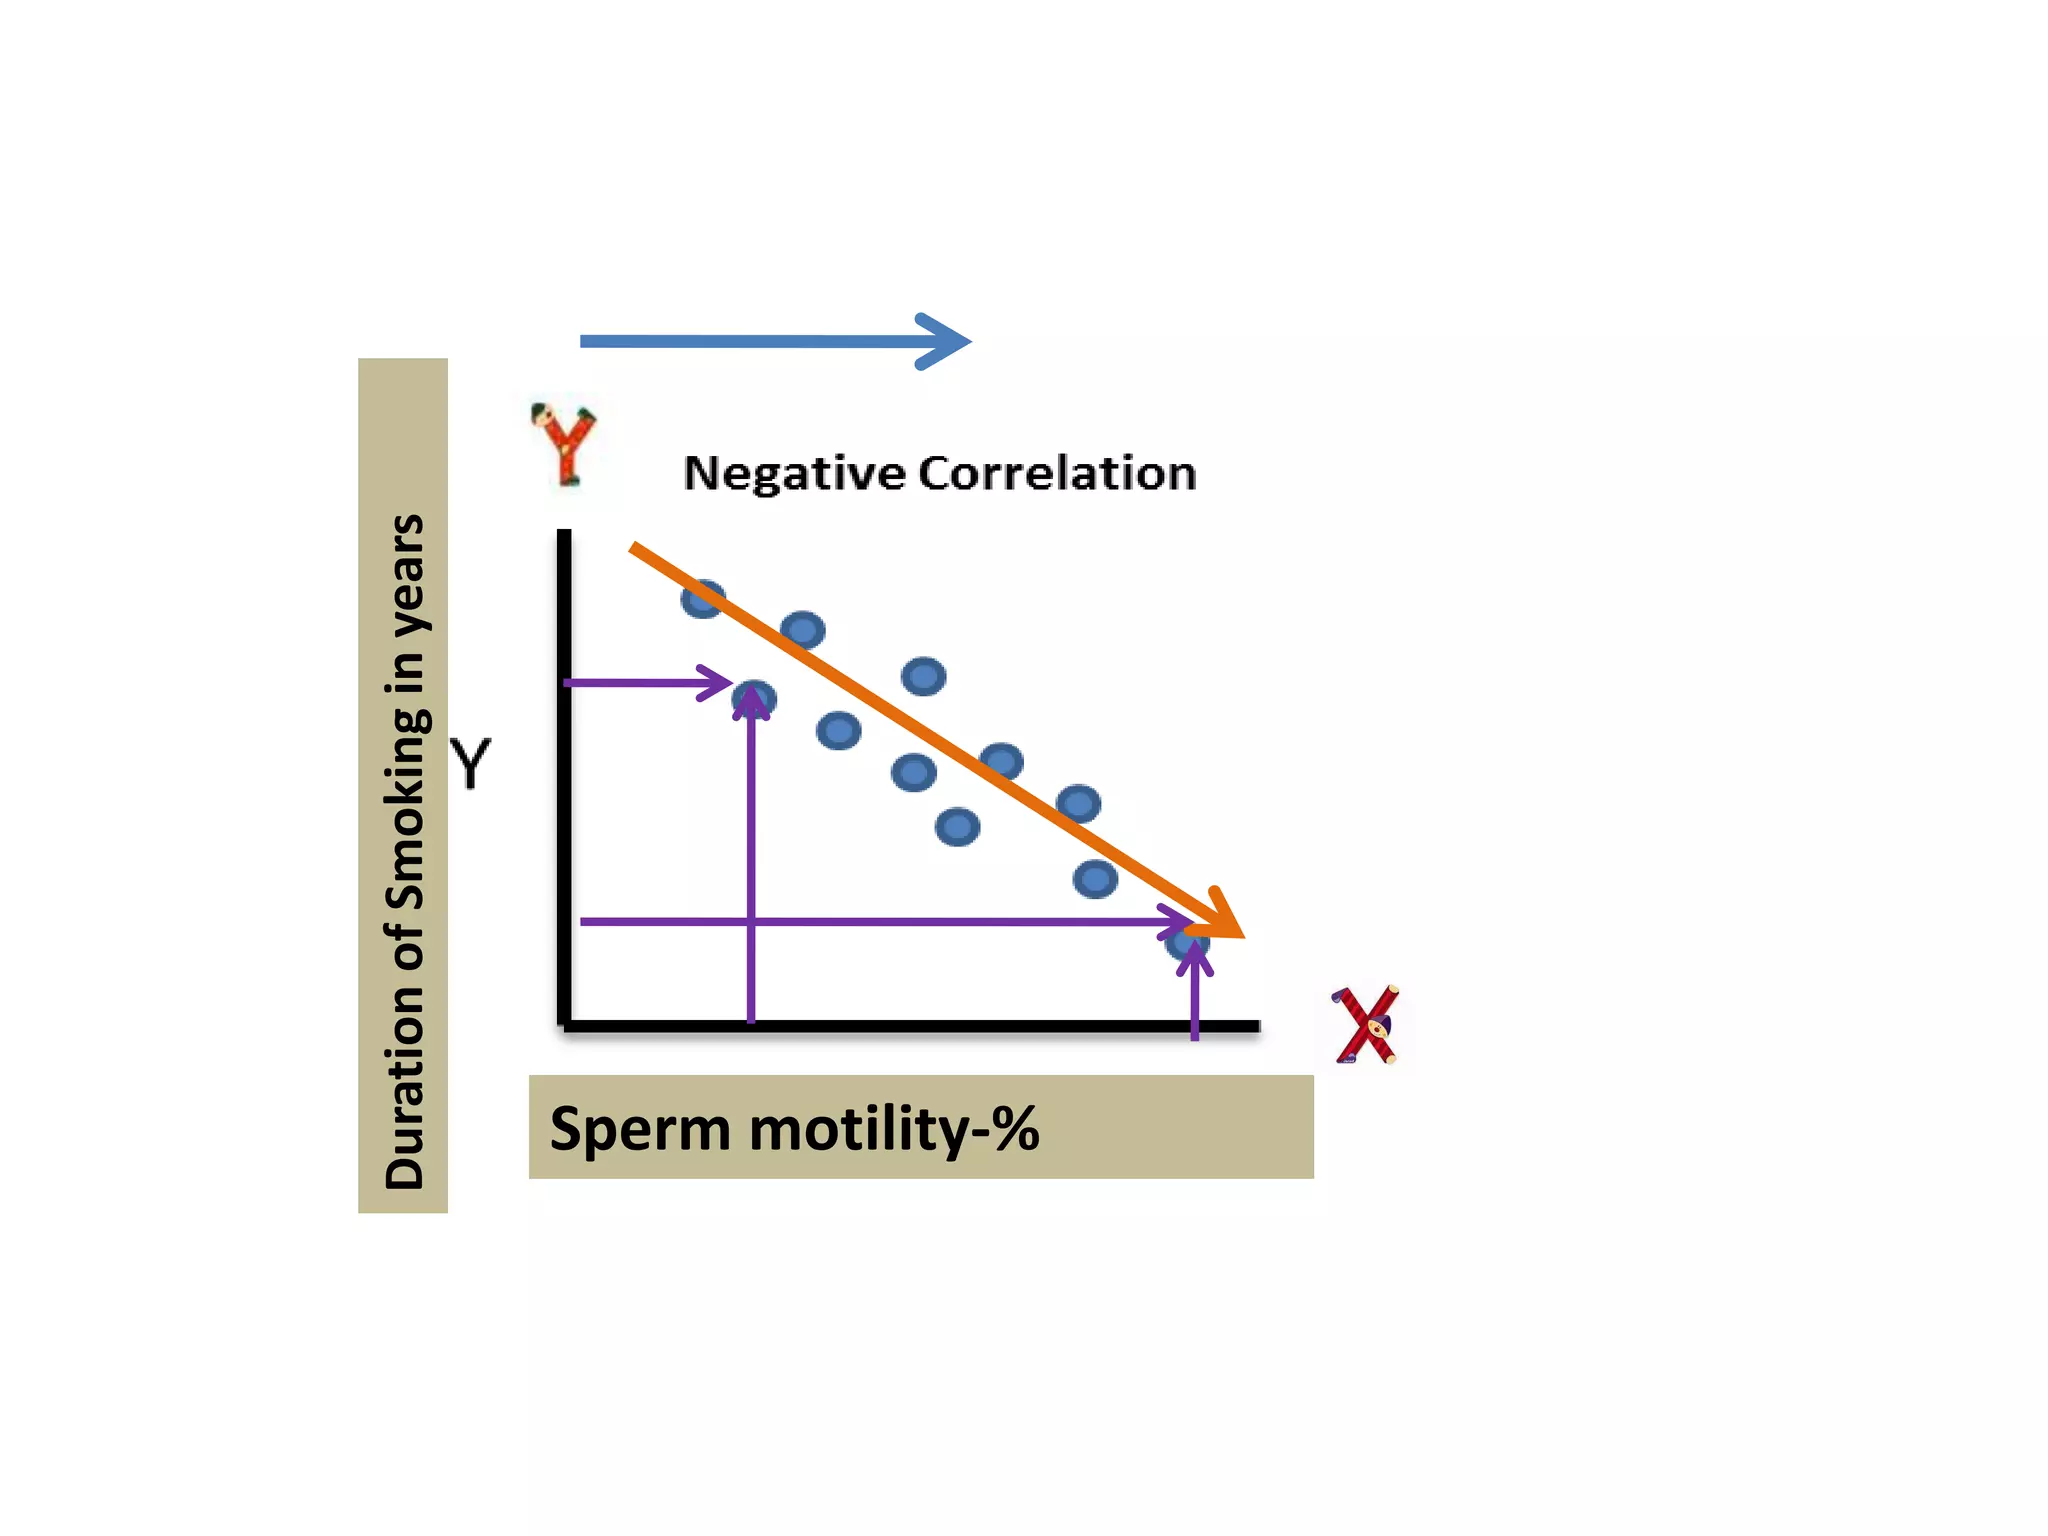

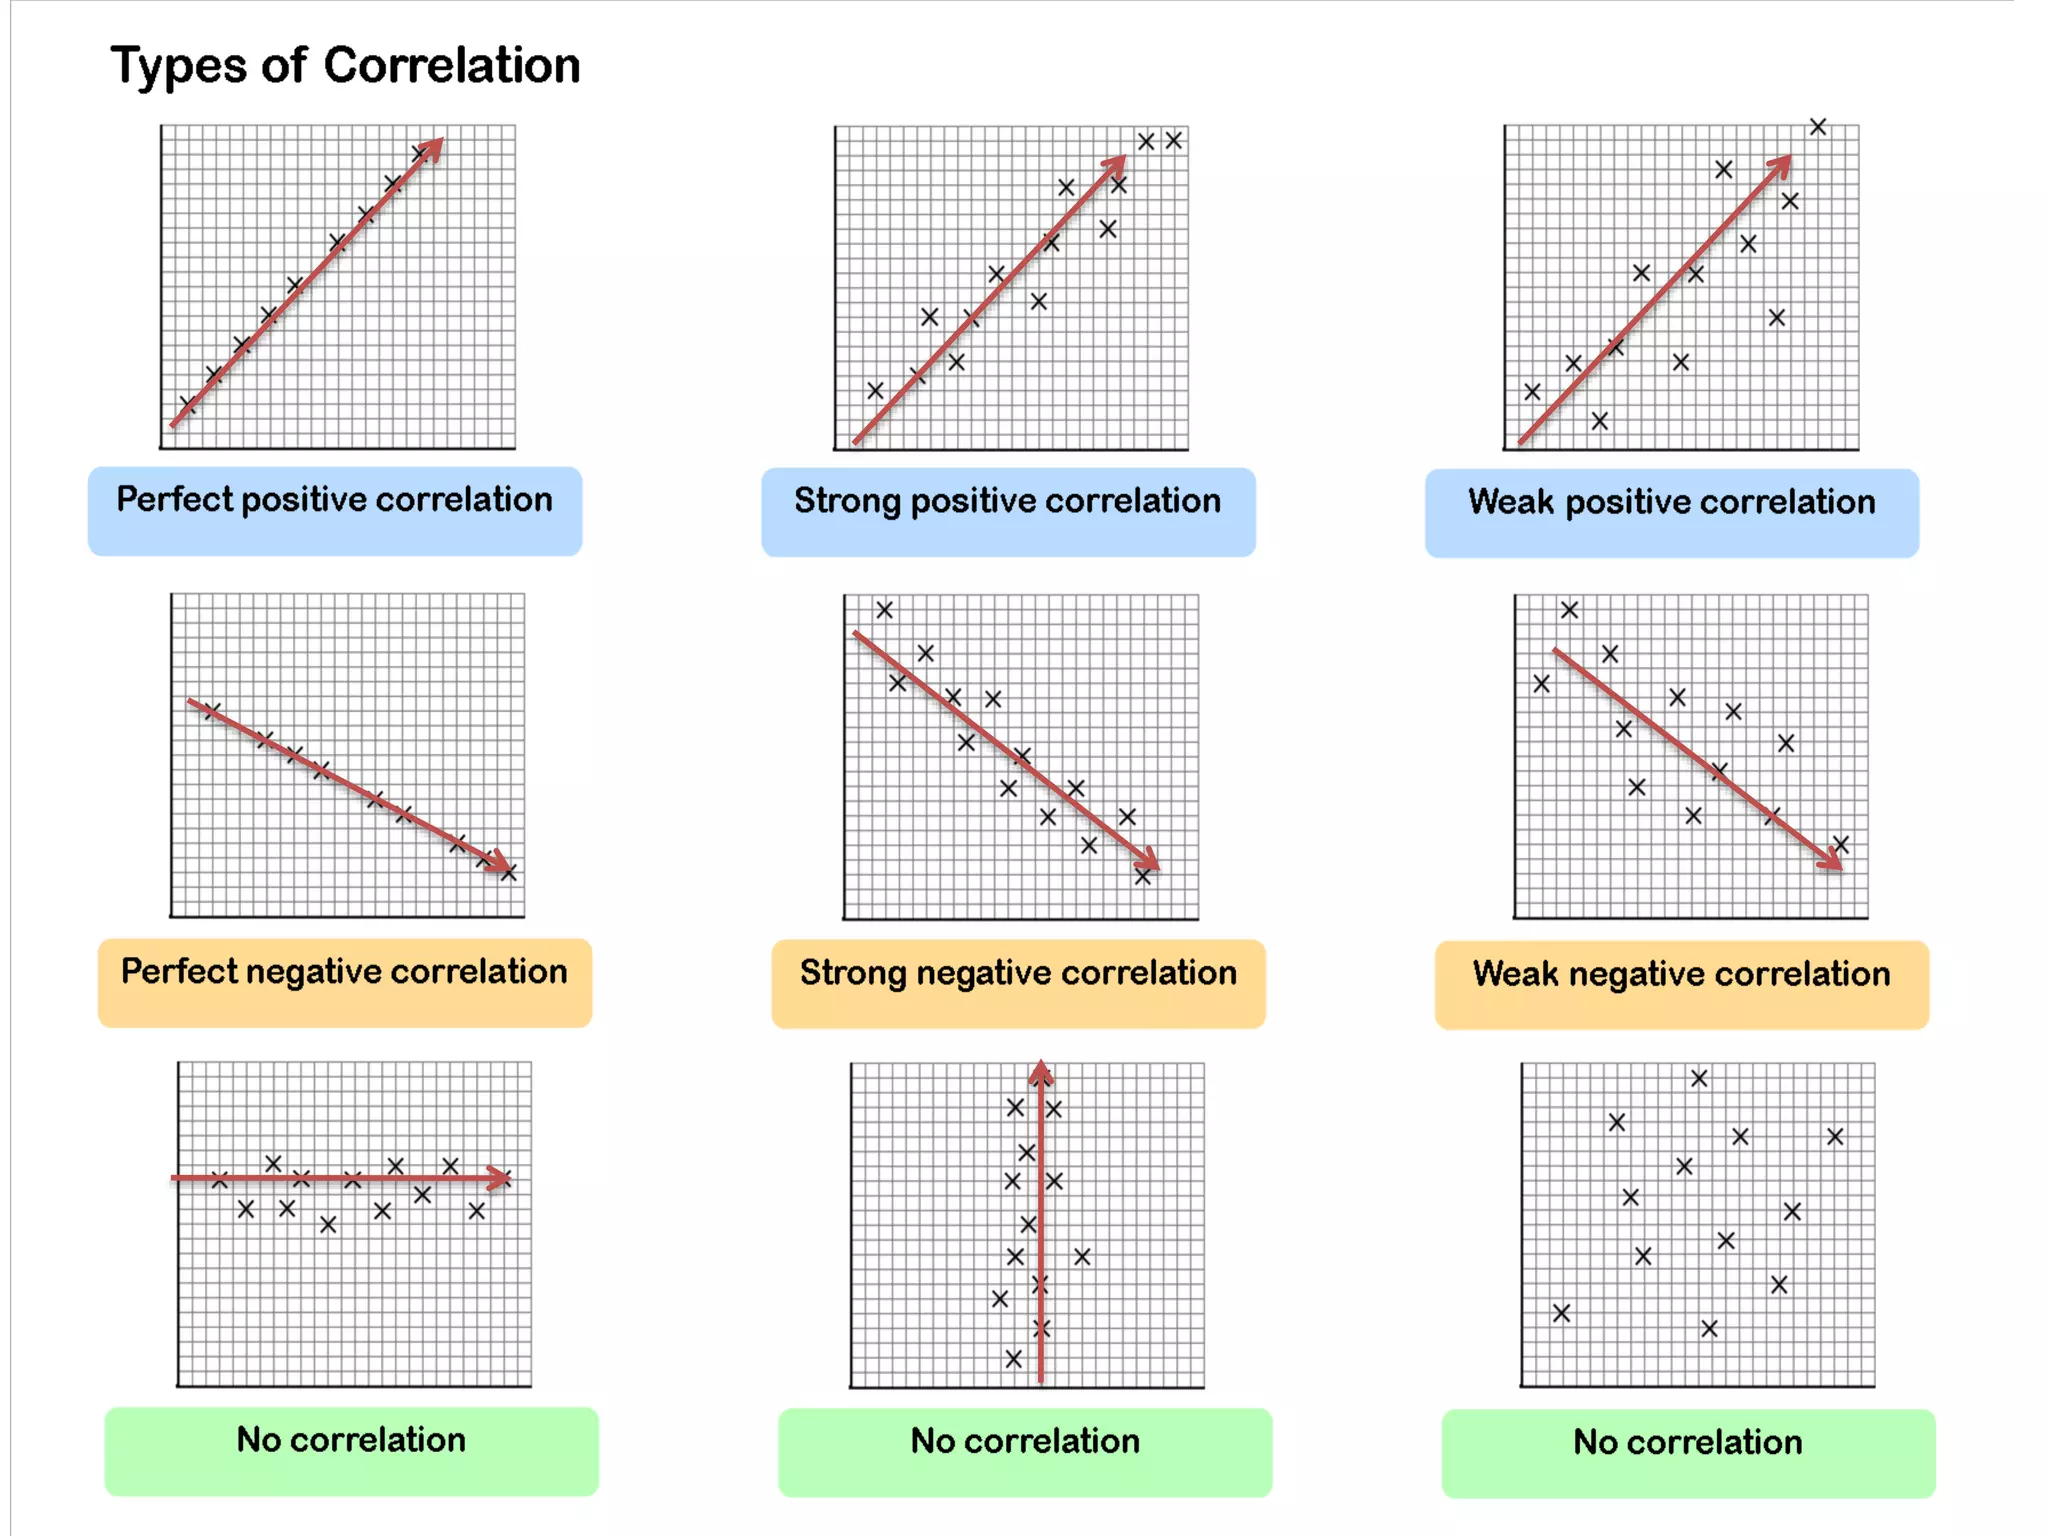
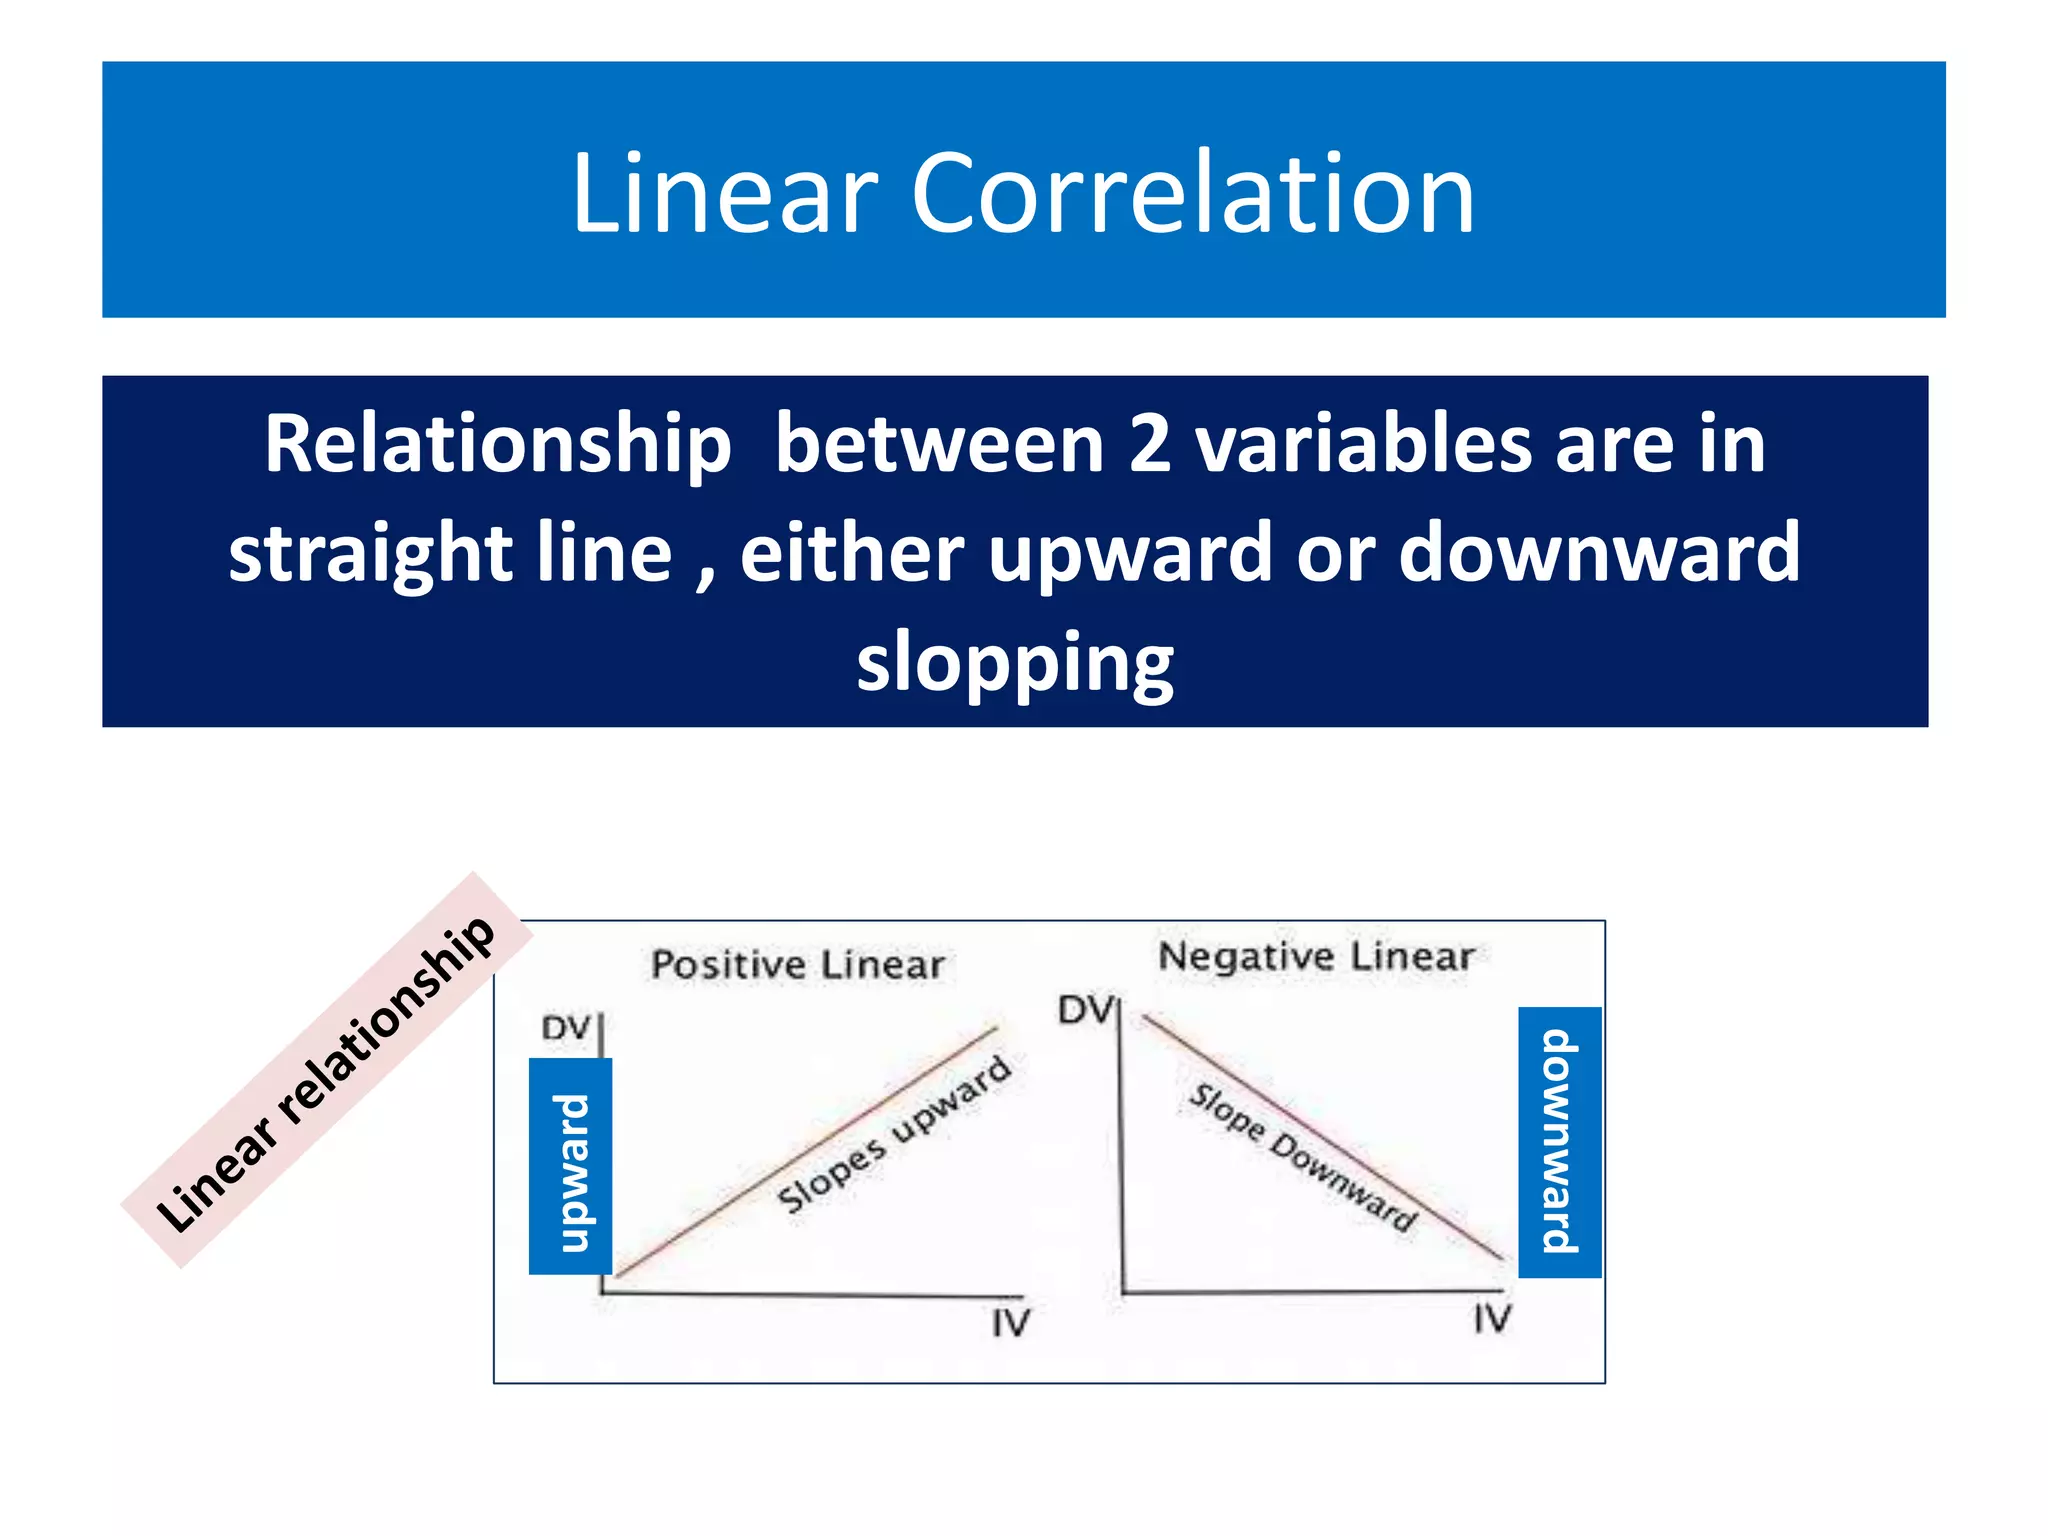

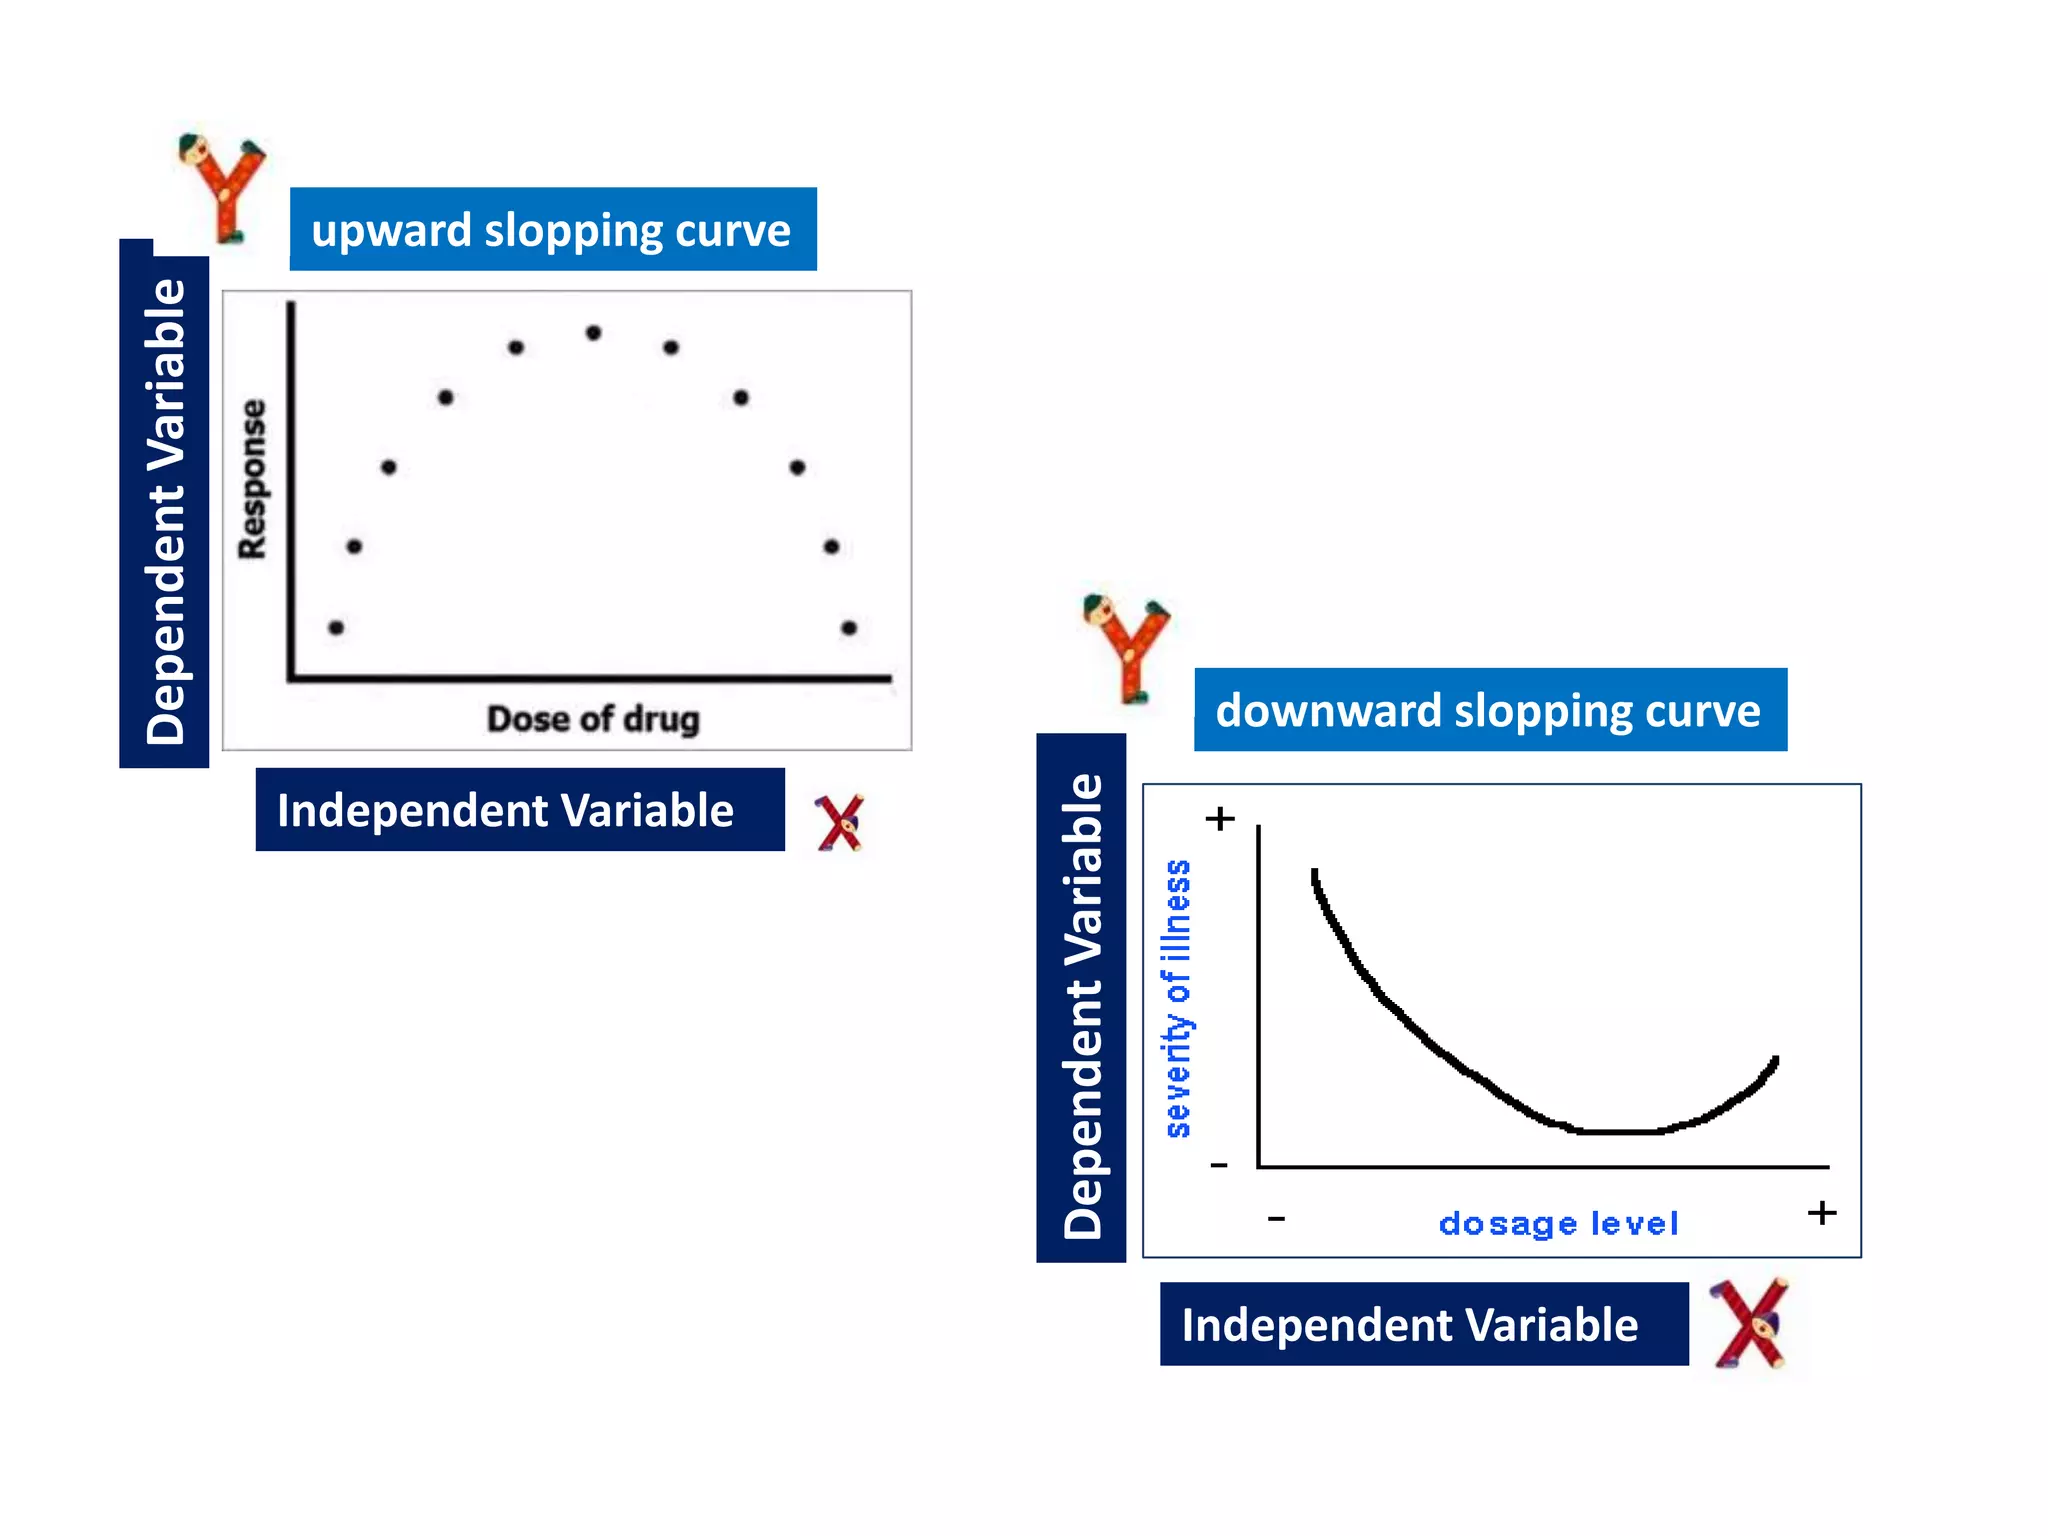


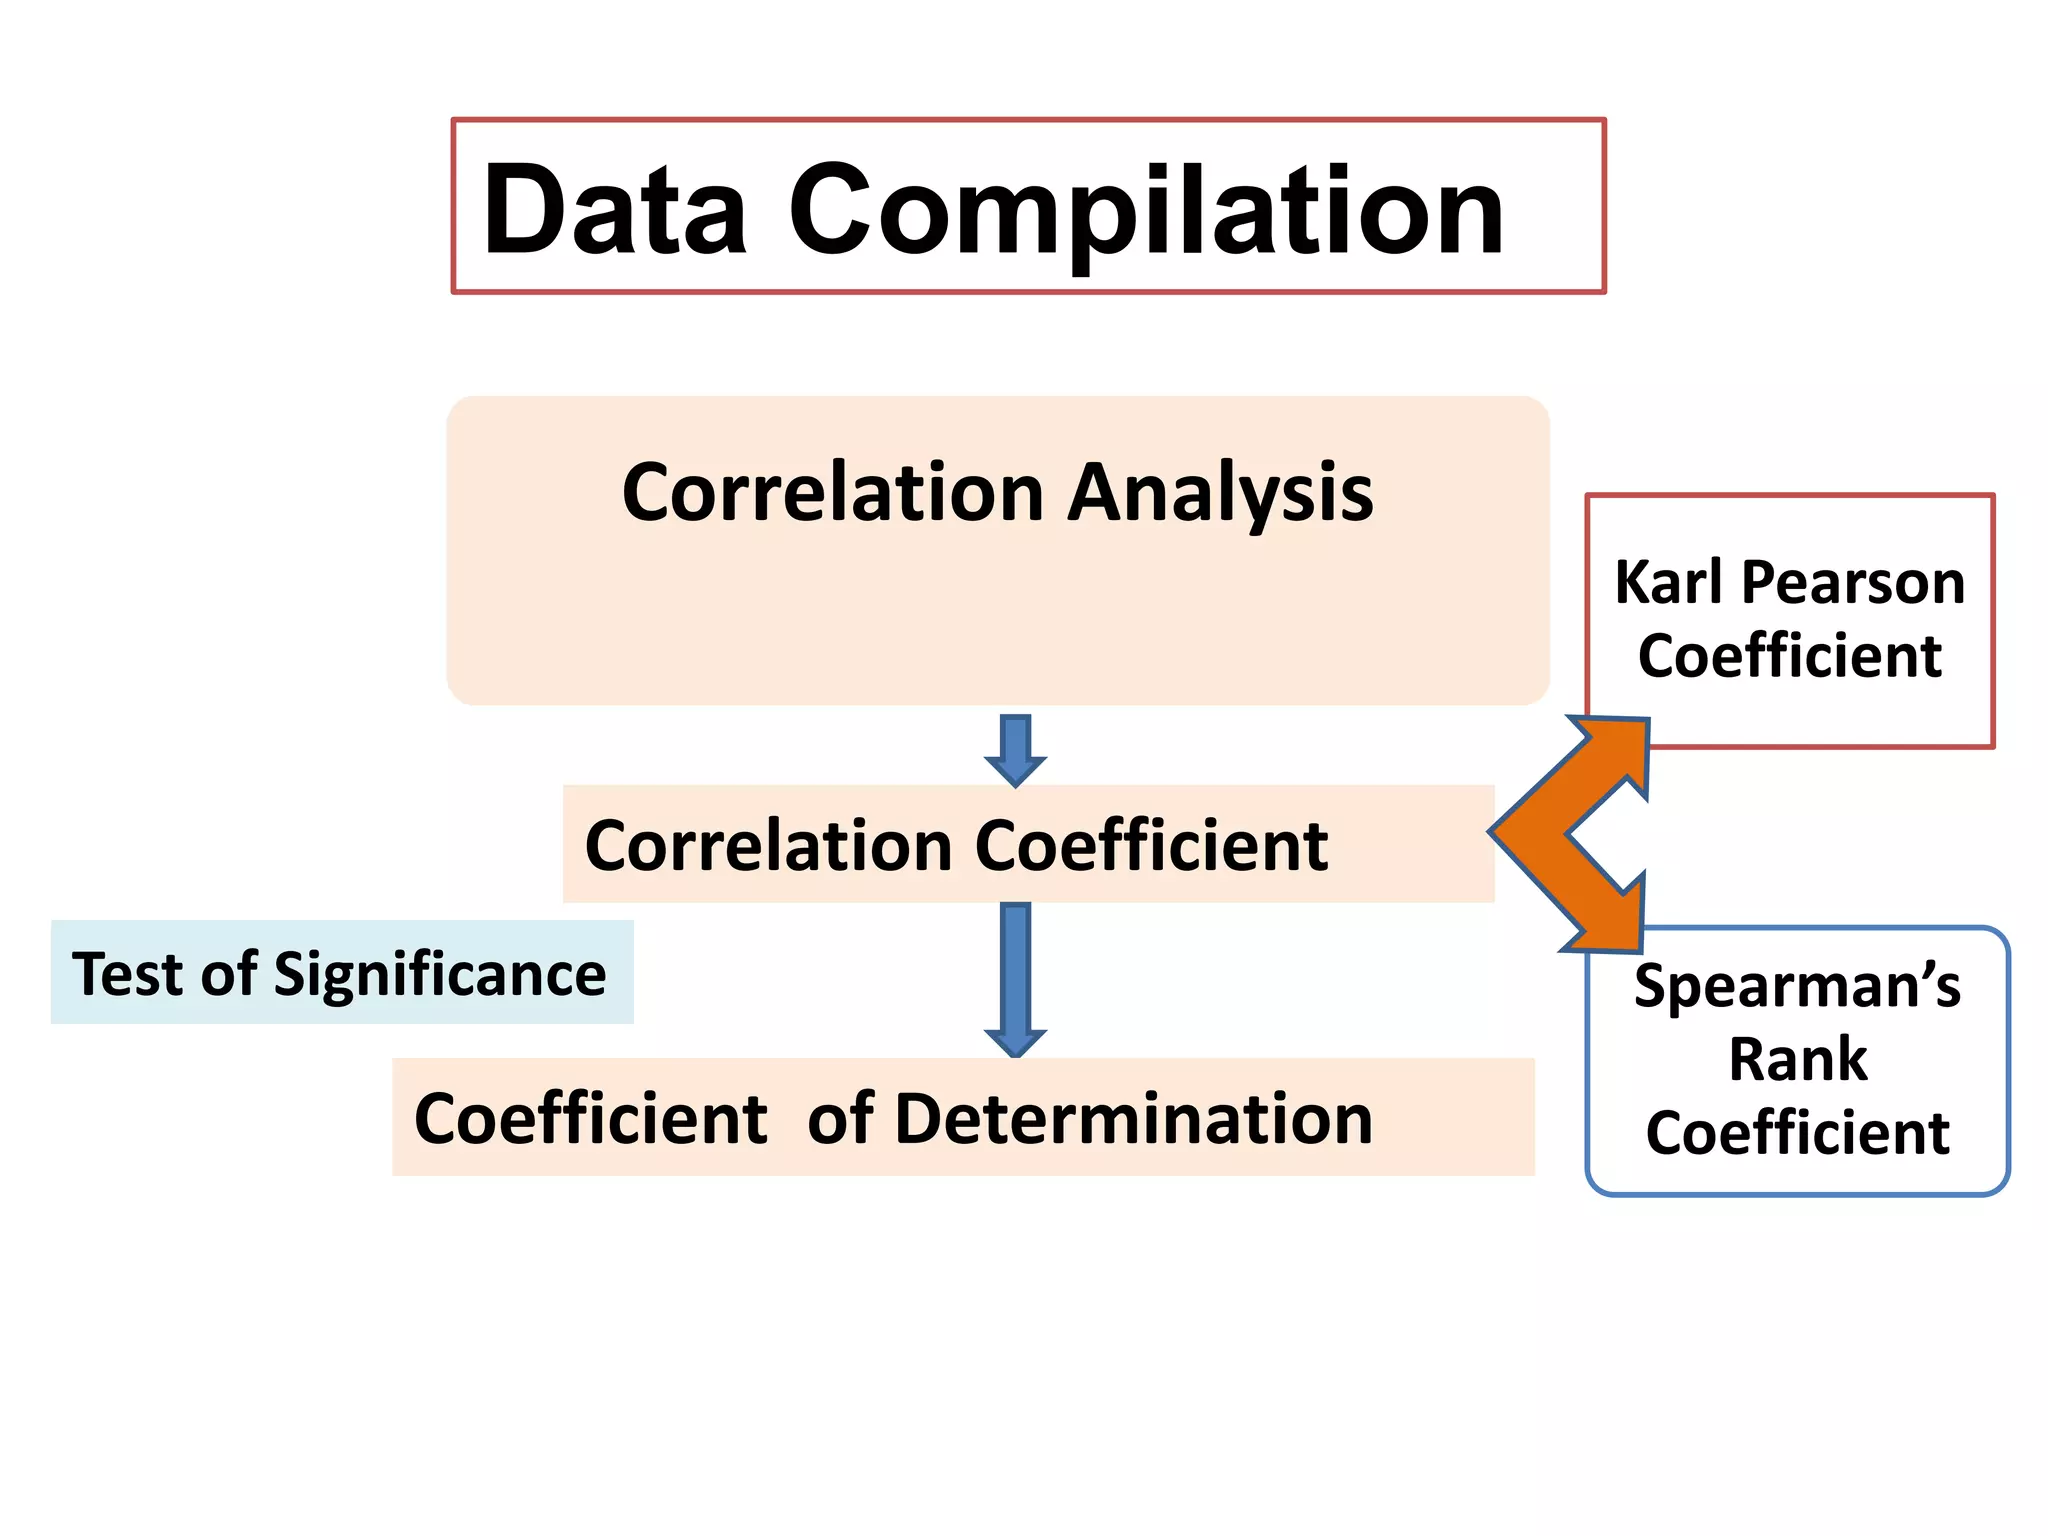

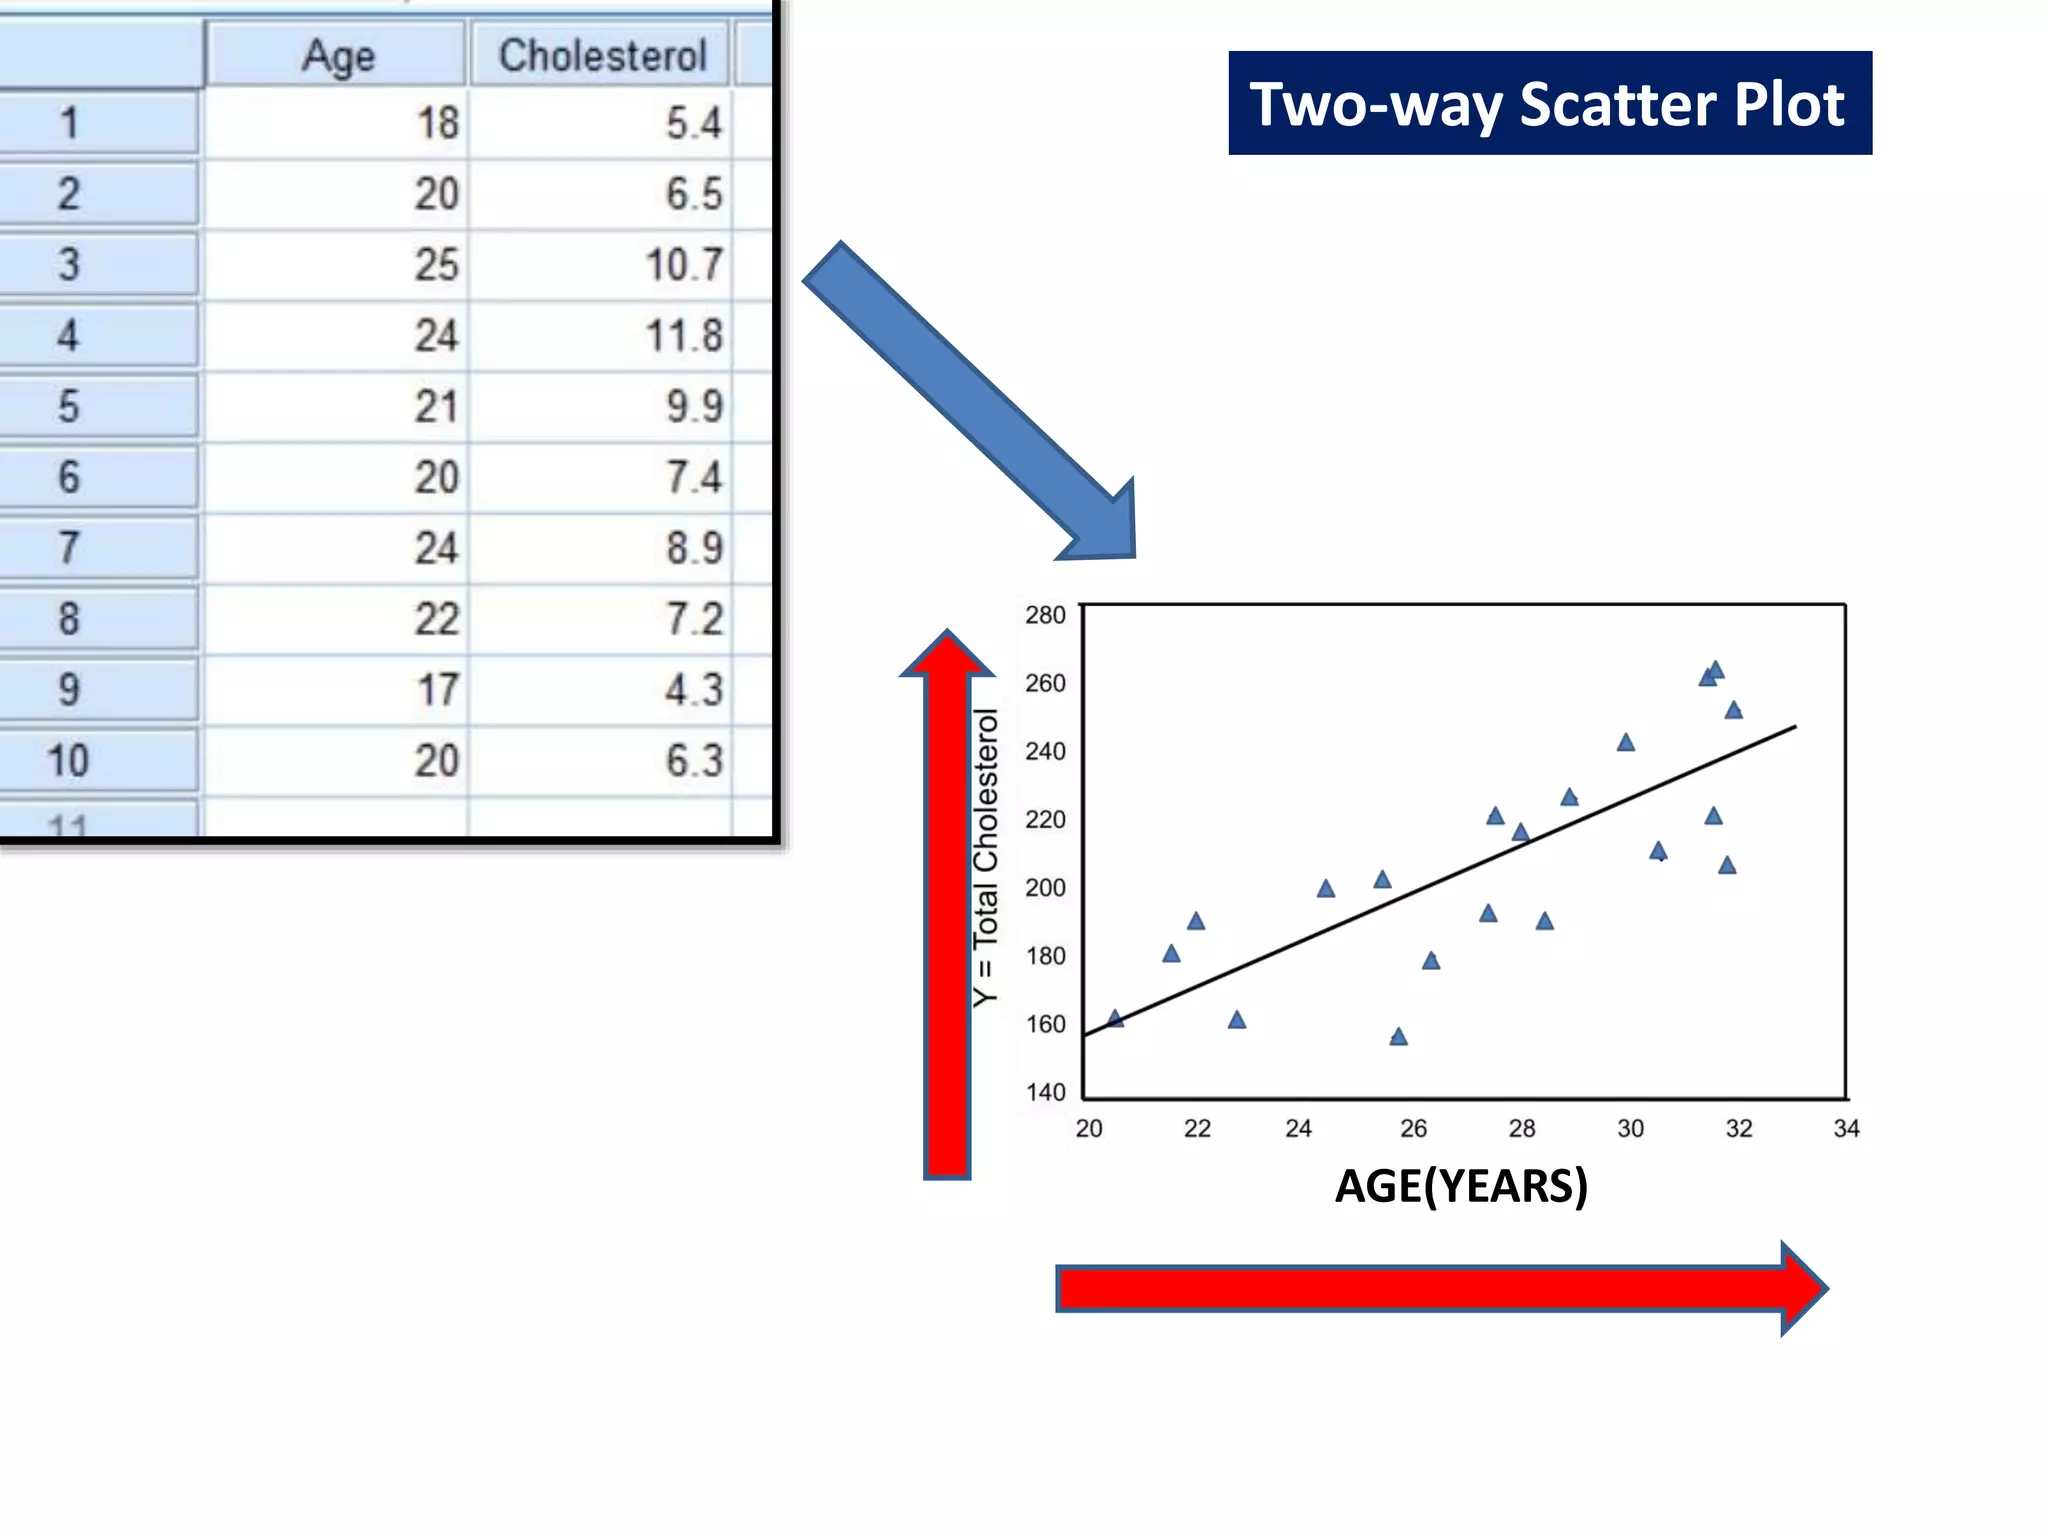

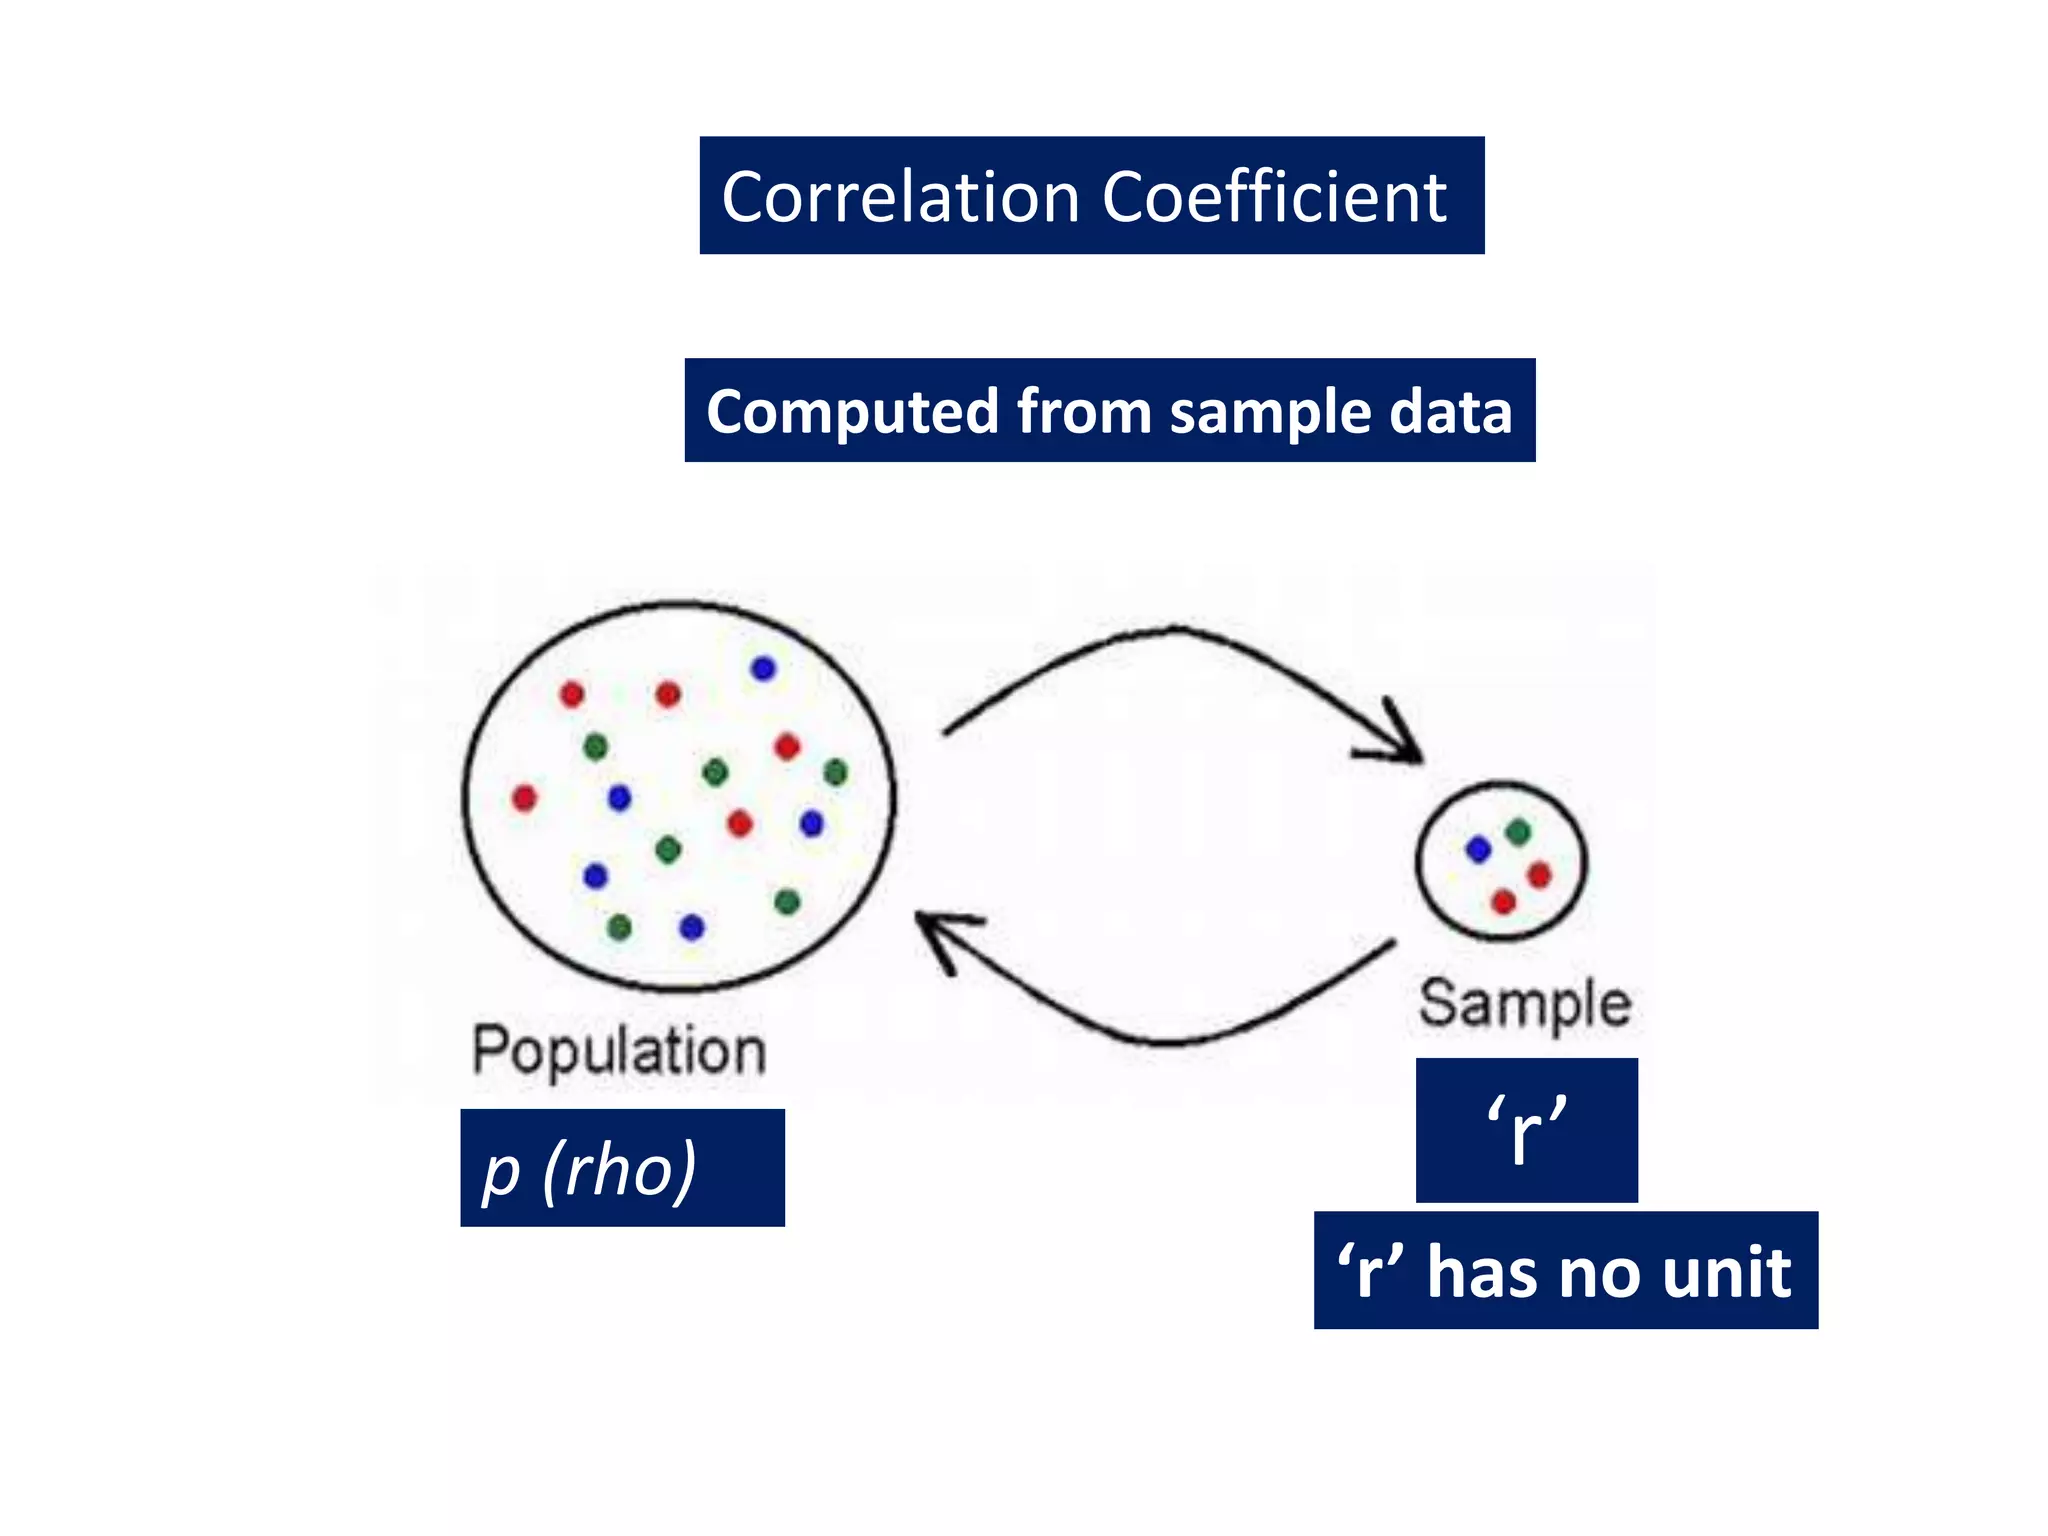

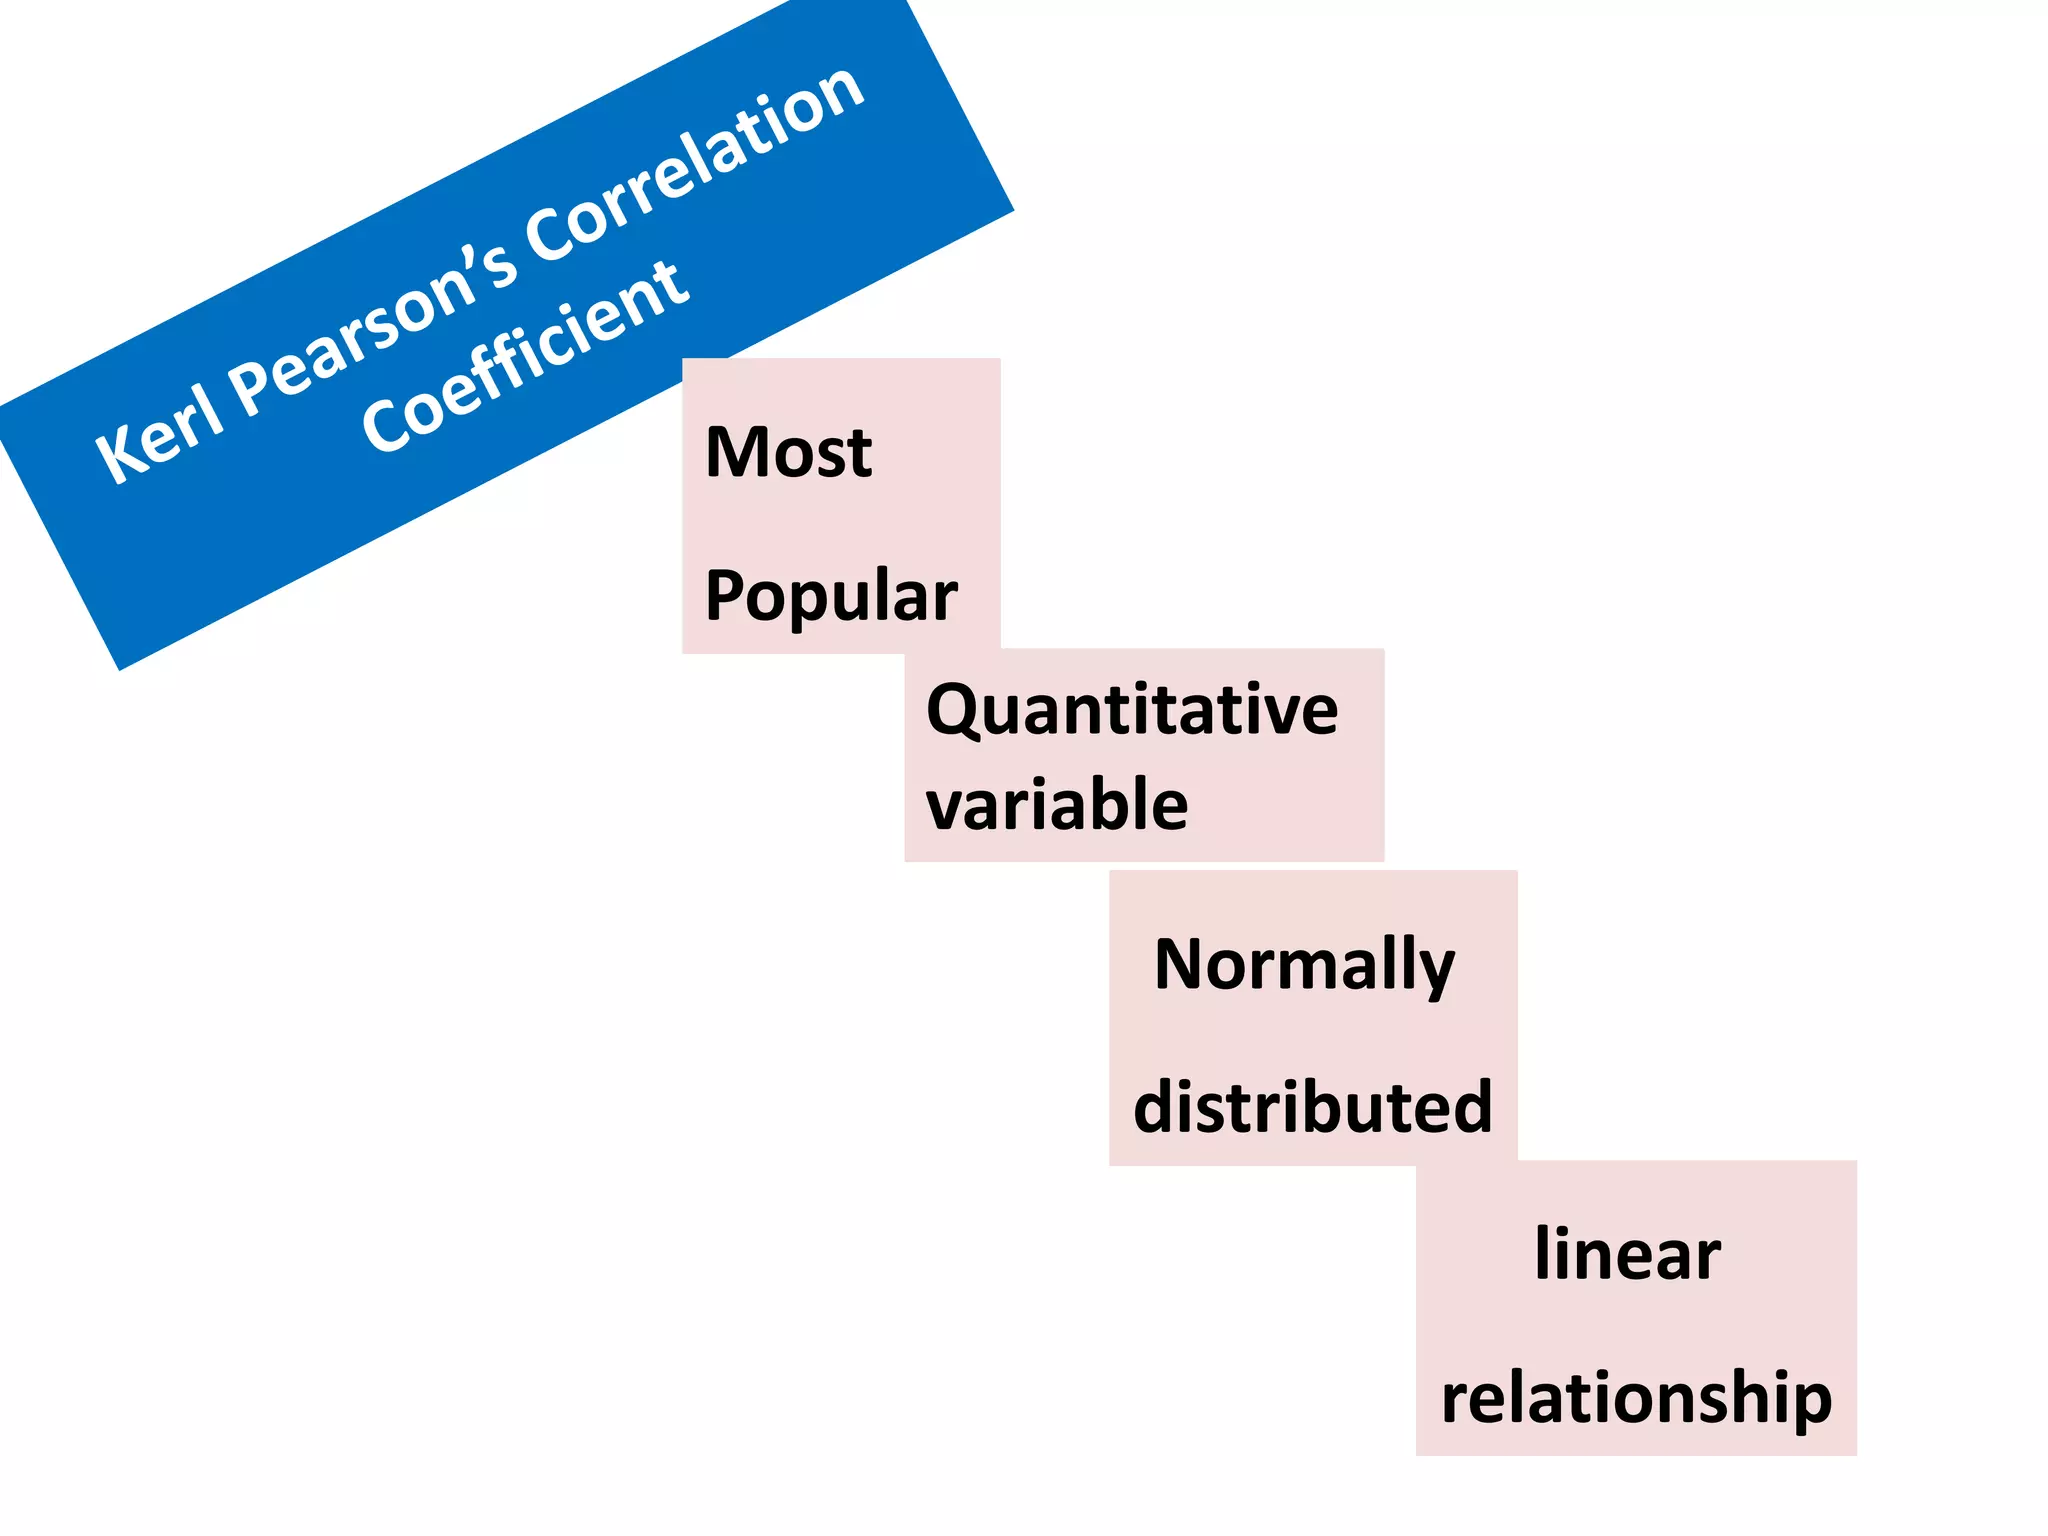


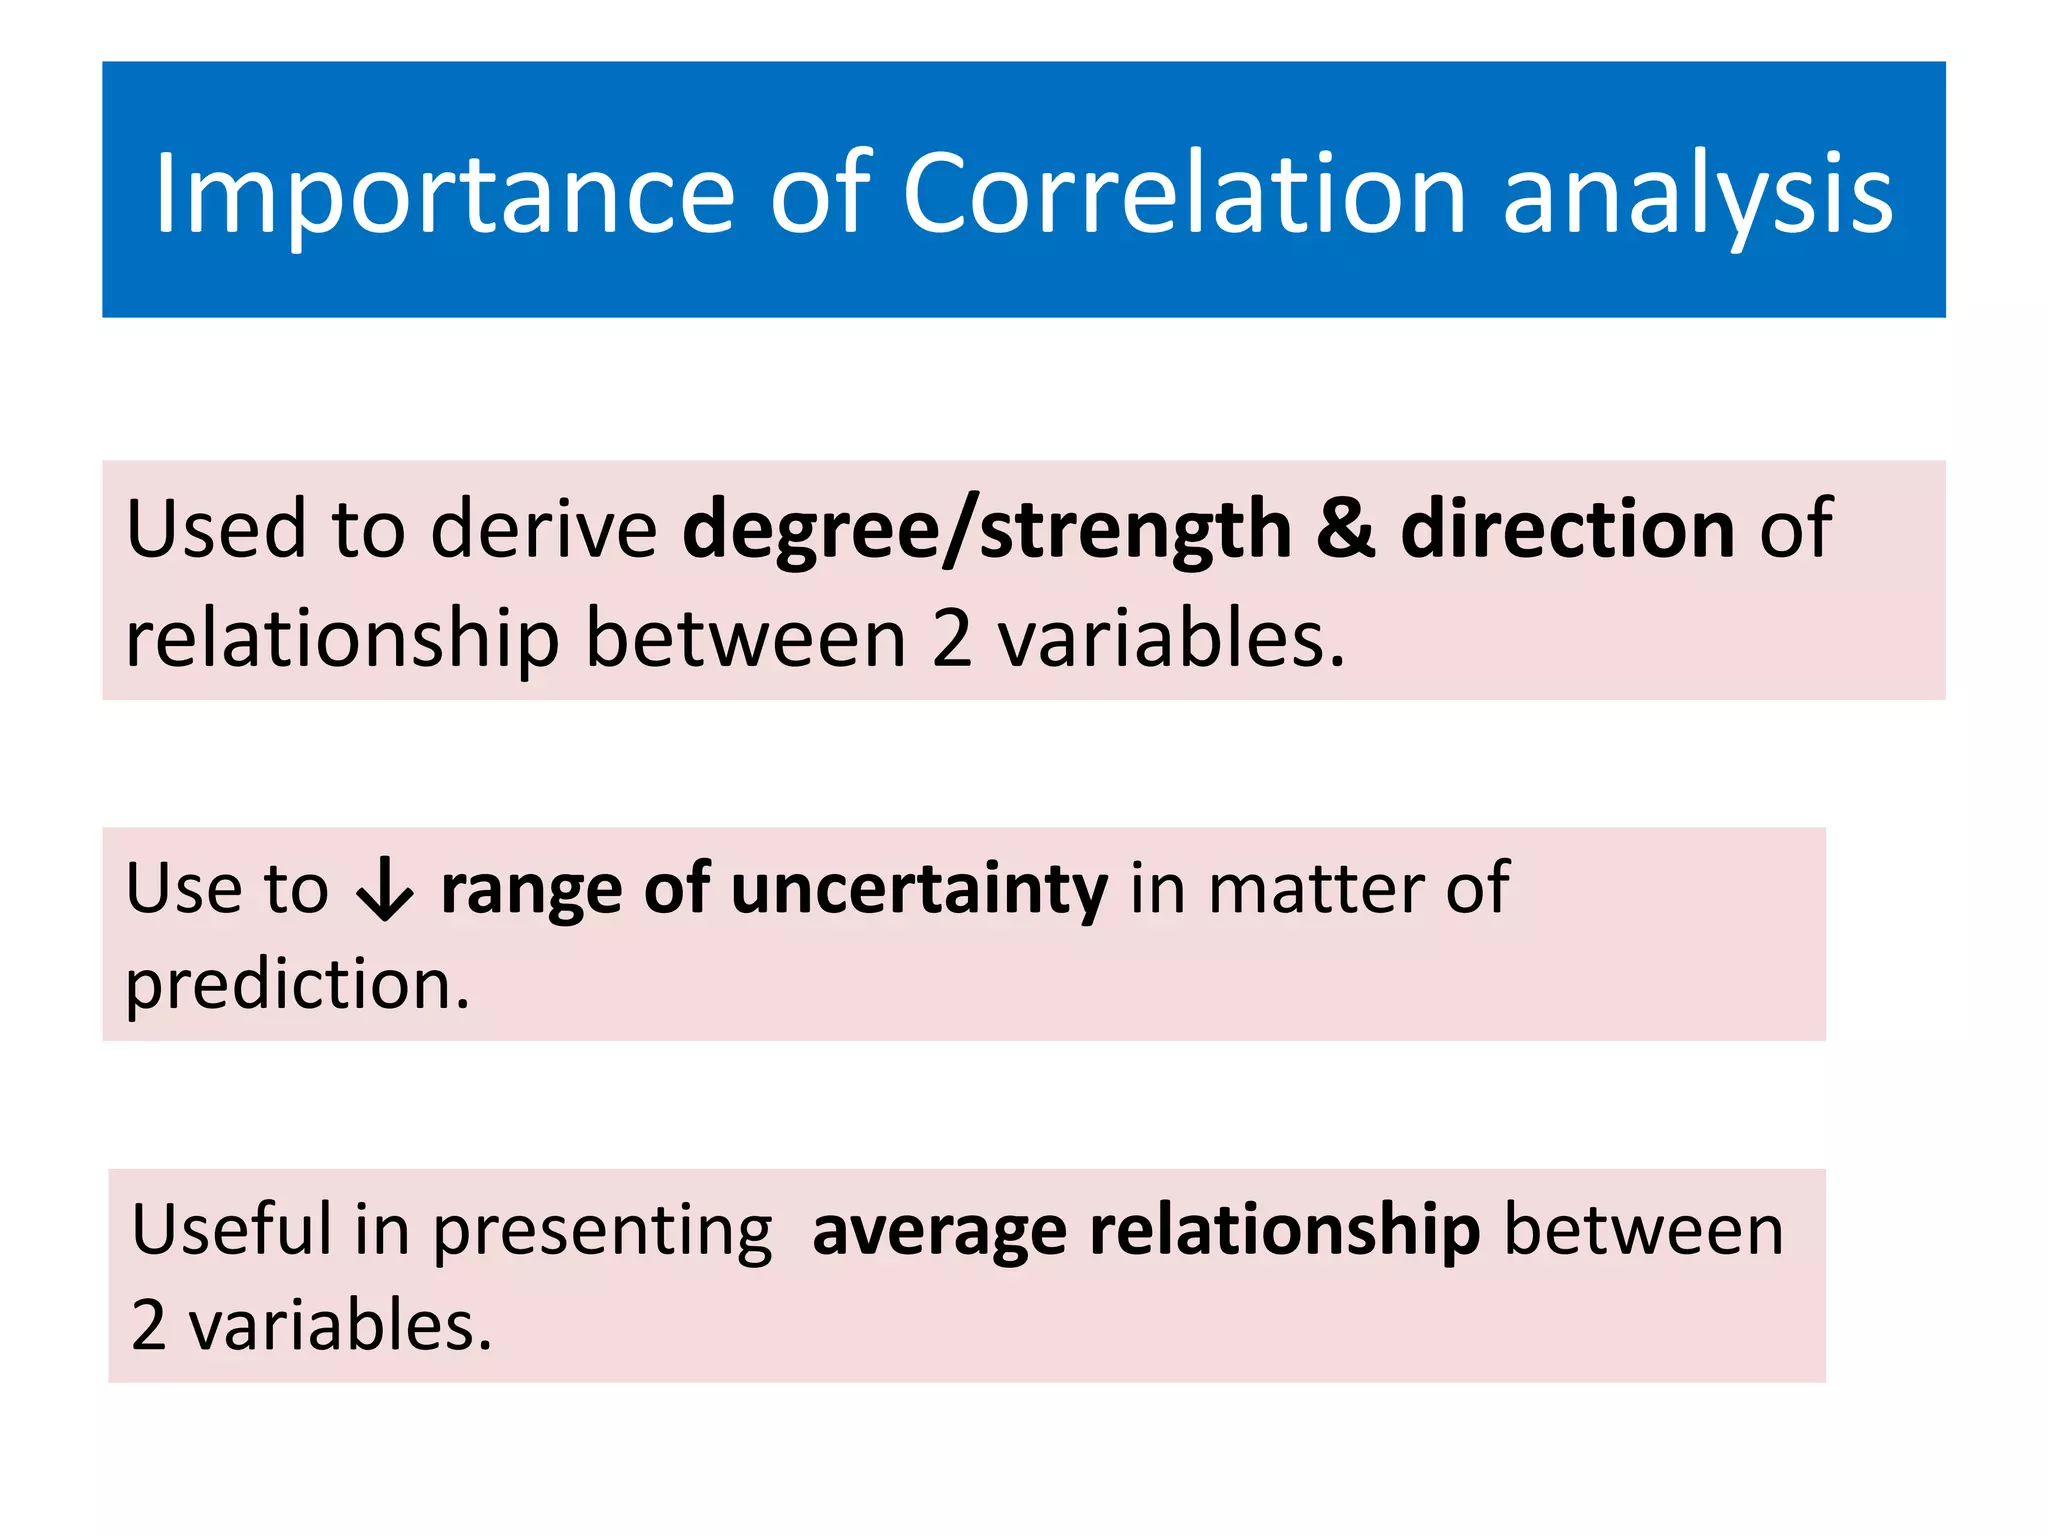


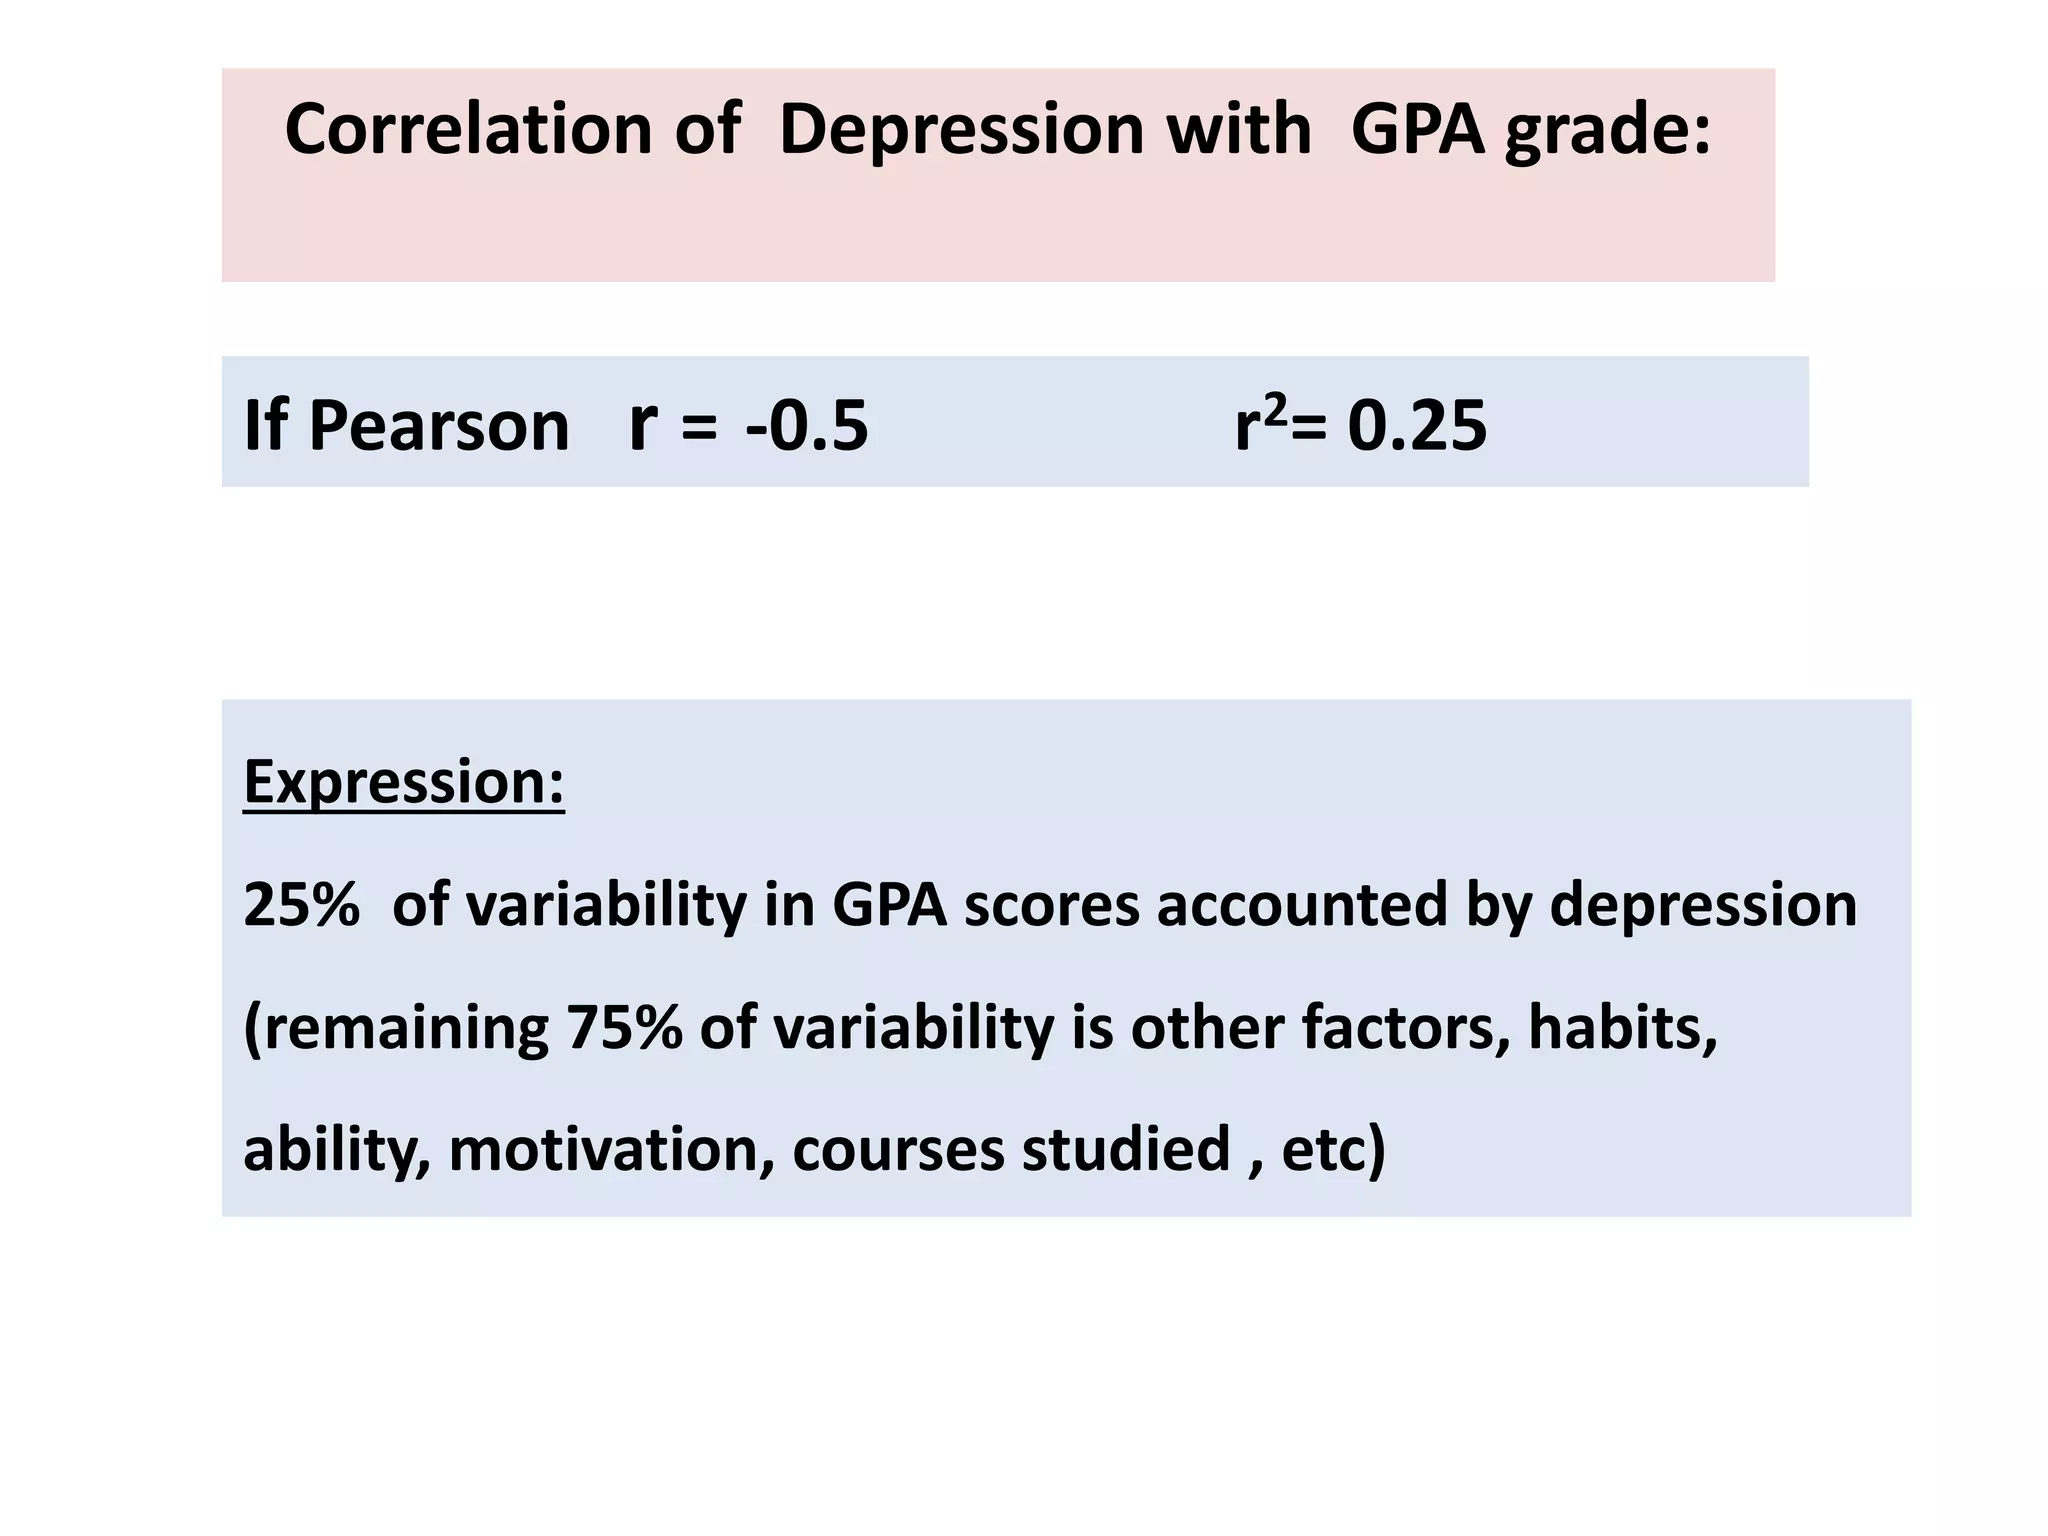


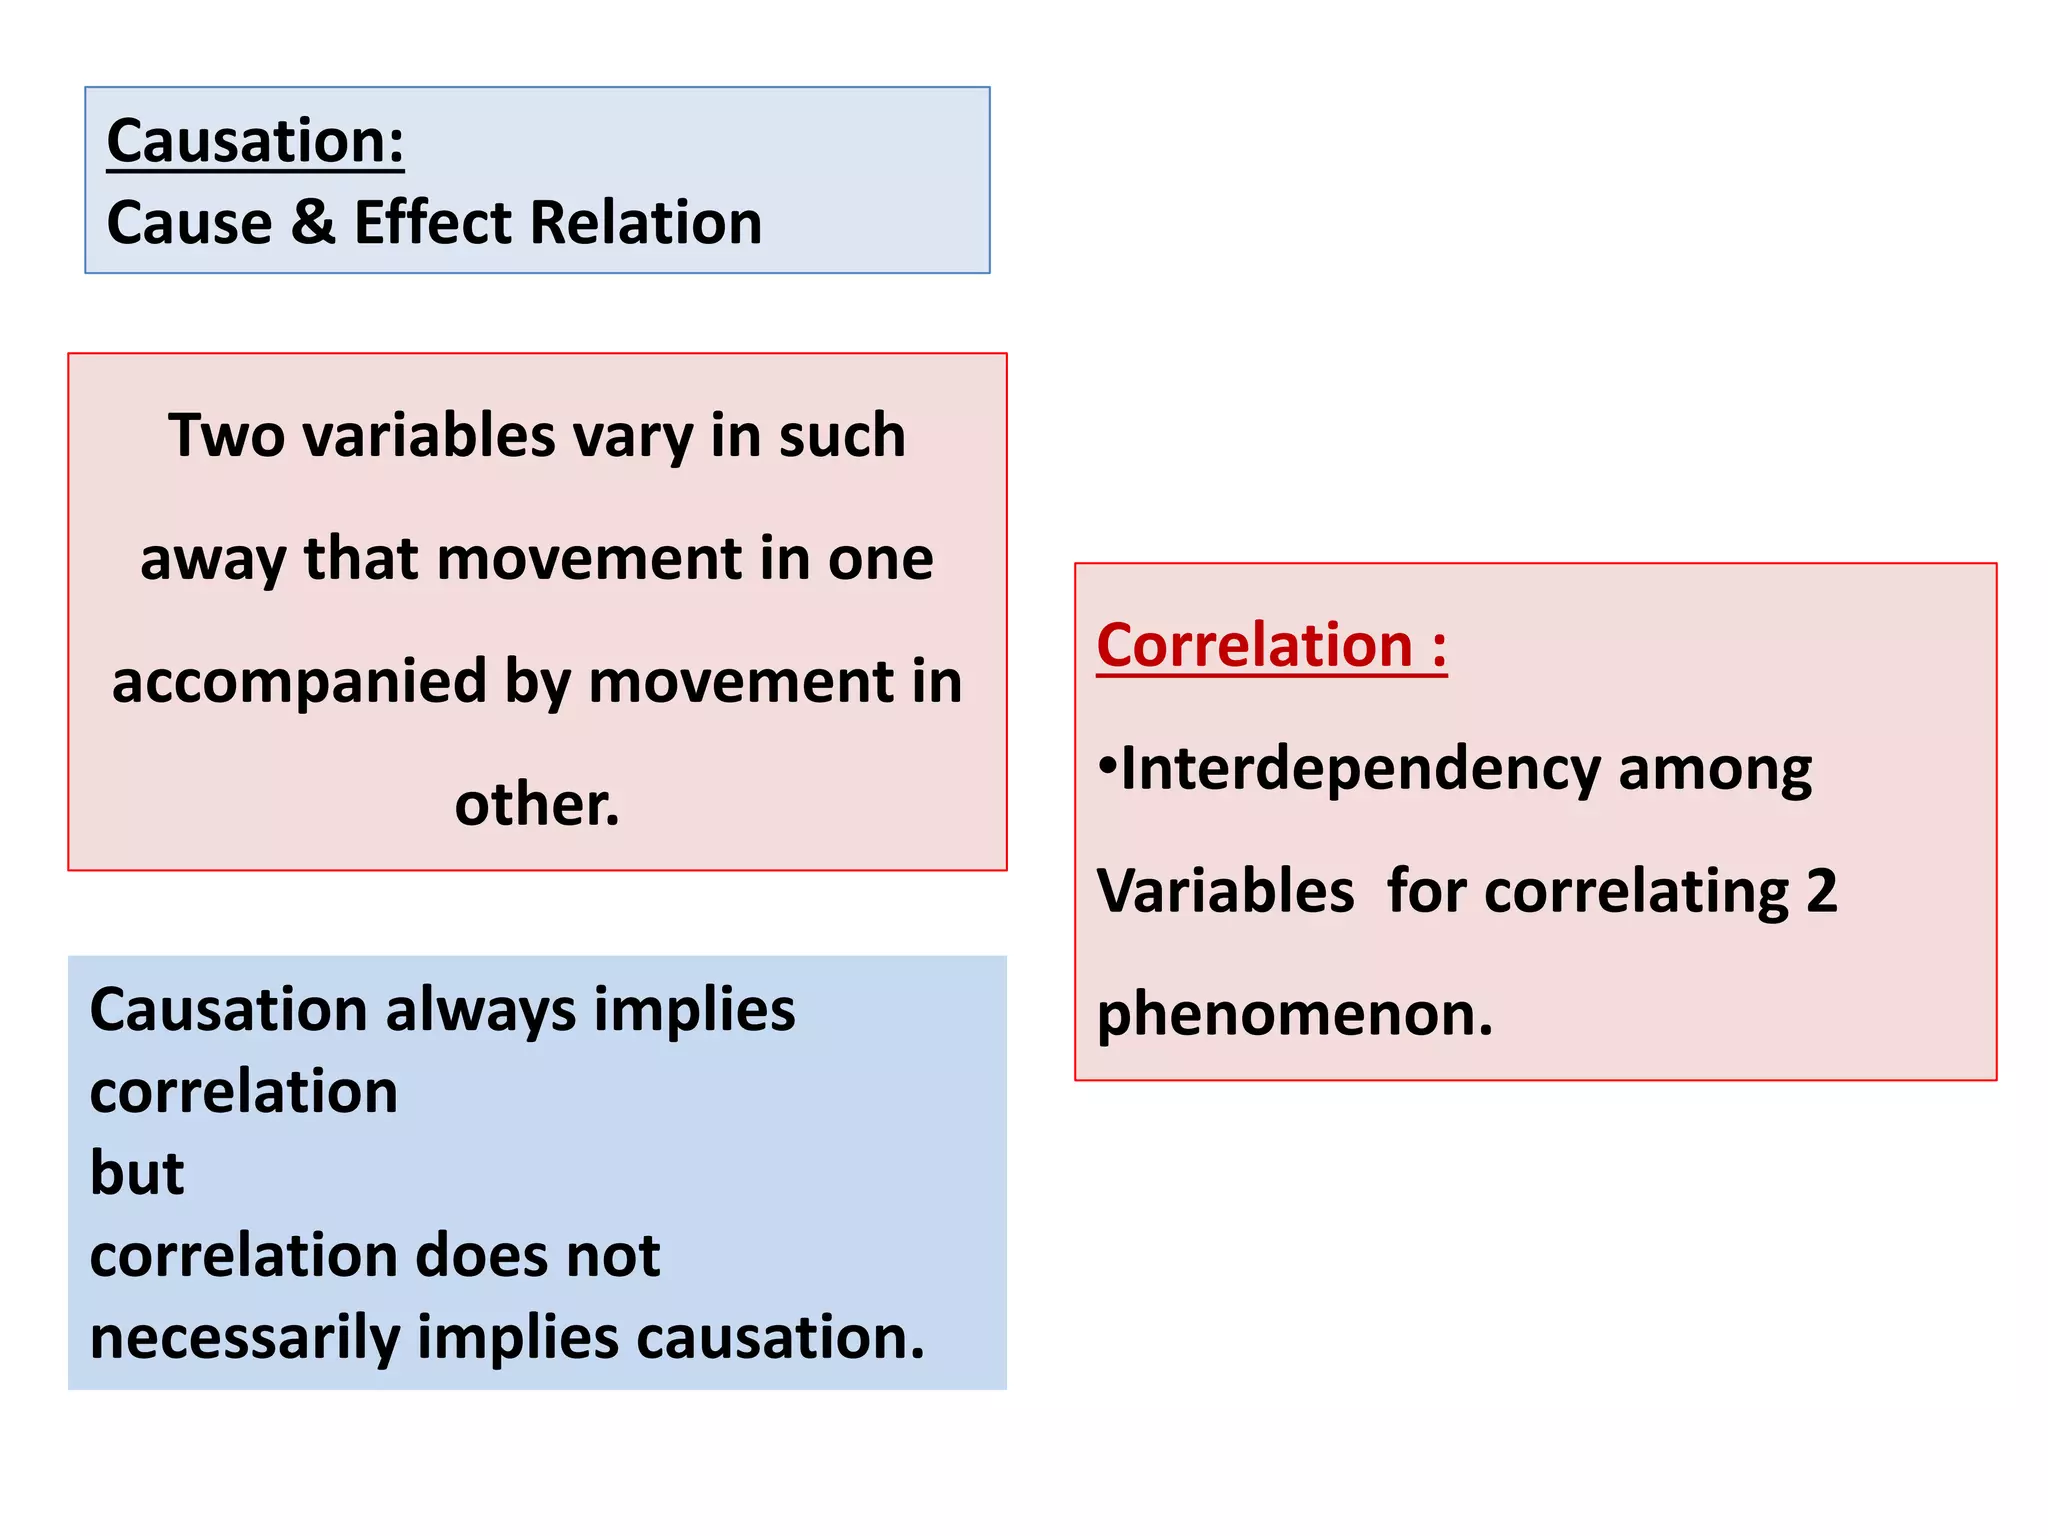
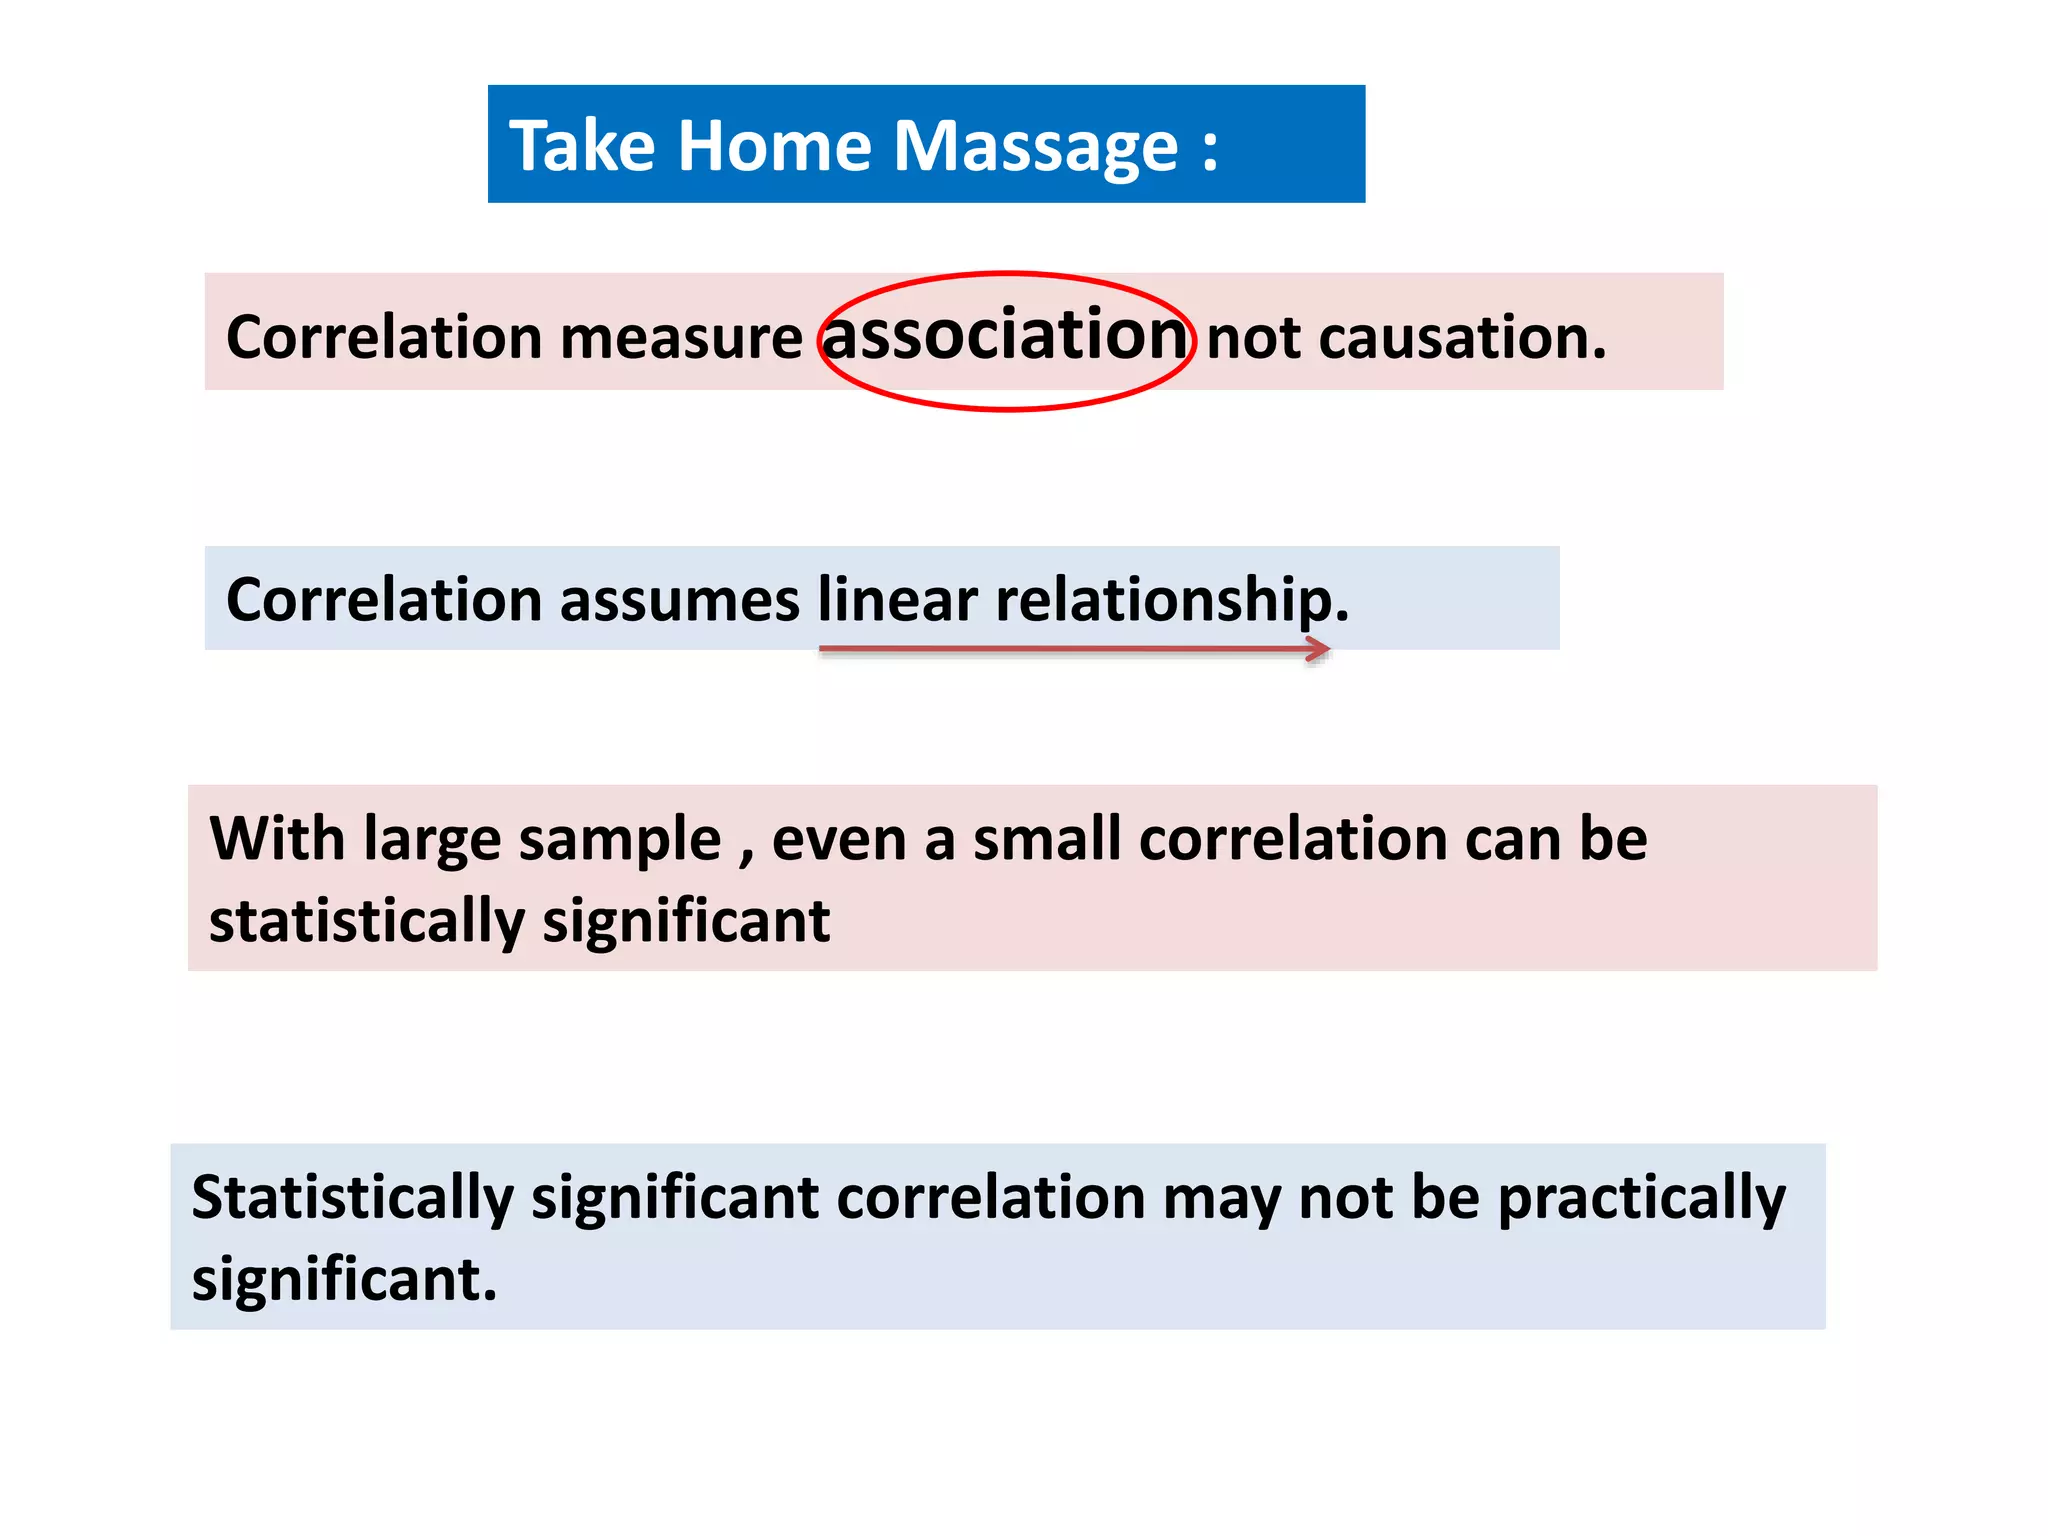


This document provides an overview of correlation, including: - Definitions of correlation and the concept of correlation being introduced in 1888. - The different types of correlation (positive, negative, zero, linear, non-linear, simple, multiple, partial). - Methods of studying correlation including graphic (scatter plots) and algebraic (correlation coefficients). - Karl Pearson's correlation coefficient and Spearman's rank correlation coefficient as measures of the strength and direction of linear relationships between variables. - The coefficient of determination which explains the percentage of variation in one variable explained by the other. - The importance of correlation analysis in determining relationships between variables and reducing uncertainty. - That correlation indicates association