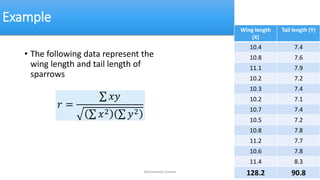
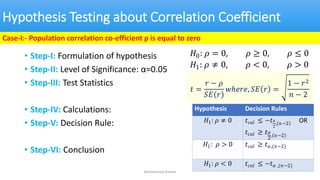
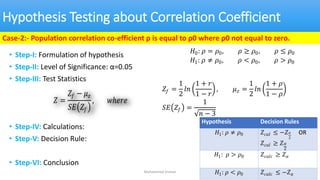
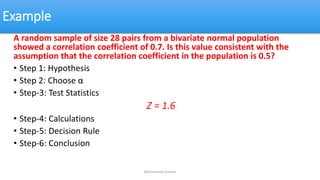
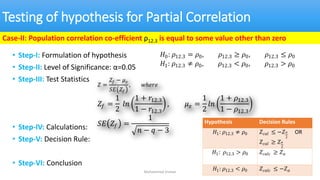
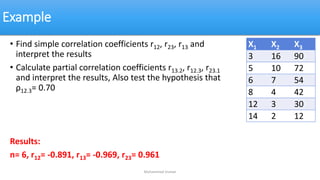
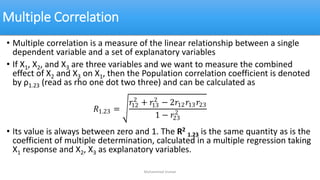
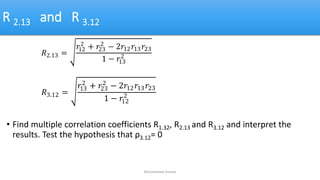
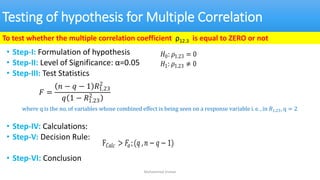
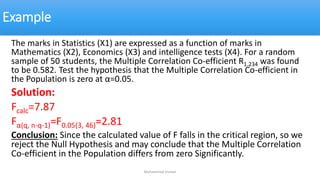
Simple, Partial and Multiple
Correlation
Scatter Plot Examples
y
x
y
x
y
y
x
x
Strong relationships Weak relationships
Muhammad Usman
Scatter Plot Examples
y
x
y
x
No relationship
(continued)
Muhammad Usman
r = +0.3 r = +1
Examples of Approximate “r” values
y
x
y
x
y
x
y
x
y
x
r = -1 r = -0.6 r = 0
Muhammad Usman
Correlation Coefficient
• Measure of the degree of linear association between two variables.
• The population correlation coefficient ρ (rho)
• The sample correlation coefficient r is an estimate of ρ
Muhammad Usman
Features of ρ and r
•Range between -1 and 1
•It is symmetrical w.r.t variables i.e., rxy = ryx
•Unit free
•“r” is independent of change in origin and scale
• The closer to -1, the stronger the negative linear relationship
• The closer to 1, the stronger the positive linear relationship
• The closer to 0, the weaker the linear relationship
Muhammad Usman
• The value of r ranges between ( -1) and ( +1)
• The value of r denotes the strength of the association as
illustrated by the following diagram.
-1 1
0
-0.25
-0.75 0.75
0.25
strong strong
intermediate intermediate
weak weak
no relation
perfect
correlation
perfect
correlation
Direct
indirect
Muhammad Usman
Example
• The following data represent the Study hours and
the Marks of 7 students in the subject of
Mathematics. Find the Correlation Coefficient ‘r’
and interpret it.
• Coefficient of Correlation r = 0.804
Muhammad Usman
Study hours
X
Marks
Y
5 50
3 35
5 45
3 26
4 30
3 35
4 40
𝑟 =
𝑥𝑦
𝑥2 𝑦2
Example
• The following data represent the
wing length and tail length of
sparrows
Wing length
(X)
Tail length (Y)
10.4 7.4
10.8 7.6
11.1 7.9
10.2 7.2
10.3 7.4
10.2 7.1
10.7 7.4
10.5 7.2
10.8 7.8
11.2 7.7
10.6 7.8
11.4 8.3
128.2 90.8
Muhammad Usman
𝑟 =
𝑥𝑦
𝑥2 𝑦2
Hypothesis Testing about Correlation Coefficient
• Step-I: Formulation of hypothesis
• Step-II: Level of Significance: α=0.05
• Step-III: Test Statistics
• Step-IV: Calculations:
• Step-V: Decision Rule:
• Step-VI: Conclusion
𝐻0: 𝜌 = 0, 𝜌 ≥ 0, 𝜌 ≤ 0
𝐻1: 𝜌 ≠ 0, 𝜌 < 0, 𝜌 > 0
Case-I:- Population correlation co-efficient ρ is equal to zero
𝑡 =
𝑟 − 𝜌
𝑆𝐸 𝑟
𝑤ℎ𝑒𝑟𝑒, 𝑆𝐸 𝑟 =
1 − 𝑟2
𝑛 − 2
Muhammad Usman
Hypothesis Decision Rules
𝐻1: 𝜌 ≠ 0 𝑡𝑐𝑎𝑙 ≤ −𝑡𝛼
2
, 𝑛−2 OR
𝑡𝑐𝑎𝑙 ≥ 𝑡𝛼
2
, 𝑛−2
𝐻1: 𝜌 > 0 𝑡𝑐𝑎𝑙 ≥ 𝑡𝛼,(𝑛−2)
𝐻1: 𝜌 < 0 𝑡𝑐𝑎𝑙 ≤ −𝑡𝛼 ,(𝑛−2)
Hypothesis Testing about Correlation Coefficient
• Step-I: Formulation of hypothesis
• Step-II: Level of Significance: α=0.05
• Step-III: Test Statistics
• Step-IV: Calculations:
• Step-V: Decision Rule:
• Step-VI: Conclusion
Case-2:- Population correlation co-efficient ρ is equal to ρ0 where ρ0 not equal to zero.
𝐻0: 𝜌 = 𝜌0, 𝜌 ≥ 𝜌0, 𝜌 ≤ 𝜌0
𝐻1: 𝜌 ≠ 𝜌0, 𝜌 < 𝜌0, 𝜌 > 𝜌0
𝑍 =
𝑍𝑓 − 𝜇𝑧
𝑆𝐸 𝑍𝑓
, 𝑤ℎ𝑒𝑟𝑒
𝑍𝑓 =
1
2
𝑙𝑛
1 + 𝑟
1 − 𝑟
, 𝜇𝑧 =
1
2
𝑙𝑛
1 + 𝜌
1 − 𝜌
𝑆𝐸 𝑍𝑓 =
1
𝑛 − 3
Muhammad Usman
Hypothesis Decision Rules
𝐻1: 𝜌 ≠ 𝜌0 𝑍𝑐𝑎𝑙 ≤ −𝑍𝛼
2
OR
𝑍𝑐𝑎𝑙 ≥ 𝑍𝛼
2
𝐻1: 𝜌 > 𝜌0 𝑍𝑐𝑎𝑙𝑐 ≥ 𝑍𝛼
𝐻1: 𝜌 < 𝜌0 𝑍𝑐𝑎𝑙𝑐 ≤ −𝑍𝛼
Example
A random sample of size 28 pairs from a bivariate normal population
showed a correlation coefficient of 0.7. Is this value consistent with the
assumption that the correlation coefficient in the population is 0.5?
• Step 1: Hypothesis
• Step 2: Choose α
• Step-3: Test Statistics
Z = 1.6
• Step-4: Calculations
• Step-5: Decision Rule
• Step-6: Conclusion
Muhammad Usman
Partial Correlation
• The relationship between two variables may be affected by other variables
which either strengthen or weakens the relationship.
• Partial correlation is a measure of the strength of a relationship between two
variables while controlling for the effect of one or more other variables.
• Monthly Income and Education Level of an individual is affected by the
Experience of the individual. To get the REAL relationship between two
variables other extraneous factors which are suspected to affect the
relationship are controlled or partial out by the use of partial correlation
coefficients.
• Similarly, you might want to see if there is a correlation between caloric intake
and blood pressure, while controlling for weight or amount of exercise.
Muhammad Usman
Partial Correlation Coefficient
• If we have three variables X1, X2, and X3 then the population partial correlation
coefficient between X1 and X2, keeping the effect of X3 constant is denoted by
ρ12.3(read as rho one two dot three) and can be calculated in terms of simple
correlation coefficients as follows.
• r12 is the simple correlation coefficient between X1 and X2
• r13 is the simple correlation coefficient between X1 and X3
• r23 is the simple correlation coefficient between X2 and X3
Muhammad Usman
𝑟12.3 =
𝑟12 − 𝑟13𝑟23
1 − 𝑟13
2
∗ 1 − 𝑟23
2
r12 = r21
r13 = r31
r23 = r32
r13.2 and r23.1
• Similarly we can compute
• r12.3 r13.2 and r23.1 are known as first order partial correlation.
Muhammad Usman
𝑟13.2 =
𝑟13 − 𝑟12𝑟23
1 − 𝑟12
2
∗ 1 − 𝑟23
2
𝑟23.1 =
𝑟23 − 𝑟12𝑟13
1 − 𝑟12
2
∗ 1 − 𝑟13
2
Testing of hypothesis for Partial Correlation
The procedure of testing of hypothesis for Partial Correlation is similar to the
Simple Correlation
Case-I:- Population correlation co-efficient ρ12.3 is equal to zero
Case-2:- Population correlation co-efficient ρ12.3 is equal to some value other
than zero
Muhammad Usman
Testing of hypothesis for Partial Correlation
• Step-I: Formulation of hypothesis
• Step-II: Level of Significance: α=0.05
• Step-III: Test Statistics
• Step-IV: Calculations:
• Step-V: Decision Rule:
• Step-VI: Conclusion
Case-I:- Population correlation co-efficient ρ12.3 is equal to zero
Muhammad Usman
𝐻0: 𝜌12.3 = 0, 𝜌12.3 ≥ 0, 𝜌12.3 ≤ 0
𝐻1: 𝜌12.3 ≠ 0, 𝜌12.3 < 0, 𝜌12.3 > 0
Hypothesis Decision Rules
𝐻1: 𝜌12.3 ≠ 0 𝑡𝑐𝑎𝑙 ≤ −𝑡𝛼
2
, 𝑛−𝑞−2 OR
𝑡𝑐𝑎𝑙 ≥ 𝑡𝛼
2
, 𝑛−𝑞−2
𝐻1: 𝜌12.3 > 0 𝑡𝑐𝑎𝑙𝑐 ≥ 𝑡𝛼,(𝑛−𝑞−2)
𝐻1: 𝜌12.3 < 0 𝑡𝑐𝑎𝑙𝑐 ≤ −𝑡𝛼 ,(𝑛−𝑞−2)
𝑡 =
𝑟12.3 − 𝜌12.3
𝑆𝐸 𝑟12.3
𝑤ℎ𝑒𝑟𝑒, 𝑆𝐸 𝑟12.3 =
1 − 𝑟12.3
2
𝑛 − q − 2
, q is the number of variable kept constant
Testing of hypothesis for Partial Correlation
• Step-I: Formulation of hypothesis
• Step-II: Level of Significance: α=0.05
• Step-III: Test Statistics
• Step-IV: Calculations:
• Step-V: Decision Rule:
• Step-VI: Conclusion
Case-II: Population correlation co-efficient ρ12.3 is equal to some value other than zero
Muhammad Usman
𝐻0: 𝜌12.3 = 𝜌0, 𝜌12.3 ≥ 𝜌0, 𝜌12.3 ≤ 𝜌0
𝐻1: 𝜌12.3 ≠ 𝜌0, 𝜌12.3 < 𝜌0, 𝜌12.3 > 𝜌0
𝑍 =
𝑍𝑓 − 𝜇𝑧
𝑆𝐸 𝑍𝑓
, 𝑤ℎ𝑒𝑟𝑒
𝑍𝑓 =
1
2
𝑙𝑛
1 + 𝑟12.3
1 − 𝑟12.3
, 𝜇𝑧 =
1
2
𝑙𝑛
1 + 𝜌12.3
1 − 𝜌12.3
𝑆𝐸 𝑍𝑓 =
1
𝑛 − 𝑞 − 3
Hypothesis Decision Rules
𝐻1: 𝜌12.3 ≠ 𝜌0 𝑍𝑐𝑎𝑙 ≤ −𝑍𝛼
2
OR
𝑍𝑐𝑎𝑙 ≥ 𝑍𝛼
2
𝐻1: 𝜌12.3 > 𝜌0 𝑍𝑐𝑎𝑙𝑐 ≥ 𝑍𝛼
𝐻1: 𝜌12.3 < 𝜌0 𝑍𝑐𝑎𝑙𝑐 ≤ −𝑍𝛼
Example
Muhammad Usman
• Find simple correlation coefficients r12, r23, r13 and
interpret the results
• Calculate partial correlation coefficients r13.2, r12.3, r23.1
and interpret the results, Also test the hypothesis that
ρ12.3= 0.70
Results:
n= 6, r12= -0.891, r13= -0.969, r23= 0.961
X1 X2 X3
3 16 90
5 10 72
6 7 54
8 4 42
12 3 30
14 2 12
Multiple Correlation
• Multiple correlation is a measure of the linear relationship between a single
dependent variable and a set of explanatory variables
• If X1, X2, and X3 are three variables and we want to measure the combined
effect of X2 and X3 on X1, then the Population correlation coefficient is denoted
by ρ1.23 (read as rho one dot two three) and can be calculated as
• Its value is always between zero and 1. The R2
1.23 is the same quantity as is the
coefficient of multiple determination, calculated in a multiple regression taking
X1 response and X2, X3 as explanatory variables.
Muhammad Usman
𝑅1.23 =
𝑟12
2
+ 𝑟13
2
− 2𝑟12𝑟13𝑟23
1 − 𝑟23
2
R 2.13 and R 3.12
• Find multiple correlation coefficients R1.32, R2.13 and R3.12 and interpret the
results. Test the hypothesis that ρ3.12= 0
Muhammad Usman
𝑅2.13 =
𝑟12
2
+ 𝑟23
2
− 2𝑟12𝑟13𝑟23
1 − 𝑟13
2
𝑅3.12 =
𝑟13
2
+ 𝑟23
2
− 2𝑟12𝑟13𝑟23
1 − 𝑟12
2
Testing of hypothesis for Multiple Correlation
• Step-I: Formulation of hypothesis
• Step-II: Level of Significance: α=0.05
• Step-III: Test Statistics
• Step-IV: Calculations:
• Step-V: Decision Rule:
• Step-VI: Conclusion
Muhammad Usman
To test whether the multiple correlation coefficient ρ12.3 is equal to ZERO or not
𝐻0: 𝜌1.23 = 0
𝐻1: 𝜌1.23 ≠ 0
𝐹 =
𝑛 − 𝑞 − 1 𝑅1.23
2
𝑞 1 − 𝑅1.23
2
where q is the no. of variables whose combined effect is being seen on a response variable i. e. , in 𝑅1.23, q = 2
F𝐶𝑎𝑙𝑐 > 𝐹𝛼;(𝑞 ,𝑛 − 𝑞 − 1)
Example
The marks in Statistics (X1) are expressed as a function of marks in
Mathematics (X2), Economics (X3) and intelligence tests (X4). For a random
sample of 50 students, the Multiple Correlation Co-efficient R1.234 was found
to be 0.582. Test the hypothesis that the Multiple Correlation Co-efficient in
the Population is zero at α=0.05.
Solution:
Fcalc=7.87
Fα(q, n-q-1)=F0.05(3, 46)=2.81
Conclusion: Since the calculated value of F falls in the critical region, so we
reject the Null Hypothesis and may conclude that the Multiple Correlation
Co-efficient in the Population differs from zero Significantly.
Muhammad Usman

03_Simple-Partial-Multiple-Correlation.pdf

  • 1.
    Simple, Partial andMultiple Correlation
  • 2.
    Scatter Plot Examples y x y x y y x x Strongrelationships Weak relationships Muhammad Usman
  • 3.
    Scatter Plot Examples y x y x Norelationship (continued) Muhammad Usman
  • 4.
    r = +0.3r = +1 Examples of Approximate “r” values y x y x y x y x y x r = -1 r = -0.6 r = 0 Muhammad Usman
  • 5.
    Correlation Coefficient • Measureof the degree of linear association between two variables. • The population correlation coefficient ρ (rho) • The sample correlation coefficient r is an estimate of ρ Muhammad Usman
  • 6.
    Features of ρand r •Range between -1 and 1 •It is symmetrical w.r.t variables i.e., rxy = ryx •Unit free •“r” is independent of change in origin and scale • The closer to -1, the stronger the negative linear relationship • The closer to 1, the stronger the positive linear relationship • The closer to 0, the weaker the linear relationship Muhammad Usman
  • 7.
    • The valueof r ranges between ( -1) and ( +1) • The value of r denotes the strength of the association as illustrated by the following diagram. -1 1 0 -0.25 -0.75 0.75 0.25 strong strong intermediate intermediate weak weak no relation perfect correlation perfect correlation Direct indirect Muhammad Usman
  • 8.
    Example • The followingdata represent the Study hours and the Marks of 7 students in the subject of Mathematics. Find the Correlation Coefficient ‘r’ and interpret it. • Coefficient of Correlation r = 0.804 Muhammad Usman Study hours X Marks Y 5 50 3 35 5 45 3 26 4 30 3 35 4 40 𝑟 = 𝑥𝑦 𝑥2 𝑦2
  • 9.
    Example • The followingdata represent the wing length and tail length of sparrows Wing length (X) Tail length (Y) 10.4 7.4 10.8 7.6 11.1 7.9 10.2 7.2 10.3 7.4 10.2 7.1 10.7 7.4 10.5 7.2 10.8 7.8 11.2 7.7 10.6 7.8 11.4 8.3 128.2 90.8 Muhammad Usman 𝑟 = 𝑥𝑦 𝑥2 𝑦2
  • 10.
    Hypothesis Testing aboutCorrelation Coefficient • Step-I: Formulation of hypothesis • Step-II: Level of Significance: α=0.05 • Step-III: Test Statistics • Step-IV: Calculations: • Step-V: Decision Rule: • Step-VI: Conclusion 𝐻0: 𝜌 = 0, 𝜌 ≥ 0, 𝜌 ≤ 0 𝐻1: 𝜌 ≠ 0, 𝜌 < 0, 𝜌 > 0 Case-I:- Population correlation co-efficient ρ is equal to zero 𝑡 = 𝑟 − 𝜌 𝑆𝐸 𝑟 𝑤ℎ𝑒𝑟𝑒, 𝑆𝐸 𝑟 = 1 − 𝑟2 𝑛 − 2 Muhammad Usman Hypothesis Decision Rules 𝐻1: 𝜌 ≠ 0 𝑡𝑐𝑎𝑙 ≤ −𝑡𝛼 2 , 𝑛−2 OR 𝑡𝑐𝑎𝑙 ≥ 𝑡𝛼 2 , 𝑛−2 𝐻1: 𝜌 > 0 𝑡𝑐𝑎𝑙 ≥ 𝑡𝛼,(𝑛−2) 𝐻1: 𝜌 < 0 𝑡𝑐𝑎𝑙 ≤ −𝑡𝛼 ,(𝑛−2)
  • 11.
    Hypothesis Testing aboutCorrelation Coefficient • Step-I: Formulation of hypothesis • Step-II: Level of Significance: α=0.05 • Step-III: Test Statistics • Step-IV: Calculations: • Step-V: Decision Rule: • Step-VI: Conclusion Case-2:- Population correlation co-efficient ρ is equal to ρ0 where ρ0 not equal to zero. 𝐻0: 𝜌 = 𝜌0, 𝜌 ≥ 𝜌0, 𝜌 ≤ 𝜌0 𝐻1: 𝜌 ≠ 𝜌0, 𝜌 < 𝜌0, 𝜌 > 𝜌0 𝑍 = 𝑍𝑓 − 𝜇𝑧 𝑆𝐸 𝑍𝑓 , 𝑤ℎ𝑒𝑟𝑒 𝑍𝑓 = 1 2 𝑙𝑛 1 + 𝑟 1 − 𝑟 , 𝜇𝑧 = 1 2 𝑙𝑛 1 + 𝜌 1 − 𝜌 𝑆𝐸 𝑍𝑓 = 1 𝑛 − 3 Muhammad Usman Hypothesis Decision Rules 𝐻1: 𝜌 ≠ 𝜌0 𝑍𝑐𝑎𝑙 ≤ −𝑍𝛼 2 OR 𝑍𝑐𝑎𝑙 ≥ 𝑍𝛼 2 𝐻1: 𝜌 > 𝜌0 𝑍𝑐𝑎𝑙𝑐 ≥ 𝑍𝛼 𝐻1: 𝜌 < 𝜌0 𝑍𝑐𝑎𝑙𝑐 ≤ −𝑍𝛼
  • 12.
    Example A random sampleof size 28 pairs from a bivariate normal population showed a correlation coefficient of 0.7. Is this value consistent with the assumption that the correlation coefficient in the population is 0.5? • Step 1: Hypothesis • Step 2: Choose α • Step-3: Test Statistics Z = 1.6 • Step-4: Calculations • Step-5: Decision Rule • Step-6: Conclusion Muhammad Usman
  • 13.
    Partial Correlation • Therelationship between two variables may be affected by other variables which either strengthen or weakens the relationship. • Partial correlation is a measure of the strength of a relationship between two variables while controlling for the effect of one or more other variables. • Monthly Income and Education Level of an individual is affected by the Experience of the individual. To get the REAL relationship between two variables other extraneous factors which are suspected to affect the relationship are controlled or partial out by the use of partial correlation coefficients. • Similarly, you might want to see if there is a correlation between caloric intake and blood pressure, while controlling for weight or amount of exercise. Muhammad Usman
  • 14.
    Partial Correlation Coefficient •If we have three variables X1, X2, and X3 then the population partial correlation coefficient between X1 and X2, keeping the effect of X3 constant is denoted by ρ12.3(read as rho one two dot three) and can be calculated in terms of simple correlation coefficients as follows. • r12 is the simple correlation coefficient between X1 and X2 • r13 is the simple correlation coefficient between X1 and X3 • r23 is the simple correlation coefficient between X2 and X3 Muhammad Usman 𝑟12.3 = 𝑟12 − 𝑟13𝑟23 1 − 𝑟13 2 ∗ 1 − 𝑟23 2 r12 = r21 r13 = r31 r23 = r32
  • 15.
    r13.2 and r23.1 •Similarly we can compute • r12.3 r13.2 and r23.1 are known as first order partial correlation. Muhammad Usman 𝑟13.2 = 𝑟13 − 𝑟12𝑟23 1 − 𝑟12 2 ∗ 1 − 𝑟23 2 𝑟23.1 = 𝑟23 − 𝑟12𝑟13 1 − 𝑟12 2 ∗ 1 − 𝑟13 2
  • 16.
    Testing of hypothesisfor Partial Correlation The procedure of testing of hypothesis for Partial Correlation is similar to the Simple Correlation Case-I:- Population correlation co-efficient ρ12.3 is equal to zero Case-2:- Population correlation co-efficient ρ12.3 is equal to some value other than zero Muhammad Usman
  • 17.
    Testing of hypothesisfor Partial Correlation • Step-I: Formulation of hypothesis • Step-II: Level of Significance: α=0.05 • Step-III: Test Statistics • Step-IV: Calculations: • Step-V: Decision Rule: • Step-VI: Conclusion Case-I:- Population correlation co-efficient ρ12.3 is equal to zero Muhammad Usman 𝐻0: 𝜌12.3 = 0, 𝜌12.3 ≥ 0, 𝜌12.3 ≤ 0 𝐻1: 𝜌12.3 ≠ 0, 𝜌12.3 < 0, 𝜌12.3 > 0 Hypothesis Decision Rules 𝐻1: 𝜌12.3 ≠ 0 𝑡𝑐𝑎𝑙 ≤ −𝑡𝛼 2 , 𝑛−𝑞−2 OR 𝑡𝑐𝑎𝑙 ≥ 𝑡𝛼 2 , 𝑛−𝑞−2 𝐻1: 𝜌12.3 > 0 𝑡𝑐𝑎𝑙𝑐 ≥ 𝑡𝛼,(𝑛−𝑞−2) 𝐻1: 𝜌12.3 < 0 𝑡𝑐𝑎𝑙𝑐 ≤ −𝑡𝛼 ,(𝑛−𝑞−2) 𝑡 = 𝑟12.3 − 𝜌12.3 𝑆𝐸 𝑟12.3 𝑤ℎ𝑒𝑟𝑒, 𝑆𝐸 𝑟12.3 = 1 − 𝑟12.3 2 𝑛 − q − 2 , q is the number of variable kept constant
  • 18.
    Testing of hypothesisfor Partial Correlation • Step-I: Formulation of hypothesis • Step-II: Level of Significance: α=0.05 • Step-III: Test Statistics • Step-IV: Calculations: • Step-V: Decision Rule: • Step-VI: Conclusion Case-II: Population correlation co-efficient ρ12.3 is equal to some value other than zero Muhammad Usman 𝐻0: 𝜌12.3 = 𝜌0, 𝜌12.3 ≥ 𝜌0, 𝜌12.3 ≤ 𝜌0 𝐻1: 𝜌12.3 ≠ 𝜌0, 𝜌12.3 < 𝜌0, 𝜌12.3 > 𝜌0 𝑍 = 𝑍𝑓 − 𝜇𝑧 𝑆𝐸 𝑍𝑓 , 𝑤ℎ𝑒𝑟𝑒 𝑍𝑓 = 1 2 𝑙𝑛 1 + 𝑟12.3 1 − 𝑟12.3 , 𝜇𝑧 = 1 2 𝑙𝑛 1 + 𝜌12.3 1 − 𝜌12.3 𝑆𝐸 𝑍𝑓 = 1 𝑛 − 𝑞 − 3 Hypothesis Decision Rules 𝐻1: 𝜌12.3 ≠ 𝜌0 𝑍𝑐𝑎𝑙 ≤ −𝑍𝛼 2 OR 𝑍𝑐𝑎𝑙 ≥ 𝑍𝛼 2 𝐻1: 𝜌12.3 > 𝜌0 𝑍𝑐𝑎𝑙𝑐 ≥ 𝑍𝛼 𝐻1: 𝜌12.3 < 𝜌0 𝑍𝑐𝑎𝑙𝑐 ≤ −𝑍𝛼
  • 19.
    Example Muhammad Usman • Findsimple correlation coefficients r12, r23, r13 and interpret the results • Calculate partial correlation coefficients r13.2, r12.3, r23.1 and interpret the results, Also test the hypothesis that ρ12.3= 0.70 Results: n= 6, r12= -0.891, r13= -0.969, r23= 0.961 X1 X2 X3 3 16 90 5 10 72 6 7 54 8 4 42 12 3 30 14 2 12
  • 20.
    Multiple Correlation • Multiplecorrelation is a measure of the linear relationship between a single dependent variable and a set of explanatory variables • If X1, X2, and X3 are three variables and we want to measure the combined effect of X2 and X3 on X1, then the Population correlation coefficient is denoted by ρ1.23 (read as rho one dot two three) and can be calculated as • Its value is always between zero and 1. The R2 1.23 is the same quantity as is the coefficient of multiple determination, calculated in a multiple regression taking X1 response and X2, X3 as explanatory variables. Muhammad Usman 𝑅1.23 = 𝑟12 2 + 𝑟13 2 − 2𝑟12𝑟13𝑟23 1 − 𝑟23 2
  • 21.
    R 2.13 andR 3.12 • Find multiple correlation coefficients R1.32, R2.13 and R3.12 and interpret the results. Test the hypothesis that ρ3.12= 0 Muhammad Usman 𝑅2.13 = 𝑟12 2 + 𝑟23 2 − 2𝑟12𝑟13𝑟23 1 − 𝑟13 2 𝑅3.12 = 𝑟13 2 + 𝑟23 2 − 2𝑟12𝑟13𝑟23 1 − 𝑟12 2
  • 22.
    Testing of hypothesisfor Multiple Correlation • Step-I: Formulation of hypothesis • Step-II: Level of Significance: α=0.05 • Step-III: Test Statistics • Step-IV: Calculations: • Step-V: Decision Rule: • Step-VI: Conclusion Muhammad Usman To test whether the multiple correlation coefficient ρ12.3 is equal to ZERO or not 𝐻0: 𝜌1.23 = 0 𝐻1: 𝜌1.23 ≠ 0 𝐹 = 𝑛 − 𝑞 − 1 𝑅1.23 2 𝑞 1 − 𝑅1.23 2 where q is the no. of variables whose combined effect is being seen on a response variable i. e. , in 𝑅1.23, q = 2 F𝐶𝑎𝑙𝑐 > 𝐹𝛼;(𝑞 ,𝑛 − 𝑞 − 1)
  • 23.
    Example The marks inStatistics (X1) are expressed as a function of marks in Mathematics (X2), Economics (X3) and intelligence tests (X4). For a random sample of 50 students, the Multiple Correlation Co-efficient R1.234 was found to be 0.582. Test the hypothesis that the Multiple Correlation Co-efficient in the Population is zero at α=0.05. Solution: Fcalc=7.87 Fα(q, n-q-1)=F0.05(3, 46)=2.81 Conclusion: Since the calculated value of F falls in the critical region, so we reject the Null Hypothesis and may conclude that the Multiple Correlation Co-efficient in the Population differs from zero Significantly. Muhammad Usman