Downloaded 159 times
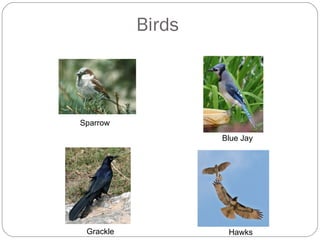
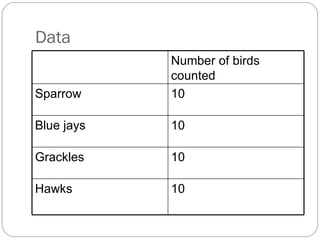
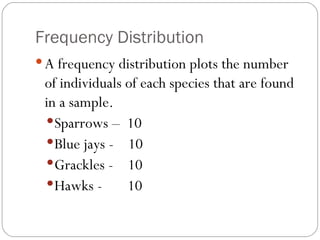
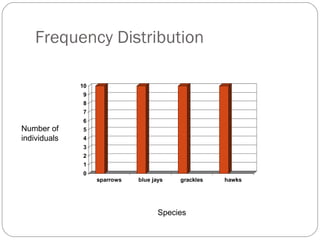
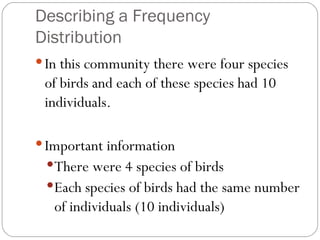
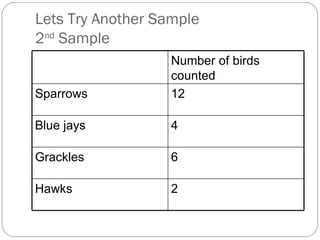
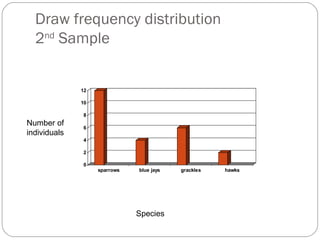
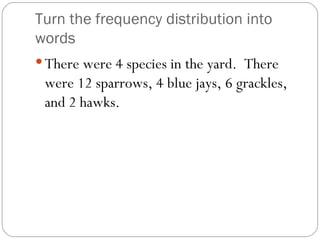
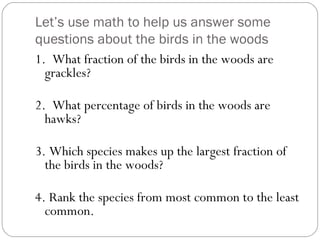
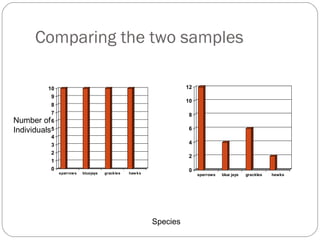
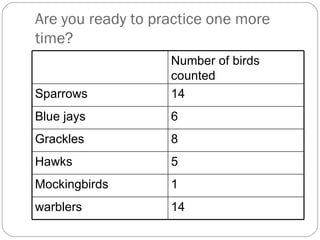
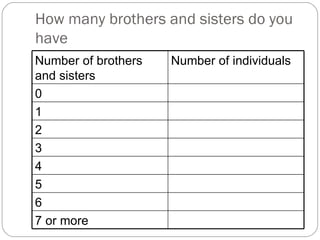
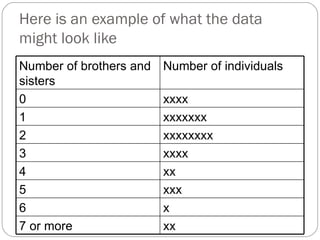
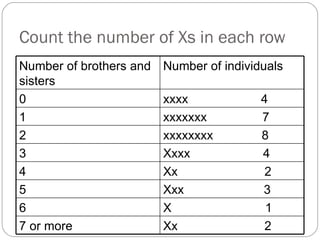
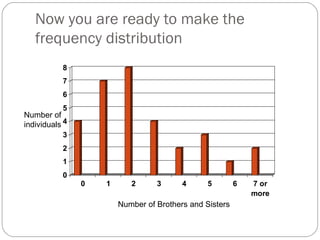

The document discusses frequency distributions, which are graphs used by biologists to visually display sampling data. It provides an example of a frequency distribution showing the numbers of different bird species counted in a woods. Students are instructed to practice describing frequency distributions in words and using math to answer questions about the data. Another example frequency distribution is given using data on numbers of siblings collected from a class.