Download as PPSX, PPTX


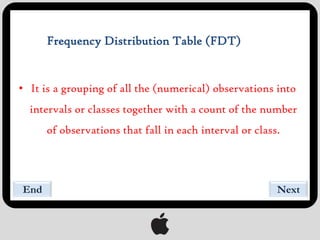
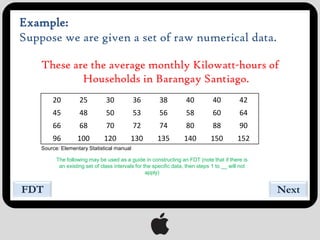
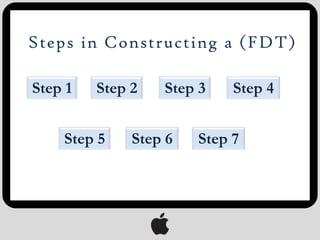
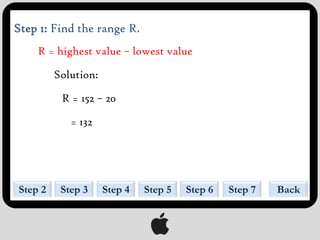
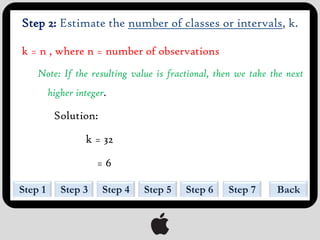

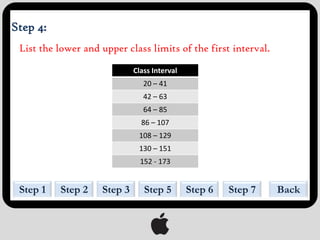
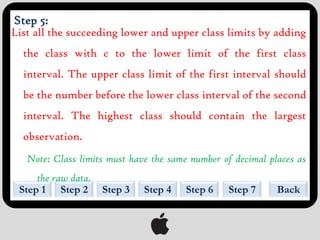
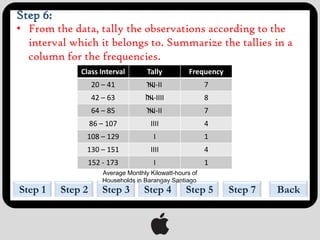
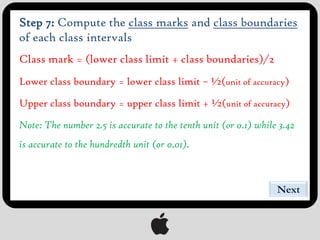
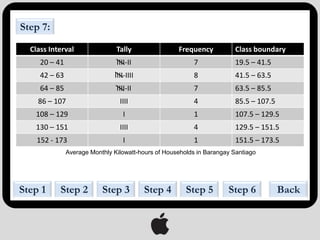
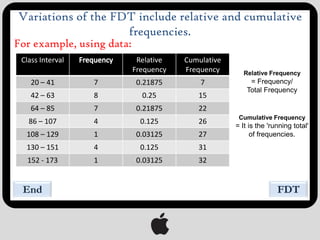

The document discusses the steps to construct a frequency distribution table (FDT): 1. Find the range and number of classes or intervals. 2. Estimate the class width and list the lower and upper class limits. 3. Tally the observations in each interval and record the frequencies. It also describes how to calculate relative frequencies and cumulative frequencies to vary the FDT.


