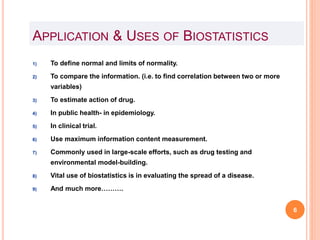
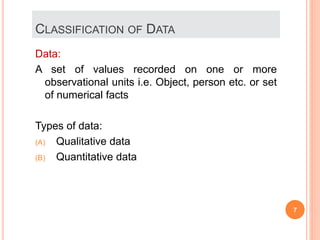
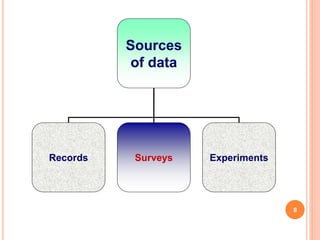
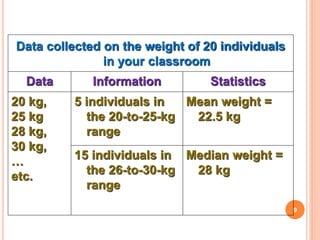
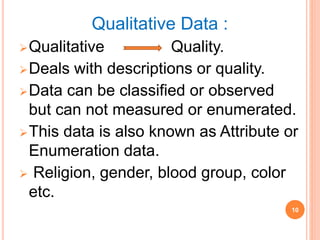
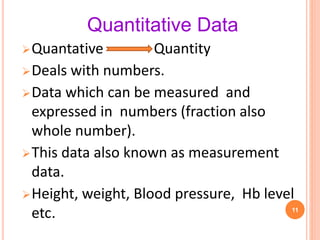
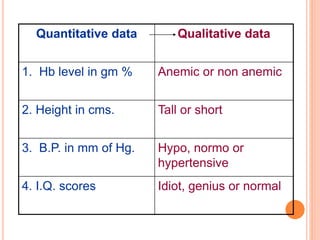
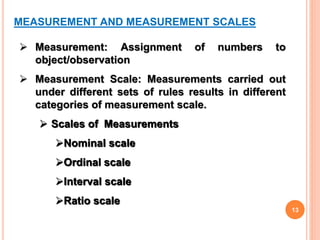
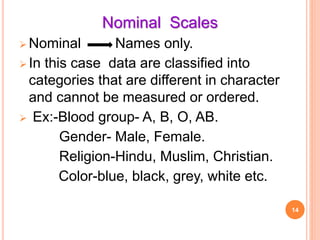
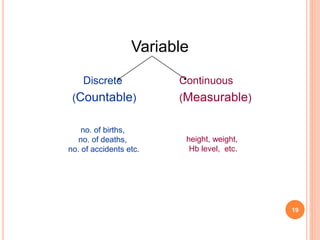
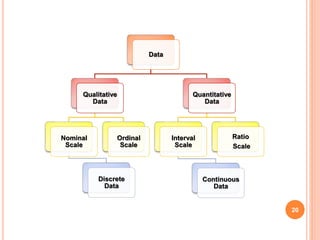
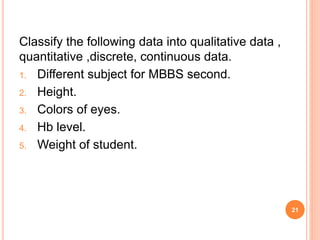
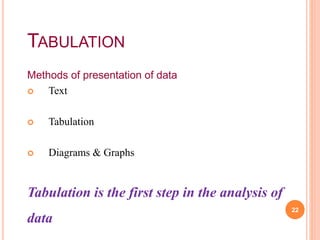
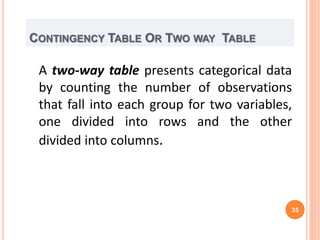
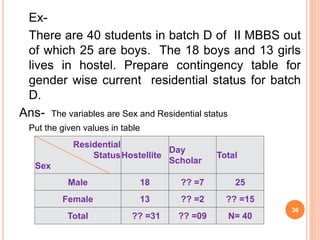
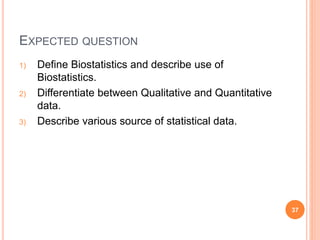
CLASSIFICATION & TABULATION OF
DATA
Jagdish D. Powar
Statistician cum Tutor
Community Medicine
SMBT, IMSRC, Nashik
COMPETENCY-CM6.2
CM6.2
Describe and discuss the principles and
demonstrate the methods of collection,
classification, analysis, interpretation and
presentation of statistical data
2
LEARNING OBJECTIVES
At the end of this session II PSY student should
be able to do
1. Describe and define the principles and the
methods of data collection.
2. Write the classification of data with reasonable
accuracy into Qualitative and Quantitative types.
3. Present the data using tables.
4. Prepare 2X2 table for Qualitative Data.
3
Statistics:
It is the science which deals with
development and application of the
most appropriate methods for the:
 Collection & classification of data.
 Presentation of the collected data.
 Analysis and interpretation of the
results.
 Making decisions on the basis of such
analysis.
4
Statistics in various areas
a) Bio-statistics -statistical processes and methods
applied to the collection, analysis, and
interpretation of biological data and especially
data relating to human biology, health, and
medicine.
b) Vital statistics - statistics relating to births,
deaths, marriages, health, and disease.
c) Heath Statistics
d) Agricultural statistics
e) Business statistics
f) Pharmaceutical statistics
5
APPLICATION & USES OF BIOSTATISTICS
1) To define normal and limits of normality.
2) To compare the information. (i.e. to find correlation between two or more
variables)
3) To estimate action of drug.
4) In public health- in epidemiology.
5) In clinical trial.
6) Use maximum information content measurement.
7) Commonly used in large-scale efforts, such as drug testing and
environmental model-building.
8) Vital use of biostatistics is in evaluating the spread of a disease.
9) And much more……….
6
CLASSIFICATION OF DATA
Data:
A set of values recorded on one or more
observational units i.e. Object, person etc. or set
of numerical facts
Types of data:
(A) Qualitative data
(B) Quantitative data
7
Sources
of data
Records Surveys Experiments
8
Data collected on the weight of 20 individuals
in your classroom
Data Information Statistics
20 kg,
25 kg
28 kg,
30 kg,
…
etc.
5 individuals in
the 20-to-25-kg
range
Mean weight =
22.5 kg
15 individuals in
the 26-to-30-kg
range
Median weight =
28 kg
9
Qualitative Data :
Qualitative Quality.
Deals with descriptions or quality.
Data can be classified or observed
but can not measured or enumerated.
This data is also known as Attribute or
Enumeration data.
 Religion, gender, blood group, color
etc.
10
Quantitative Data
Quantative Quantity
Deals with numbers.
Data which can be measured and
expressed in numbers (fraction also
whole number).
This data also known as measurement
data.
Height, weight, Blood pressure, Hb level
etc. 11
Quantitative data Qualitative data
1. Hb level in gm % Anemic or non anemic
2. Height in cms. Tall or short
3. B.P. in mm of Hg. Hypo, normo or
hypertensive
4. I.Q. scores Idiot, genius or normal
12
MEASUREMENT AND MEASUREMENT SCALES
 Measurement: Assignment of numbers to
object/observation
 Measurement Scale: Measurements carried out
under different sets of rules results in different
categories of measurement scale.
 Scales of Measurements
Nominal scale
Ordinal scale
Interval scale
Ratio scale
13
Nominal Scales
 Nominal Names only.
 In this case data are classified into
categories that are different in character
and cannot be measured or ordered.
 Ex:-Blood group- A, B, O, AB.
Gender- Male, Female.
Religion-Hindu, Muslim, Christian.
Color-blue, black, grey, white etc.
14
Ordinal Scales
 Ordered Categories
 In this scales of measurement data is classified
according to logical order.
 Ex- Socio-economic status of family
Grades of Malnutrition
Severity of Disease as Mild, moderate,
severe
15
Interval scale
 In this scales of measurement , equal
interval are formed with equal unit in which
zero is only additional point.
 Zero is not absolute zero or lowest value
of measurement.
 In interval scale a ‘real zero’ doesn’t
exist.
 Ex-Temperature in degree celsius.
16
Ratio Scale
In this scales of measurement , equal
intervals are formed with equal unit in
which zero is lowest value of
measurement.
 Zero is real zero or absolute zero.
Ex- Length, height, weight etc.
17
STATISTICAL TERMS
Variable: A quantity, that varies within
limits.
eg. Height, wt., B.P., age, pulse rate etc.
Constant: A quantity, that does not
varies.
eg. π=22/7, e=2.718 exponential constant
Numbers are constant. 18
Variable
Discrete Continuous
(Countable) (Measurable)
no. of births,
no. of deaths,
no. of accidents etc.
height, weight,
Hb level, etc.
19
Data
Qualitative
Data
Nominal
Scale
Discrete
Data
Ordinal
Scale
Quantitative
Data
Interval
Scale
Continuous
Data
Ratio
Scale
20
Classify the following data into qualitative data ,
quantitative ,discrete, continuous data.
1. Different subject for MBBS second.
2. Height.
3. Colors of eyes.
4. Hb level.
5. Weight of student.
21
TABULATION
Methods of presentation of data
 Text
 Tabulation
 Diagrams & Graphs
Tabulation is the first step in the analysis of
data
22
FREQUENCY TABLE
 After collecting data, the first task for a researcher is
to organize and simplify the data so that it is possible
to get a general overview of the results.
 One method for simplifying and organizing data is to
construct a frequency distribution.
 Frequency distribution is a table that displays
the frequency of various outcomes in a sample.
23
FREQUENCY DISTRIBUTION TABLES
A frequency distribution table consists of at
least two columns - one listing categories on
the scale of measurement (X) and another for
frequency (f).
In the X column, values are listed from the
lowest to highest, without skipping any.
For the frequency column, tallies are
determined for each value (how often each X
value occurs in the data set). These tallies are
the frequencies for each X value.
The sum of the frequencies should equal N.
24
FREQUENCY DISTRIBUTION
Frequency distribution
Discrete frequency distribution continuous frequency distribution
To make the work easy, we use tally marks.
25
DISCRETE FREQUENCY DISTRIBUTION :-
When a frequency distribution table lists
all of the individual categories (X values-
i.e. Variables is Discrete) it is called a
Discrete frequency distribution.
26
Ex:- II MBBS students conducted family health survey(FHS)
and recorded number of children's among 40 families as below:
Prepare the frequency table for given data & draw your
conclusion from the same.
0 2 1 3 2 1 2 1
2 1 2 2 1 2 1 2
2 2 1 0 2 1 2 1
2 2 1 2 1 2 1 2
2 1 2 3 1 2 1 0
27
Soln : Let us consider the variable
X : Number of children's in family
S= Smallest value=Minimum value number of children’s =0,
L= Largest Value= Maximum value number of children’s =3,
No. of
children’s(X)
Tally Marks Frequency (f)
0 III 3
1 IIII IIII II 12
2 IIII IIII IIII IIII III 23
3 II 2
Total N= 40
28
GROUPED/CONTINUOUS FREQUENCY
DISTRIBUTION
 In a grouped table, the X column lists groups of
scores, called class intervals, rather than individual
values.
 These intervals all have the same width, usually a
simple number such as 2, 5, 10, and so on.
 Interval must same throughout the all classes.
 Groups should not be too broad or too short.
 Group should be between 5 and 15.
29
1. Range (R) – the difference between the highest score and the
lowest score.
2. Class Interval (k) – a grouping or category defined by a lower
limit and an upper limit.
3. Class Limits- Lowest value of the class interval is Lower class
limit(lcl) whereas highest value of the class interval is known
Upper class limit(ucl)
4. Class Mark (x) – is the middle value or the midpoint of a class
interval. It is obtained by getting the average of the lower class
limit and the upper class limit.
5. Class Size (i) – is the difference between the upper class limit
and the lower class limit of a class interval
6. Class Frequency – it refers to the number of observations
belonging to a class interval, or the number of items within a
category.
30
Steps in Constructing a Frequency Distribution
 Find the range R, using the formula:
R = Highest Score – Lowest Score
 Compute for the number of class intervals, n, by using the formula:
k = 1+3.3 log10n
 Compute for the class size, I, using the formula:
i = R/k
 Using the lowest score as lower limit, add (i ) to it to obtain the higher
limit of the first class interval.
 The lower limit of the second interval may be Upper class limit of
previous class.
31
Statistics Test Scores of 50 students. Construct a frequency
distribution
51 65 68 87 76
56 69 75 89 80
61 66 73 86 79
70 71 54 87 78
68 74 66 88 77
67 73 64 90 77
72 52 67 86 79
74 59 70 89 85
55 63 74 82 84
57 68 72 81 83
32
Solution:
Solution-
Let us denote X-score of statistics
1. R = Highest Score – Lowest Score
R = 90 – 51
R = 39
2. k = 8 (desired interval)
3. i = R/k
i = 39/8
i = 4.875
i = 5
33
Class
Interval Tally marks f < cf > cf
50 - 55 IIII 4 4 50
55 - 60 III 3 7 46
60 - 65 IIII 4 11 43
65 - 70 IIII IIII 10 21 39
70 - 75 IIII IIII 9 30 29
75 - 80 IIII II 7 37 20
80 - 85 IIII 5 42 13
85 - 90 IIII III 8 50 8
Total N=50
The Frequency Distribution of the Statistics Score of 50 Students
Cumulative Frequency
34
CONTINGENCY TABLE OR TWO WAY TABLE
A two-way table presents categorical data
by counting the number of observations
that fall into each group for two variables,
one divided into rows and the other
divided into columns.
35
Ex-
There are 40 students in batch D of II MBBS out
of which 25 are boys. The 18 boys and 13 girls
lives in hostel. Prepare contingency table for
gender wise current residential status for batch
D.
Ans- The variables are Sex and Residential status
Put the given values in table
Residential
Status
Sex
Hostellite
Day
Scholar
Total
Male 18 ?? =7 25
Female 13 ?? =2 ?? =15
Total ?? =31 ?? =09 N= 40
36
EXPECTED QUESTION
1) Define Biostatistics and describe use of
Biostatistics.
2) Differentiate between Qualitative and Quantitative
data.
3) Describe various source of statistical data.
37
Statistical Thinking will
one day necessary for
effective citizenship as
the ability to read and
write
- H. G. Wells
38

Classification and tabulation of data

  • 1.
    CLASSIFICATION & TABULATIONOF DATA Jagdish D. Powar Statistician cum Tutor Community Medicine SMBT, IMSRC, Nashik
  • 2.
    COMPETENCY-CM6.2 CM6.2 Describe and discussthe principles and demonstrate the methods of collection, classification, analysis, interpretation and presentation of statistical data 2
  • 3.
    LEARNING OBJECTIVES At theend of this session II PSY student should be able to do 1. Describe and define the principles and the methods of data collection. 2. Write the classification of data with reasonable accuracy into Qualitative and Quantitative types. 3. Present the data using tables. 4. Prepare 2X2 table for Qualitative Data. 3
  • 4.
    Statistics: It is thescience which deals with development and application of the most appropriate methods for the:  Collection & classification of data.  Presentation of the collected data.  Analysis and interpretation of the results.  Making decisions on the basis of such analysis. 4
  • 5.
    Statistics in variousareas a) Bio-statistics -statistical processes and methods applied to the collection, analysis, and interpretation of biological data and especially data relating to human biology, health, and medicine. b) Vital statistics - statistics relating to births, deaths, marriages, health, and disease. c) Heath Statistics d) Agricultural statistics e) Business statistics f) Pharmaceutical statistics 5
  • 6.
    APPLICATION & USESOF BIOSTATISTICS 1) To define normal and limits of normality. 2) To compare the information. (i.e. to find correlation between two or more variables) 3) To estimate action of drug. 4) In public health- in epidemiology. 5) In clinical trial. 6) Use maximum information content measurement. 7) Commonly used in large-scale efforts, such as drug testing and environmental model-building. 8) Vital use of biostatistics is in evaluating the spread of a disease. 9) And much more………. 6
  • 7.
    CLASSIFICATION OF DATA Data: Aset of values recorded on one or more observational units i.e. Object, person etc. or set of numerical facts Types of data: (A) Qualitative data (B) Quantitative data 7
  • 8.
  • 9.
    Data collected onthe weight of 20 individuals in your classroom Data Information Statistics 20 kg, 25 kg 28 kg, 30 kg, … etc. 5 individuals in the 20-to-25-kg range Mean weight = 22.5 kg 15 individuals in the 26-to-30-kg range Median weight = 28 kg 9
  • 10.
    Qualitative Data : QualitativeQuality. Deals with descriptions or quality. Data can be classified or observed but can not measured or enumerated. This data is also known as Attribute or Enumeration data.  Religion, gender, blood group, color etc. 10
  • 11.
    Quantitative Data Quantative Quantity Dealswith numbers. Data which can be measured and expressed in numbers (fraction also whole number). This data also known as measurement data. Height, weight, Blood pressure, Hb level etc. 11
  • 12.
    Quantitative data Qualitativedata 1. Hb level in gm % Anemic or non anemic 2. Height in cms. Tall or short 3. B.P. in mm of Hg. Hypo, normo or hypertensive 4. I.Q. scores Idiot, genius or normal 12
  • 13.
    MEASUREMENT AND MEASUREMENTSCALES  Measurement: Assignment of numbers to object/observation  Measurement Scale: Measurements carried out under different sets of rules results in different categories of measurement scale.  Scales of Measurements Nominal scale Ordinal scale Interval scale Ratio scale 13
  • 14.
    Nominal Scales  NominalNames only.  In this case data are classified into categories that are different in character and cannot be measured or ordered.  Ex:-Blood group- A, B, O, AB. Gender- Male, Female. Religion-Hindu, Muslim, Christian. Color-blue, black, grey, white etc. 14
  • 15.
    Ordinal Scales  OrderedCategories  In this scales of measurement data is classified according to logical order.  Ex- Socio-economic status of family Grades of Malnutrition Severity of Disease as Mild, moderate, severe 15
  • 16.
    Interval scale  Inthis scales of measurement , equal interval are formed with equal unit in which zero is only additional point.  Zero is not absolute zero or lowest value of measurement.  In interval scale a ‘real zero’ doesn’t exist.  Ex-Temperature in degree celsius. 16
  • 17.
    Ratio Scale In thisscales of measurement , equal intervals are formed with equal unit in which zero is lowest value of measurement.  Zero is real zero or absolute zero. Ex- Length, height, weight etc. 17
  • 18.
    STATISTICAL TERMS Variable: Aquantity, that varies within limits. eg. Height, wt., B.P., age, pulse rate etc. Constant: A quantity, that does not varies. eg. π=22/7, e=2.718 exponential constant Numbers are constant. 18
  • 19.
    Variable Discrete Continuous (Countable) (Measurable) no.of births, no. of deaths, no. of accidents etc. height, weight, Hb level, etc. 19
  • 20.
  • 21.
    Classify the followingdata into qualitative data , quantitative ,discrete, continuous data. 1. Different subject for MBBS second. 2. Height. 3. Colors of eyes. 4. Hb level. 5. Weight of student. 21
  • 22.
    TABULATION Methods of presentationof data  Text  Tabulation  Diagrams & Graphs Tabulation is the first step in the analysis of data 22
  • 23.
    FREQUENCY TABLE  Aftercollecting data, the first task for a researcher is to organize and simplify the data so that it is possible to get a general overview of the results.  One method for simplifying and organizing data is to construct a frequency distribution.  Frequency distribution is a table that displays the frequency of various outcomes in a sample. 23
  • 24.
    FREQUENCY DISTRIBUTION TABLES Afrequency distribution table consists of at least two columns - one listing categories on the scale of measurement (X) and another for frequency (f). In the X column, values are listed from the lowest to highest, without skipping any. For the frequency column, tallies are determined for each value (how often each X value occurs in the data set). These tallies are the frequencies for each X value. The sum of the frequencies should equal N. 24
  • 25.
    FREQUENCY DISTRIBUTION Frequency distribution Discretefrequency distribution continuous frequency distribution To make the work easy, we use tally marks. 25
  • 26.
    DISCRETE FREQUENCY DISTRIBUTION:- When a frequency distribution table lists all of the individual categories (X values- i.e. Variables is Discrete) it is called a Discrete frequency distribution. 26
  • 27.
    Ex:- II MBBSstudents conducted family health survey(FHS) and recorded number of children's among 40 families as below: Prepare the frequency table for given data & draw your conclusion from the same. 0 2 1 3 2 1 2 1 2 1 2 2 1 2 1 2 2 2 1 0 2 1 2 1 2 2 1 2 1 2 1 2 2 1 2 3 1 2 1 0 27
  • 28.
    Soln : Letus consider the variable X : Number of children's in family S= Smallest value=Minimum value number of children’s =0, L= Largest Value= Maximum value number of children’s =3, No. of children’s(X) Tally Marks Frequency (f) 0 III 3 1 IIII IIII II 12 2 IIII IIII IIII IIII III 23 3 II 2 Total N= 40 28
  • 29.
    GROUPED/CONTINUOUS FREQUENCY DISTRIBUTION  Ina grouped table, the X column lists groups of scores, called class intervals, rather than individual values.  These intervals all have the same width, usually a simple number such as 2, 5, 10, and so on.  Interval must same throughout the all classes.  Groups should not be too broad or too short.  Group should be between 5 and 15. 29
  • 30.
    1. Range (R)– the difference between the highest score and the lowest score. 2. Class Interval (k) – a grouping or category defined by a lower limit and an upper limit. 3. Class Limits- Lowest value of the class interval is Lower class limit(lcl) whereas highest value of the class interval is known Upper class limit(ucl) 4. Class Mark (x) – is the middle value or the midpoint of a class interval. It is obtained by getting the average of the lower class limit and the upper class limit. 5. Class Size (i) – is the difference between the upper class limit and the lower class limit of a class interval 6. Class Frequency – it refers to the number of observations belonging to a class interval, or the number of items within a category. 30
  • 31.
    Steps in Constructinga Frequency Distribution  Find the range R, using the formula: R = Highest Score – Lowest Score  Compute for the number of class intervals, n, by using the formula: k = 1+3.3 log10n  Compute for the class size, I, using the formula: i = R/k  Using the lowest score as lower limit, add (i ) to it to obtain the higher limit of the first class interval.  The lower limit of the second interval may be Upper class limit of previous class. 31
  • 32.
    Statistics Test Scoresof 50 students. Construct a frequency distribution 51 65 68 87 76 56 69 75 89 80 61 66 73 86 79 70 71 54 87 78 68 74 66 88 77 67 73 64 90 77 72 52 67 86 79 74 59 70 89 85 55 63 74 82 84 57 68 72 81 83 32
  • 33.
    Solution: Solution- Let us denoteX-score of statistics 1. R = Highest Score – Lowest Score R = 90 – 51 R = 39 2. k = 8 (desired interval) 3. i = R/k i = 39/8 i = 4.875 i = 5 33
  • 34.
    Class Interval Tally marksf < cf > cf 50 - 55 IIII 4 4 50 55 - 60 III 3 7 46 60 - 65 IIII 4 11 43 65 - 70 IIII IIII 10 21 39 70 - 75 IIII IIII 9 30 29 75 - 80 IIII II 7 37 20 80 - 85 IIII 5 42 13 85 - 90 IIII III 8 50 8 Total N=50 The Frequency Distribution of the Statistics Score of 50 Students Cumulative Frequency 34
  • 35.
    CONTINGENCY TABLE ORTWO WAY TABLE A two-way table presents categorical data by counting the number of observations that fall into each group for two variables, one divided into rows and the other divided into columns. 35
  • 36.
    Ex- There are 40students in batch D of II MBBS out of which 25 are boys. The 18 boys and 13 girls lives in hostel. Prepare contingency table for gender wise current residential status for batch D. Ans- The variables are Sex and Residential status Put the given values in table Residential Status Sex Hostellite Day Scholar Total Male 18 ?? =7 25 Female 13 ?? =2 ?? =15 Total ?? =31 ?? =09 N= 40 36
  • 37.
    EXPECTED QUESTION 1) DefineBiostatistics and describe use of Biostatistics. 2) Differentiate between Qualitative and Quantitative data. 3) Describe various source of statistical data. 37
  • 38.
    Statistical Thinking will oneday necessary for effective citizenship as the ability to read and write - H. G. Wells 38