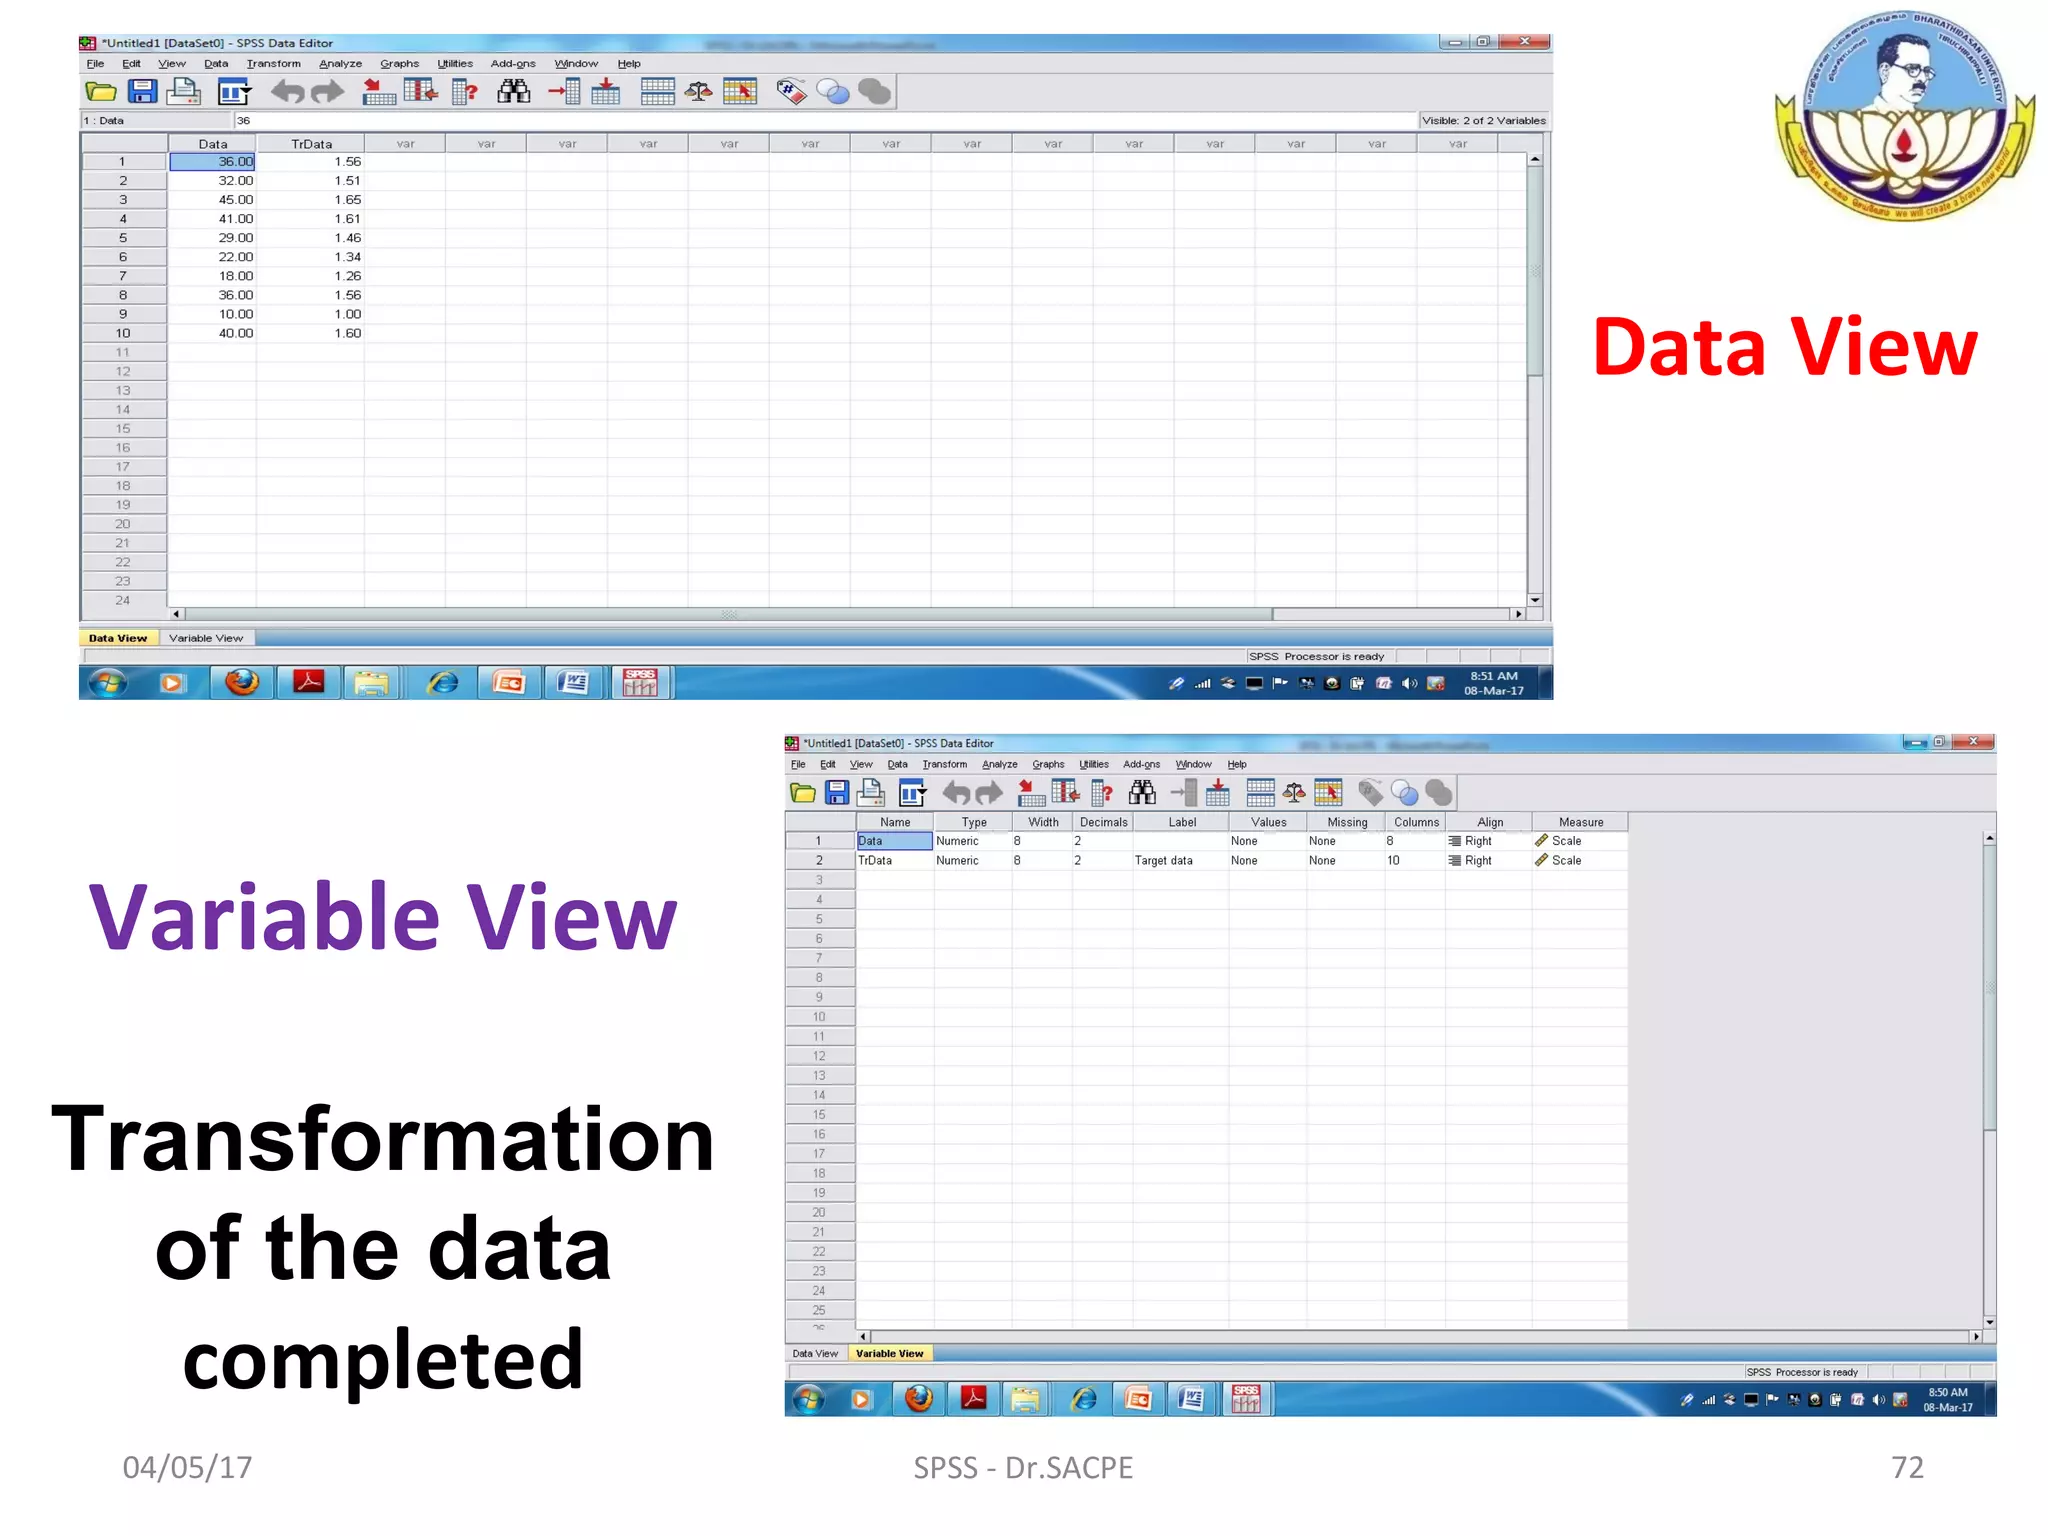
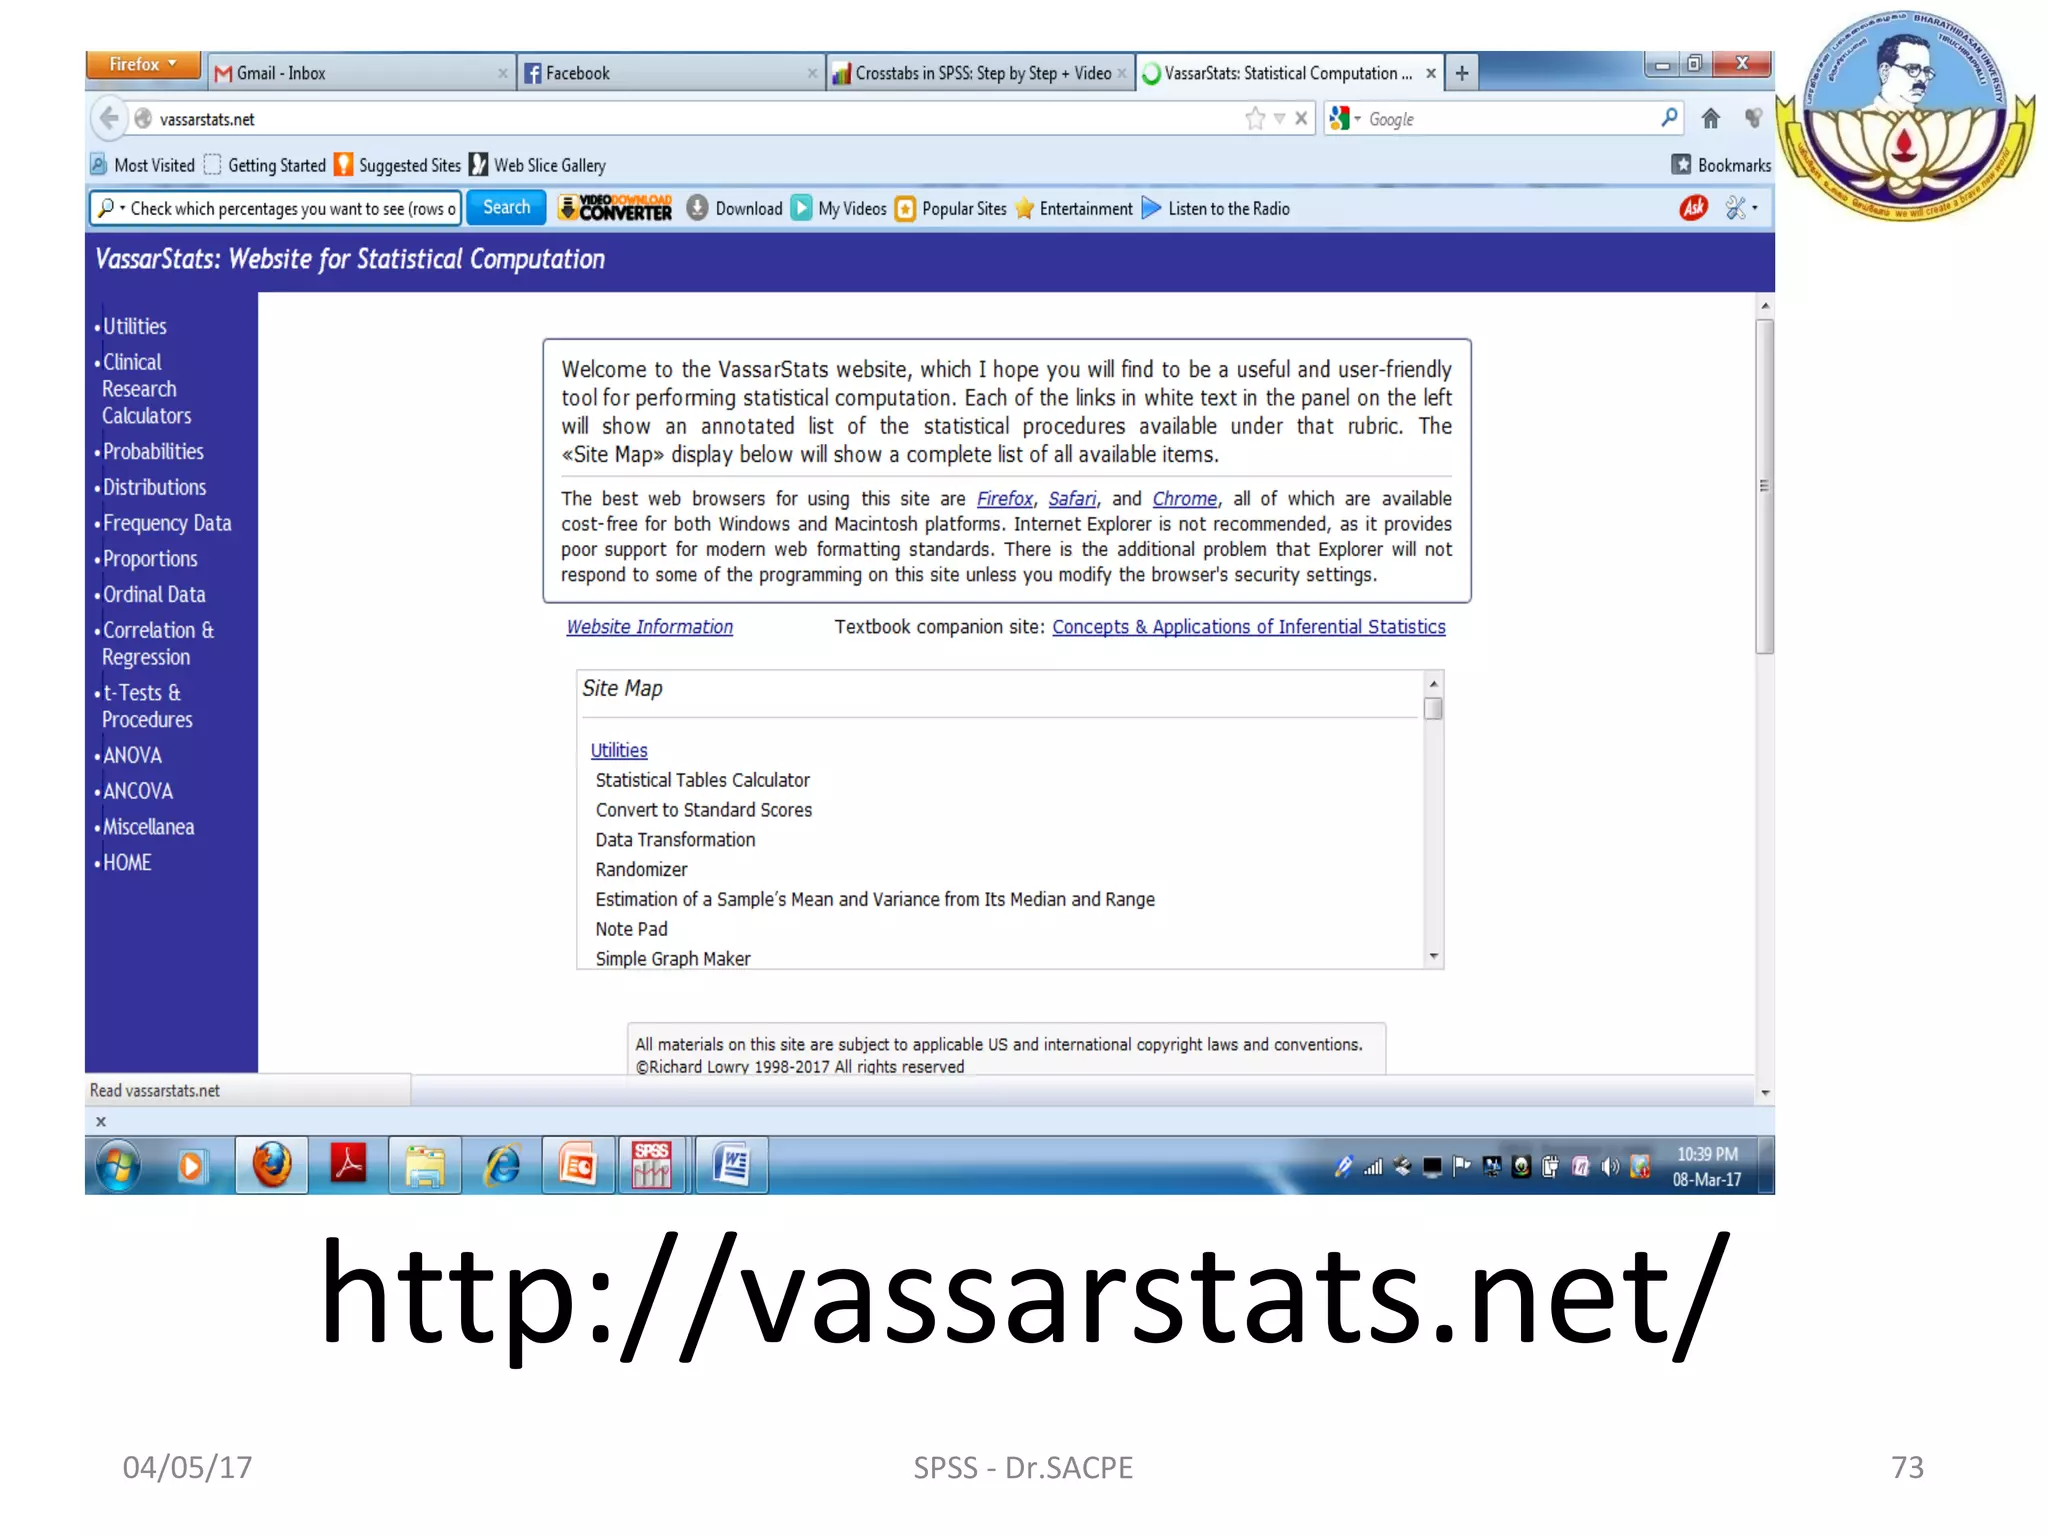
Dr.R.Kalidasan
Assistant Professor (SG)
Department of Physical Education
Bharathidasan University
Tiruchirappalli-620 024
INTRODUCTION TO SPSS
04/05/17 1SPSS - Dr.SACPE
04/05/17 SPSS - Dr.SACPE 2
Two Days Workshop on Data Analysis Using Statistical Tool (SPSS)
organised by
Dr. Sivanthi Aditanar College of Physical Education
Tiruchendur – 628 215
on
10th
& 11th
March 2017
Introduction to SPSS
•Variable View / Data View
•Scale / Ordinal / Nominal
•Export to Database Wizard
•Transform Data
•Descriptive Statistics : Frequency Distribution and Cross tabs
Research is critical for human progress
and as long as there is research, there will
be the need to analyze data.
Data analysis is the language of research.
Data analysis using statistical tool.
Research and Data analysis
04/05/17 3SPSS - Dr.SACPE
Statistical analysis
90% of all statistical analysis is performed by
computers
Computer
Easily
Quickly
More accurate than other device
Data & results can be saved
Statistical analysis Software
Open source (FREE) & Commercial (Pay)
04/05/17 4SPSS - Dr.SACPE
Free Statistical Software
 SAS University
Edition
 GNU Octave
 ADaMSoft
 BV4.1
 PSPP
 R
 PbdR
 Shogun
 CSPRo
 CumFreq
Gretl.
GDL
Open Mx
OpenStat
MaxStat Lite
Version
Sage
DAP
EPiInfo
Develve
Dashboard of
sustainability
04/05/17 5SPSS - Dr.SACPE
Sl.No. Name of the software Owned by
1. SPSS IBM
2. QlikSense Qlik
3. MATLAB The Mathworks
4. Alteryx Designer Alteryx
5. Minitab17 Minitab
6. MatStat MaxStat software
7. Stata State Corp
8. SAS Business Intelligence SAS Institute
9. Plug & Score Modeler Plug & Score
10. TIBCO Enterprise Runtime for R TIBCO Software
11. Analyse-it Analyse-it Software
12. Analytica Lumina Decision Systems
13. Statwing Statwing
14. JMP Statistical Software JMP Statistical Software
15. Online Stock wise Predictor Altredo Finance Analysis and Software
TOP STATISTICAL ANALYSIS SOFTWARE PRODUCTS
04/05/17 6SPSS - Dr.SACPE
SPSS
Most popular / preferred statistical analysis
User Friendly – analysis with simple instructions
Largely used in Social sciences, Health sciences and Marketing
Capable of handling large amount of data
Can perform highly complex data manipulation
To create tables and graphs
04/05/17 7SPSS - Dr.SACPE
SPSS Usage
Market researchers
Health researchers
Educational researchers
Survey companies
Government agencies
Marketing agencies
Data miners and so on
04/05/17 8SPSS - Dr.SACPE
04/05/17 9SPSS - Dr.SACPE
SPSS Product Editions
SPSS Advanced Statistics
SPSS Amos
SPSS Bootstrapping
SPSS Categories
SPSS Complex Samples
SPSS Conjoint
SPSS Custom Tables
SPSS Data Preparation
SPSS Decision Trees
SPSS Direct Marketing
SPSS Exact tests
SPSS Forecasting
SPSS Missing Values
SPSS Neural Networks
SPSS Regression
SPSS Statistics Base
SPSS Statistics Campus
SPSS Statistics Faculty Pack
SPSS Statistics Grad Pack
SPSS Statistics Premium
SPSS Statistics Professional
SPSS Statistics Programmability Extension
SPSS Statistics Standard
SPSS for Linux on System Z
SPSS Text analytics for surveys
Software was originally created
by three Stanford graduate
students in the late 1960’s.
Norman H. Nie
American
Dale H. Bent
Canadian
C. Hadlai Hull
American
The software was released in its first version in 1968.
04/05/17 10SPSS - Dr.SACPE
SPSS-1 1968
1975
SPSS-2 1983
SPSS-5 1993
SPSS-16 2008
SPSS Statistics 17.0.1 2008
PASW Statisticis 17.0.3 2009
IBM SPSS Statistics 19.0 2010
IBM SPSS Statistics 20.0 2011
IBM SPSS Statistics 23.0 2015
VERSIONS OF SPSS
04/05/17 11SPSS - Dr.SACPE
Latest Version - 24.0 / March 15, 2016
Operating Systems: Windows, Linux on z systems, Linux, UNIX, MacOS
Platform :Java
Size:~900 MB
License: Trailware
Website:
ibm.com/marketplace/cloud/statistical-analysis-and-reporting/
04/05/17 12SPSS - Dr.SACPE
OFFICIAL NAME & LOGO
Earlier names
Statistical Package for the Social Sciences (SPSS)
Statistical Product and Service Solution (SPSS)
Present name
IBM SPSS Statistics
04/05/17 13SPSS - Dr.SACPE
SPSS – earlier was just an academic exercise
and now to serious business.
Commercial software.
Cost range from Rs.3 lakhs and go up to Rs.17 lakhs
(approx.)
Trail version (30 days)
Now days special concession are given to
student and faculty - 12 months tariff
(ranging from Rs.85,700/- to Rs.5,70,000/-)
04/05/17 14SPSS - Dr.SACPE
•Factor analysis
•Cluster analysis (two-step,
K-means hierarchical)
•Discriminant
Linear regression
•t-test
•ANOVA
•Correlation (bivariate,
partial, distances)
•Means
•Non parametric tests
Descriptive
Statistics
Bivariate
Statistics
Prediction for
numerical out comes
Prediction for
identifying groups
•Cross tabulation
•Frequencies
•Descriptives
•Explore
•Descriptive
Ratio Statistics
Statistics included in the base software
04/05/17 15SPSS - Dr.SACPE
04/05/17 16SPSS - Dr.SACPE
SPSS Software installation
Purchase Software (or) Trail / demo version
Downloading and Save it on the desk/Laptop
04/05/17 17SPSS - Dr.SACPE
How to open SPSS
Go to
04/05/17 18SPSS - Dr.SACPE
Click on All Programs
Click on SPSS Inc
Click on SPSS 16.0
04/05/17 19SPSS - Dr.SACPE
Click on SPSS 16.0
04/05/17 20SPSS - Dr.SACPE
Spread sheet
Dialog box
SPSS Data Editor
04/05/17 21SPSS - Dr.SACPE
oRun the tutorial
oType in data
oRun an existing query
oCreate new query using Data wizard
oOpen an existing data source
oOpen another type of file
SPSS 16.0
Dialog box
What would you like to do?
04/05/17 22SPSS - Dr.SACPE
Run the tutorial
Select Run the tutorial Click OK then it will go next page
04/05/17 23SPSS - Dr.SACPE
Tutorial – Table of Contents
To read the tutorials click the relevant content
04/05/17 24SPSS - Dr.SACPE
Type in data
Select Type in Data Click OK then it will go next Page
04/05/17 25SPSS - Dr.SACPE
Data View
Data View Rows are cases (participants in the study)
Columns are variables
Drop down menus
Action buttons
Cel
l
data view “window”
Scroll bars
Tool bar
04/05/17 26SPSS - Dr.SACPE
Variable View
Variable View
Name Type Width Decimals Label Values Missing Columns Align
Measure
Rows define the variable characteristics
VariableName64
Default decimal 2. If reqd. changes can be done
Default width 8.
It can be edited
Right, Left
or Centre
WidthMissing
value
04/05/17 27SPSS - Dr.SACPE
File - Standard options for opening, saving, printing and exiting
Edit - Standard commands to undo, redo, cut, copy and paste
View - Options for showing/hiding toolbars, displaying values or their labels in Data Editor
Data – Used to manipulate the data; sort, merge & so on
Transform - Creation of new variables
Analyze - Heart of SPSS. This menu provides access to the statistical procedures for
analysing your data set. All the items on the analyze menu have sub menus.
Drop down menus
04/05/17 28SPSS - Dr.SACPE
Graphs - Provide options to create high quality plots and charts.
Utilities - Used to display information on individual variables.
Window - Provides option for switching between different SPSS windows
Help – Contains SPSS help system
Drop down menus Cont.
04/05/17 29SPSS - Dr.SACPE
Open files
Save data
Print file
Find data
Undo last operation
Redo last operation
Insert case
Insert variable
Tool bar
04/05/17 30SPSS - Dr.SACPE
Types of Scales
Nominal- objects or people are categorized according to some
criterion (gender, job category)
Ordinal- Categories which are ranked according to characteristics
(income- low, moderate, high)
Interval- contain equal distance between units of measure- but no
zero (calendar years, temperature)
Ratio- has an absolute zero and consistent intervals
(distance, weight)
04/05/17 31SPSS - Dr.SACPE
Variable View with a data set already loaded in SPSS
04/05/17 SPSS - Dr.SACPE 32
Data entry in SPSS
Runs scored by Indian Batsman in the
recently concluded 2nd
Test Match
between India and Australia
(India scored 189 in the first innings –
including 16 Extras)
90, 0, 17, 12, 17, 26, 7, 1, 3, 0, 0, 16
04/05/17 33SPSS - Dr.SACPE
How to Enter data in SPSS
Go to
04/05/17 34SPSS - Dr.SACPE
Click on All Programs
Click on SPSS Inc
Click on SPSS 16.0
04/05/17 35SPSS - Dr.SACPE
Click on SPSS 16.0
04/05/17 36SPSS - Dr.SACPE
Type in data
Select Type in Data Click OK then it will go next Page
04/05/17 37SPSS - Dr.SACPE
In the data view page simple entry the
data in each cell one after another.
04/05/17 SPSS - Dr.SACPE 38
Go to Variable view page, we can
see by default the variables
characteristics will appear.
04/05/17 SPSS - Dr.SACPE 39
Enter the VAR00001 Name as Runs
In Label type India’s 1st
innings runs
04/05/17 SPSS - Dr.SACPE 40
Saving the data
with specific
file name
04/05/17 SPSS - Dr.SACPE 41
Descriptive statistics
Descriptive statistics are numbers that are used to
summarize and describe data.
The word "data" refers to the information that has
been collected from an experiment, a survey, a
historical record, and so on.
Measures of Central tendency – Mean, Median & Mode
Measures of Dispersion – Standard deviation, Minimum,
Maximum, Variance, Range, S.E.mean
Distribution – Skewness, Kurtosis
Percentiles – Quartiles, Percentile
04/05/17 SPSS - Dr.SACPE 42
Go to Descriptive statistics then go to Frequencies & Click
04/05/17 SPSS - Dr.SACPE 43
Frequencies tool bar will appear
04/05/17 SPSS - Dr.SACPE 44
By using arrow key India’s 1st
innings
runs is moved to Variable(s) side
04/05/17 SPSS - Dr.SACPE 45
If Statistics option is clicked Frequencies:
Statistics tool bar will appear
04/05/17 SPSS - Dr.SACPE 46
Select all measure
of Central tendency
and give Continue
04/05/17 SPSS - Dr.SACPE 47
By clicking Charts
option a tool bar will
appear, one has to
select appropriate
chart in this case Bar
Chart was selected
04/05/17 SPSS - Dr.SACPE 48
Click OK
for getting
output
results
04/05/17 SPSS - Dr.SACPE 49
Output results
04/05/17 SPSS - Dr.SACPE 50
Saving the
output results
with specific
file name
04/05/17 SPSS - Dr.SACPE 51
Descriptive Statistics
Exercise-I
Runs scored by Australian Batsman in the recently concluded 2nd
Test
Match between India and Australia
(Australia scored 276 in the First innings)
33, 60, 8, 66, 16, 0, 40, 26, 4, 0, 1, 22
Exercise-II
Runs scored by Indian Batsman in the recently concluded 2nd
Test Match
between India and Australia
(India scored 274 in the Second innings)
51, 16, 92, 15, 2, 52, 0, 20, 4, 1, 6, 15
Exercise-III
Runs scored by Australian Batsman in the recently concluded 2nd
Test
Match between India and Australia
(Australia scored 112 in the Second innings)
17, 5, 28, 9, 24, 13, 0, 1, 2, 2, 0, 11
04/05/17 SPSS - Dr.SACPE 52
Exercise-IV
Weight of babies (Kg) below 6 months taken
from a hospital record is given below. Calculate
mean, median, mode, standard deviation and
coefficient of skewness and kurtosis.
3.0 4.5 4.3 2.5 3.5 2.5 4.0 4.5 6.5 5.0
4.0 5.0 4.1 4.2 4.3 4.5 3.3 3.5 3.6 5.3
5.4 5.5 5.5 5.7 5.8 5.6 5.8 5.9 6.0 3.4
6.1 6.2 6.3 5.5 6.3 6.3 7.0 4.0 3.4 5.0
04/05/17 SPSS - Dr.SACPE 53
Export to Database Wizard
(Importing Data into SPSS)
Data stored in types of files, such as
an Excel files or text file
How to save in SPSS file format
04/05/17 SPSS - Dr.SACPE 54
Go to Start
Click on All Programs
Click on SPSS Inc
Click on SPSS 16.0
Select Create new
query using Database
Wizard in the dialog
box and Click OK
04/05/17 SPSS - Dr.SACPE 55
Data base Wizard
box will appear
Select ODBC
Data Sources
– in this case
Excel Files
and go to
Next
04/05/17 SPSS - Dr.SACPE 56
ODBC Driver Login
box will appear
Open Data
box will
appear
04/05/17 SPSS - Dr.SACPE 57
Click OK
Select Data
will appear
04/05/17 SPSS - Dr.SACPE 58
Select the Sheet1$ and more to other side using
arrow button
04/05/17 SPSS - Dr.SACPE 59
Limit Retrieved cases
box will appear
click Finish
Data were
imported to
SPSS
04/05/17 SPSS - Dr.SACPE 60
Crosstab or Cross Tabulation
It is a process or function that combines
and/or summarizes data from one or more
sources into a concise format for analysis or
reporting.
Crosstabs display the joint distribution of two
or more variables and they are usually
represented in the form of a contingency table
in a matrix.
04/05/17 SPSS - Dr.SACPE 61
Cross tabs
Data View
Variable View
04/05/17 SPSS - Dr.SACPE 62
Click “Analyze,” then hover over
“Descriptive Statistics” and then click
“Crosstabs.”
04/05/17 SPSS - Dr.SACPE 63
Crosstabs
box will
appear
Select Age and move
to Row(s) using
arrow key
Select Health care and move
to Column (s) using arrow
key
04/05/17 SPSS - Dr.SACPE 64
Click “Continue” and then click “OK” to get output results
In Crosstabs: Cell Display box
select percentage total
04/05/17 SPSS - Dr.SACPE 65
Transform Data
In the data view page simple entry the data in
each cell one after another.
Then perform a transformation of the data.
Transforming data is performed for a whole host of
different reasons
Not normally distributed to the new,
transformed data is normally distributed
04/05/17 SPSS - Dr.SACPE 66
Type the data in the Data View
04/05/17 SPSS - Dr.SACPE 67
Go to Variable View
Rename the variable,
"Data", instead of the
default, "VAR00001".
04/05/17 SPSS - Dr.SACPE 68
Using drop down
menu click Transform
and select Compute
Variable
04/05/17 SPSS - Dr.SACPE 69
Click "All" in the Function group: box, then scroll down in the
Functions and Special Variables: box and click "Lg10" to
select it.
04/05/17 SPSS - Dr.SACPE 70
Transfer the Lg10 function
into the Numeric Expression:
box by pressing the
button
Click the Data variable in the left-
hand box and then click the
button, which will result in the
expression you see in the
Numeric Expression: box below.
04/05/17 SPSS - Dr.SACPE 71
New variable a name
TrData
Type this name into the
Target Variable
Click Continue
04/05/17 SPSS - Dr.SACPE 72
Variable View
Transformation
of the data
completed
Data View
04/05/17 SPSS - Dr.SACPE 73
http://vassarstats.net/
04/05/17 SPSS - Dr.SACPE 74

Introduction to spss

  • 1.
    Dr.R.Kalidasan Assistant Professor (SG) Departmentof Physical Education Bharathidasan University Tiruchirappalli-620 024 INTRODUCTION TO SPSS 04/05/17 1SPSS - Dr.SACPE
  • 2.
    04/05/17 SPSS -Dr.SACPE 2 Two Days Workshop on Data Analysis Using Statistical Tool (SPSS) organised by Dr. Sivanthi Aditanar College of Physical Education Tiruchendur – 628 215 on 10th & 11th March 2017 Introduction to SPSS •Variable View / Data View •Scale / Ordinal / Nominal •Export to Database Wizard •Transform Data •Descriptive Statistics : Frequency Distribution and Cross tabs
  • 3.
    Research is criticalfor human progress and as long as there is research, there will be the need to analyze data. Data analysis is the language of research. Data analysis using statistical tool. Research and Data analysis 04/05/17 3SPSS - Dr.SACPE
  • 4.
    Statistical analysis 90% ofall statistical analysis is performed by computers Computer Easily Quickly More accurate than other device Data & results can be saved Statistical analysis Software Open source (FREE) & Commercial (Pay) 04/05/17 4SPSS - Dr.SACPE
  • 5.
    Free Statistical Software SAS University Edition  GNU Octave  ADaMSoft  BV4.1  PSPP  R  PbdR  Shogun  CSPRo  CumFreq Gretl. GDL Open Mx OpenStat MaxStat Lite Version Sage DAP EPiInfo Develve Dashboard of sustainability 04/05/17 5SPSS - Dr.SACPE
  • 6.
    Sl.No. Name ofthe software Owned by 1. SPSS IBM 2. QlikSense Qlik 3. MATLAB The Mathworks 4. Alteryx Designer Alteryx 5. Minitab17 Minitab 6. MatStat MaxStat software 7. Stata State Corp 8. SAS Business Intelligence SAS Institute 9. Plug & Score Modeler Plug & Score 10. TIBCO Enterprise Runtime for R TIBCO Software 11. Analyse-it Analyse-it Software 12. Analytica Lumina Decision Systems 13. Statwing Statwing 14. JMP Statistical Software JMP Statistical Software 15. Online Stock wise Predictor Altredo Finance Analysis and Software TOP STATISTICAL ANALYSIS SOFTWARE PRODUCTS 04/05/17 6SPSS - Dr.SACPE
  • 7.
    SPSS Most popular /preferred statistical analysis User Friendly – analysis with simple instructions Largely used in Social sciences, Health sciences and Marketing Capable of handling large amount of data Can perform highly complex data manipulation To create tables and graphs 04/05/17 7SPSS - Dr.SACPE
  • 8.
    SPSS Usage Market researchers Healthresearchers Educational researchers Survey companies Government agencies Marketing agencies Data miners and so on 04/05/17 8SPSS - Dr.SACPE
  • 9.
    04/05/17 9SPSS -Dr.SACPE SPSS Product Editions SPSS Advanced Statistics SPSS Amos SPSS Bootstrapping SPSS Categories SPSS Complex Samples SPSS Conjoint SPSS Custom Tables SPSS Data Preparation SPSS Decision Trees SPSS Direct Marketing SPSS Exact tests SPSS Forecasting SPSS Missing Values SPSS Neural Networks SPSS Regression SPSS Statistics Base SPSS Statistics Campus SPSS Statistics Faculty Pack SPSS Statistics Grad Pack SPSS Statistics Premium SPSS Statistics Professional SPSS Statistics Programmability Extension SPSS Statistics Standard SPSS for Linux on System Z SPSS Text analytics for surveys
  • 10.
    Software was originallycreated by three Stanford graduate students in the late 1960’s. Norman H. Nie American Dale H. Bent Canadian C. Hadlai Hull American The software was released in its first version in 1968. 04/05/17 10SPSS - Dr.SACPE
  • 11.
    SPSS-1 1968 1975 SPSS-2 1983 SPSS-51993 SPSS-16 2008 SPSS Statistics 17.0.1 2008 PASW Statisticis 17.0.3 2009 IBM SPSS Statistics 19.0 2010 IBM SPSS Statistics 20.0 2011 IBM SPSS Statistics 23.0 2015 VERSIONS OF SPSS 04/05/17 11SPSS - Dr.SACPE
  • 12.
    Latest Version -24.0 / March 15, 2016 Operating Systems: Windows, Linux on z systems, Linux, UNIX, MacOS Platform :Java Size:~900 MB License: Trailware Website: ibm.com/marketplace/cloud/statistical-analysis-and-reporting/ 04/05/17 12SPSS - Dr.SACPE
  • 13.
    OFFICIAL NAME &LOGO Earlier names Statistical Package for the Social Sciences (SPSS) Statistical Product and Service Solution (SPSS) Present name IBM SPSS Statistics 04/05/17 13SPSS - Dr.SACPE
  • 14.
    SPSS – earlierwas just an academic exercise and now to serious business. Commercial software. Cost range from Rs.3 lakhs and go up to Rs.17 lakhs (approx.) Trail version (30 days) Now days special concession are given to student and faculty - 12 months tariff (ranging from Rs.85,700/- to Rs.5,70,000/-) 04/05/17 14SPSS - Dr.SACPE
  • 15.
    •Factor analysis •Cluster analysis(two-step, K-means hierarchical) •Discriminant Linear regression •t-test •ANOVA •Correlation (bivariate, partial, distances) •Means •Non parametric tests Descriptive Statistics Bivariate Statistics Prediction for numerical out comes Prediction for identifying groups •Cross tabulation •Frequencies •Descriptives •Explore •Descriptive Ratio Statistics Statistics included in the base software 04/05/17 15SPSS - Dr.SACPE
  • 16.
    04/05/17 16SPSS -Dr.SACPE SPSS Software installation Purchase Software (or) Trail / demo version Downloading and Save it on the desk/Laptop
  • 17.
    04/05/17 17SPSS -Dr.SACPE How to open SPSS Go to
  • 18.
    04/05/17 18SPSS -Dr.SACPE Click on All Programs Click on SPSS Inc Click on SPSS 16.0
  • 19.
    04/05/17 19SPSS -Dr.SACPE Click on SPSS 16.0
  • 20.
    04/05/17 20SPSS -Dr.SACPE Spread sheet Dialog box SPSS Data Editor
  • 21.
    04/05/17 21SPSS -Dr.SACPE oRun the tutorial oType in data oRun an existing query oCreate new query using Data wizard oOpen an existing data source oOpen another type of file SPSS 16.0 Dialog box What would you like to do?
  • 22.
    04/05/17 22SPSS -Dr.SACPE Run the tutorial Select Run the tutorial Click OK then it will go next page
  • 23.
    04/05/17 23SPSS -Dr.SACPE Tutorial – Table of Contents To read the tutorials click the relevant content
  • 24.
    04/05/17 24SPSS -Dr.SACPE Type in data Select Type in Data Click OK then it will go next Page
  • 25.
    04/05/17 25SPSS -Dr.SACPE Data View Data View Rows are cases (participants in the study) Columns are variables Drop down menus Action buttons Cel l data view “window” Scroll bars Tool bar
  • 26.
    04/05/17 26SPSS -Dr.SACPE Variable View Variable View Name Type Width Decimals Label Values Missing Columns Align Measure Rows define the variable characteristics VariableName64 Default decimal 2. If reqd. changes can be done Default width 8. It can be edited Right, Left or Centre WidthMissing value
  • 27.
    04/05/17 27SPSS -Dr.SACPE File - Standard options for opening, saving, printing and exiting Edit - Standard commands to undo, redo, cut, copy and paste View - Options for showing/hiding toolbars, displaying values or their labels in Data Editor Data – Used to manipulate the data; sort, merge & so on Transform - Creation of new variables Analyze - Heart of SPSS. This menu provides access to the statistical procedures for analysing your data set. All the items on the analyze menu have sub menus. Drop down menus
  • 28.
    04/05/17 28SPSS -Dr.SACPE Graphs - Provide options to create high quality plots and charts. Utilities - Used to display information on individual variables. Window - Provides option for switching between different SPSS windows Help – Contains SPSS help system Drop down menus Cont.
  • 29.
    04/05/17 29SPSS -Dr.SACPE Open files Save data Print file Find data Undo last operation Redo last operation Insert case Insert variable Tool bar
  • 30.
    04/05/17 30SPSS -Dr.SACPE Types of Scales Nominal- objects or people are categorized according to some criterion (gender, job category) Ordinal- Categories which are ranked according to characteristics (income- low, moderate, high) Interval- contain equal distance between units of measure- but no zero (calendar years, temperature) Ratio- has an absolute zero and consistent intervals (distance, weight)
  • 31.
    04/05/17 31SPSS -Dr.SACPE Variable View with a data set already loaded in SPSS
  • 32.
    04/05/17 SPSS -Dr.SACPE 32 Data entry in SPSS Runs scored by Indian Batsman in the recently concluded 2nd Test Match between India and Australia (India scored 189 in the first innings – including 16 Extras) 90, 0, 17, 12, 17, 26, 7, 1, 3, 0, 0, 16
  • 33.
    04/05/17 33SPSS -Dr.SACPE How to Enter data in SPSS Go to
  • 34.
    04/05/17 34SPSS -Dr.SACPE Click on All Programs Click on SPSS Inc Click on SPSS 16.0
  • 35.
    04/05/17 35SPSS -Dr.SACPE Click on SPSS 16.0
  • 36.
    04/05/17 36SPSS -Dr.SACPE Type in data Select Type in Data Click OK then it will go next Page
  • 37.
    04/05/17 37SPSS -Dr.SACPE In the data view page simple entry the data in each cell one after another.
  • 38.
    04/05/17 SPSS -Dr.SACPE 38 Go to Variable view page, we can see by default the variables characteristics will appear.
  • 39.
    04/05/17 SPSS -Dr.SACPE 39 Enter the VAR00001 Name as Runs In Label type India’s 1st innings runs
  • 40.
    04/05/17 SPSS -Dr.SACPE 40 Saving the data with specific file name
  • 41.
    04/05/17 SPSS -Dr.SACPE 41 Descriptive statistics Descriptive statistics are numbers that are used to summarize and describe data. The word "data" refers to the information that has been collected from an experiment, a survey, a historical record, and so on. Measures of Central tendency – Mean, Median & Mode Measures of Dispersion – Standard deviation, Minimum, Maximum, Variance, Range, S.E.mean Distribution – Skewness, Kurtosis Percentiles – Quartiles, Percentile
  • 42.
    04/05/17 SPSS -Dr.SACPE 42 Go to Descriptive statistics then go to Frequencies & Click
  • 43.
    04/05/17 SPSS -Dr.SACPE 43 Frequencies tool bar will appear
  • 44.
    04/05/17 SPSS -Dr.SACPE 44 By using arrow key India’s 1st innings runs is moved to Variable(s) side
  • 45.
    04/05/17 SPSS -Dr.SACPE 45 If Statistics option is clicked Frequencies: Statistics tool bar will appear
  • 46.
    04/05/17 SPSS -Dr.SACPE 46 Select all measure of Central tendency and give Continue
  • 47.
    04/05/17 SPSS -Dr.SACPE 47 By clicking Charts option a tool bar will appear, one has to select appropriate chart in this case Bar Chart was selected
  • 48.
    04/05/17 SPSS -Dr.SACPE 48 Click OK for getting output results
  • 49.
    04/05/17 SPSS -Dr.SACPE 49 Output results
  • 50.
    04/05/17 SPSS -Dr.SACPE 50 Saving the output results with specific file name
  • 51.
    04/05/17 SPSS -Dr.SACPE 51 Descriptive Statistics Exercise-I Runs scored by Australian Batsman in the recently concluded 2nd Test Match between India and Australia (Australia scored 276 in the First innings) 33, 60, 8, 66, 16, 0, 40, 26, 4, 0, 1, 22 Exercise-II Runs scored by Indian Batsman in the recently concluded 2nd Test Match between India and Australia (India scored 274 in the Second innings) 51, 16, 92, 15, 2, 52, 0, 20, 4, 1, 6, 15 Exercise-III Runs scored by Australian Batsman in the recently concluded 2nd Test Match between India and Australia (Australia scored 112 in the Second innings) 17, 5, 28, 9, 24, 13, 0, 1, 2, 2, 0, 11
  • 52.
    04/05/17 SPSS -Dr.SACPE 52 Exercise-IV Weight of babies (Kg) below 6 months taken from a hospital record is given below. Calculate mean, median, mode, standard deviation and coefficient of skewness and kurtosis. 3.0 4.5 4.3 2.5 3.5 2.5 4.0 4.5 6.5 5.0 4.0 5.0 4.1 4.2 4.3 4.5 3.3 3.5 3.6 5.3 5.4 5.5 5.5 5.7 5.8 5.6 5.8 5.9 6.0 3.4 6.1 6.2 6.3 5.5 6.3 6.3 7.0 4.0 3.4 5.0
  • 53.
    04/05/17 SPSS -Dr.SACPE 53 Export to Database Wizard (Importing Data into SPSS) Data stored in types of files, such as an Excel files or text file How to save in SPSS file format
  • 54.
    04/05/17 SPSS -Dr.SACPE 54 Go to Start Click on All Programs Click on SPSS Inc Click on SPSS 16.0 Select Create new query using Database Wizard in the dialog box and Click OK
  • 55.
    04/05/17 SPSS -Dr.SACPE 55 Data base Wizard box will appear Select ODBC Data Sources – in this case Excel Files and go to Next
  • 56.
    04/05/17 SPSS -Dr.SACPE 56 ODBC Driver Login box will appear Open Data box will appear
  • 57.
    04/05/17 SPSS -Dr.SACPE 57 Click OK Select Data will appear
  • 58.
    04/05/17 SPSS -Dr.SACPE 58 Select the Sheet1$ and more to other side using arrow button
  • 59.
    04/05/17 SPSS -Dr.SACPE 59 Limit Retrieved cases box will appear click Finish Data were imported to SPSS
  • 60.
    04/05/17 SPSS -Dr.SACPE 60 Crosstab or Cross Tabulation It is a process or function that combines and/or summarizes data from one or more sources into a concise format for analysis or reporting. Crosstabs display the joint distribution of two or more variables and they are usually represented in the form of a contingency table in a matrix.
  • 61.
    04/05/17 SPSS -Dr.SACPE 61 Cross tabs Data View Variable View
  • 62.
    04/05/17 SPSS -Dr.SACPE 62 Click “Analyze,” then hover over “Descriptive Statistics” and then click “Crosstabs.”
  • 63.
    04/05/17 SPSS -Dr.SACPE 63 Crosstabs box will appear Select Age and move to Row(s) using arrow key Select Health care and move to Column (s) using arrow key
  • 64.
    04/05/17 SPSS -Dr.SACPE 64 Click “Continue” and then click “OK” to get output results In Crosstabs: Cell Display box select percentage total
  • 65.
    04/05/17 SPSS -Dr.SACPE 65 Transform Data In the data view page simple entry the data in each cell one after another. Then perform a transformation of the data. Transforming data is performed for a whole host of different reasons Not normally distributed to the new, transformed data is normally distributed
  • 66.
    04/05/17 SPSS -Dr.SACPE 66 Type the data in the Data View
  • 67.
    04/05/17 SPSS -Dr.SACPE 67 Go to Variable View Rename the variable, "Data", instead of the default, "VAR00001".
  • 68.
    04/05/17 SPSS -Dr.SACPE 68 Using drop down menu click Transform and select Compute Variable
  • 69.
    04/05/17 SPSS -Dr.SACPE 69 Click "All" in the Function group: box, then scroll down in the Functions and Special Variables: box and click "Lg10" to select it.
  • 70.
    04/05/17 SPSS -Dr.SACPE 70 Transfer the Lg10 function into the Numeric Expression: box by pressing the button Click the Data variable in the left- hand box and then click the button, which will result in the expression you see in the Numeric Expression: box below.
  • 71.
    04/05/17 SPSS -Dr.SACPE 71 New variable a name TrData Type this name into the Target Variable Click Continue
  • 72.
    04/05/17 SPSS -Dr.SACPE 72 Variable View Transformation of the data completed Data View
  • 73.
    04/05/17 SPSS -Dr.SACPE 73 http://vassarstats.net/
  • 74.
    04/05/17 SPSS -Dr.SACPE 74