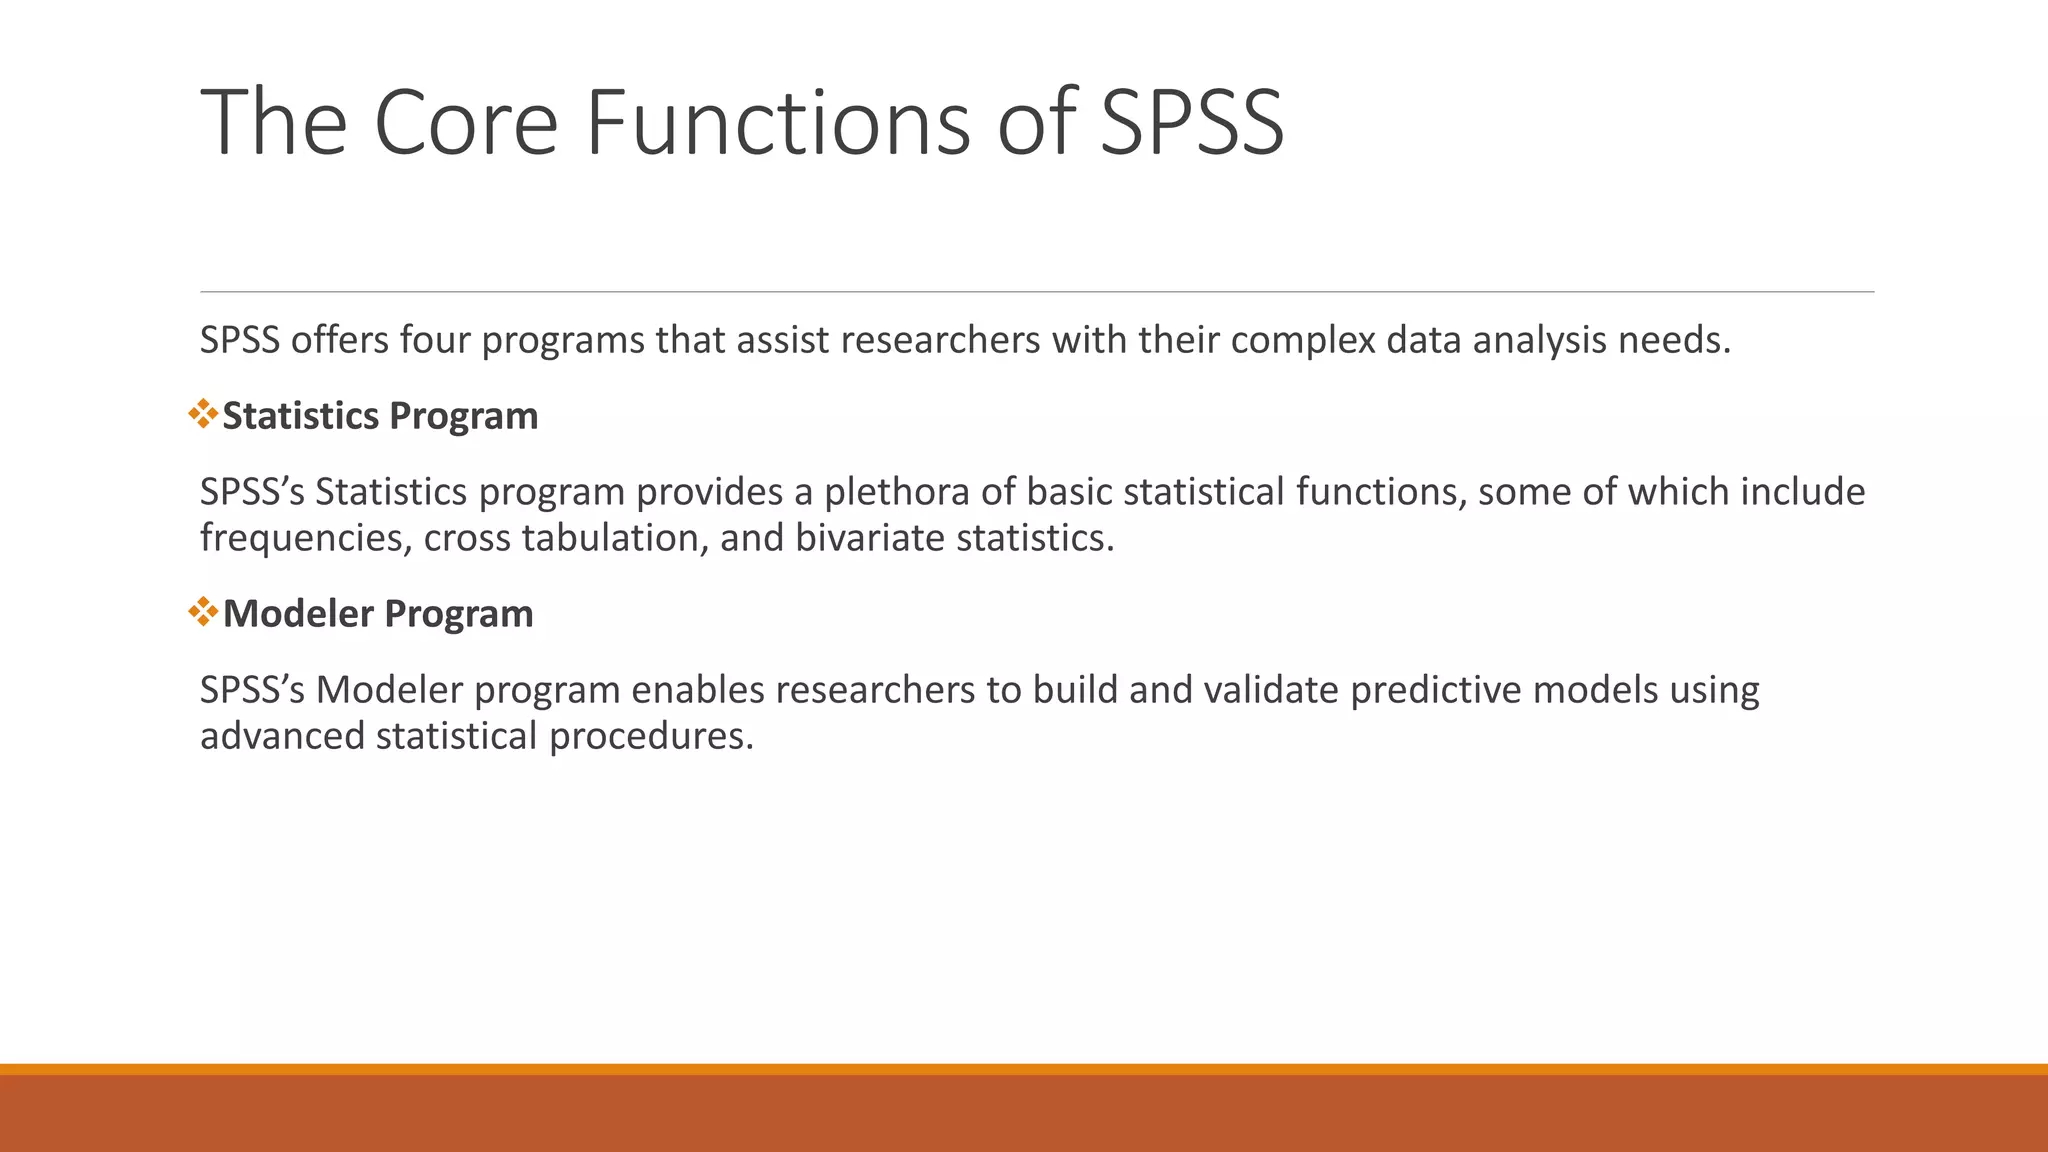
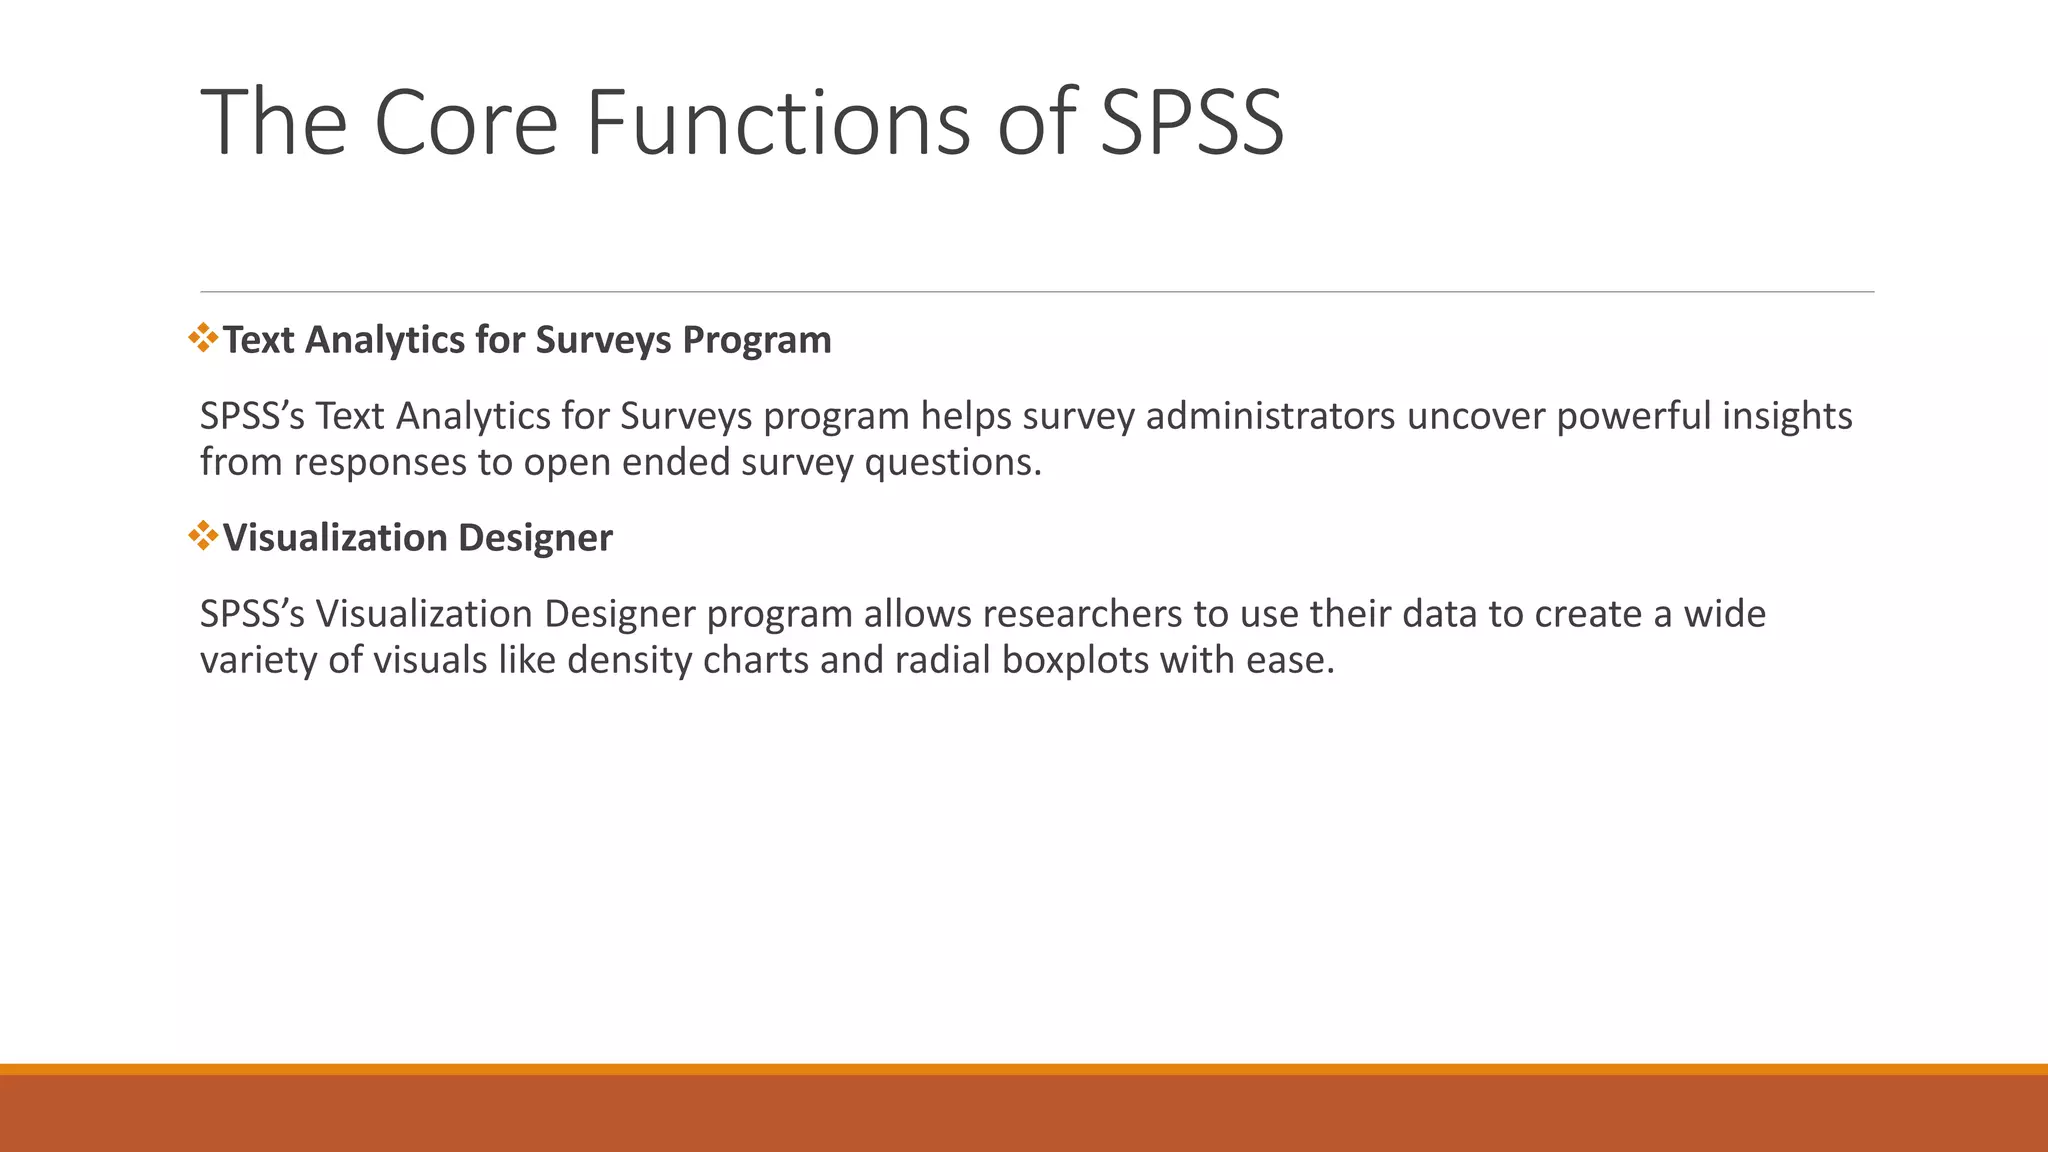
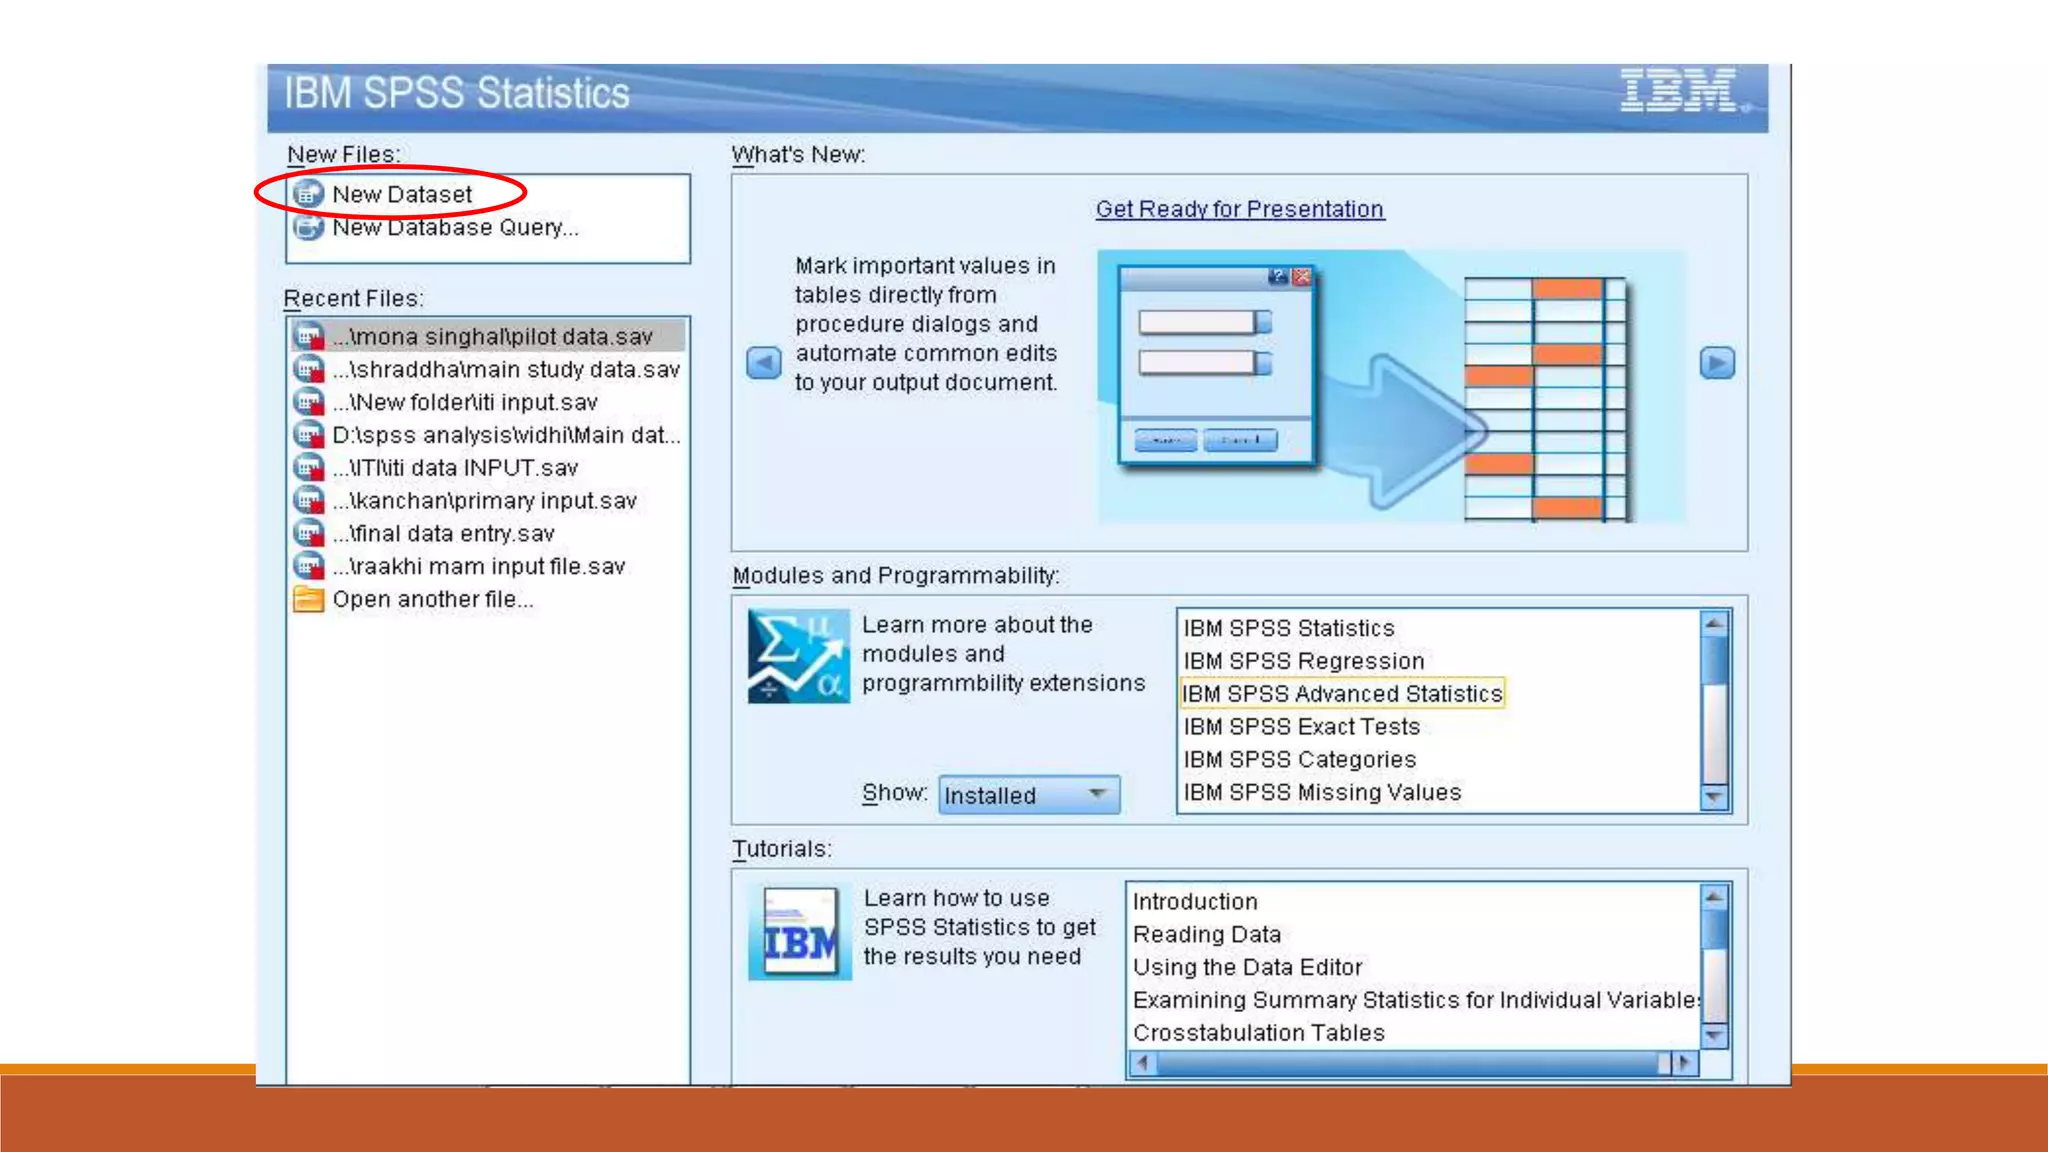
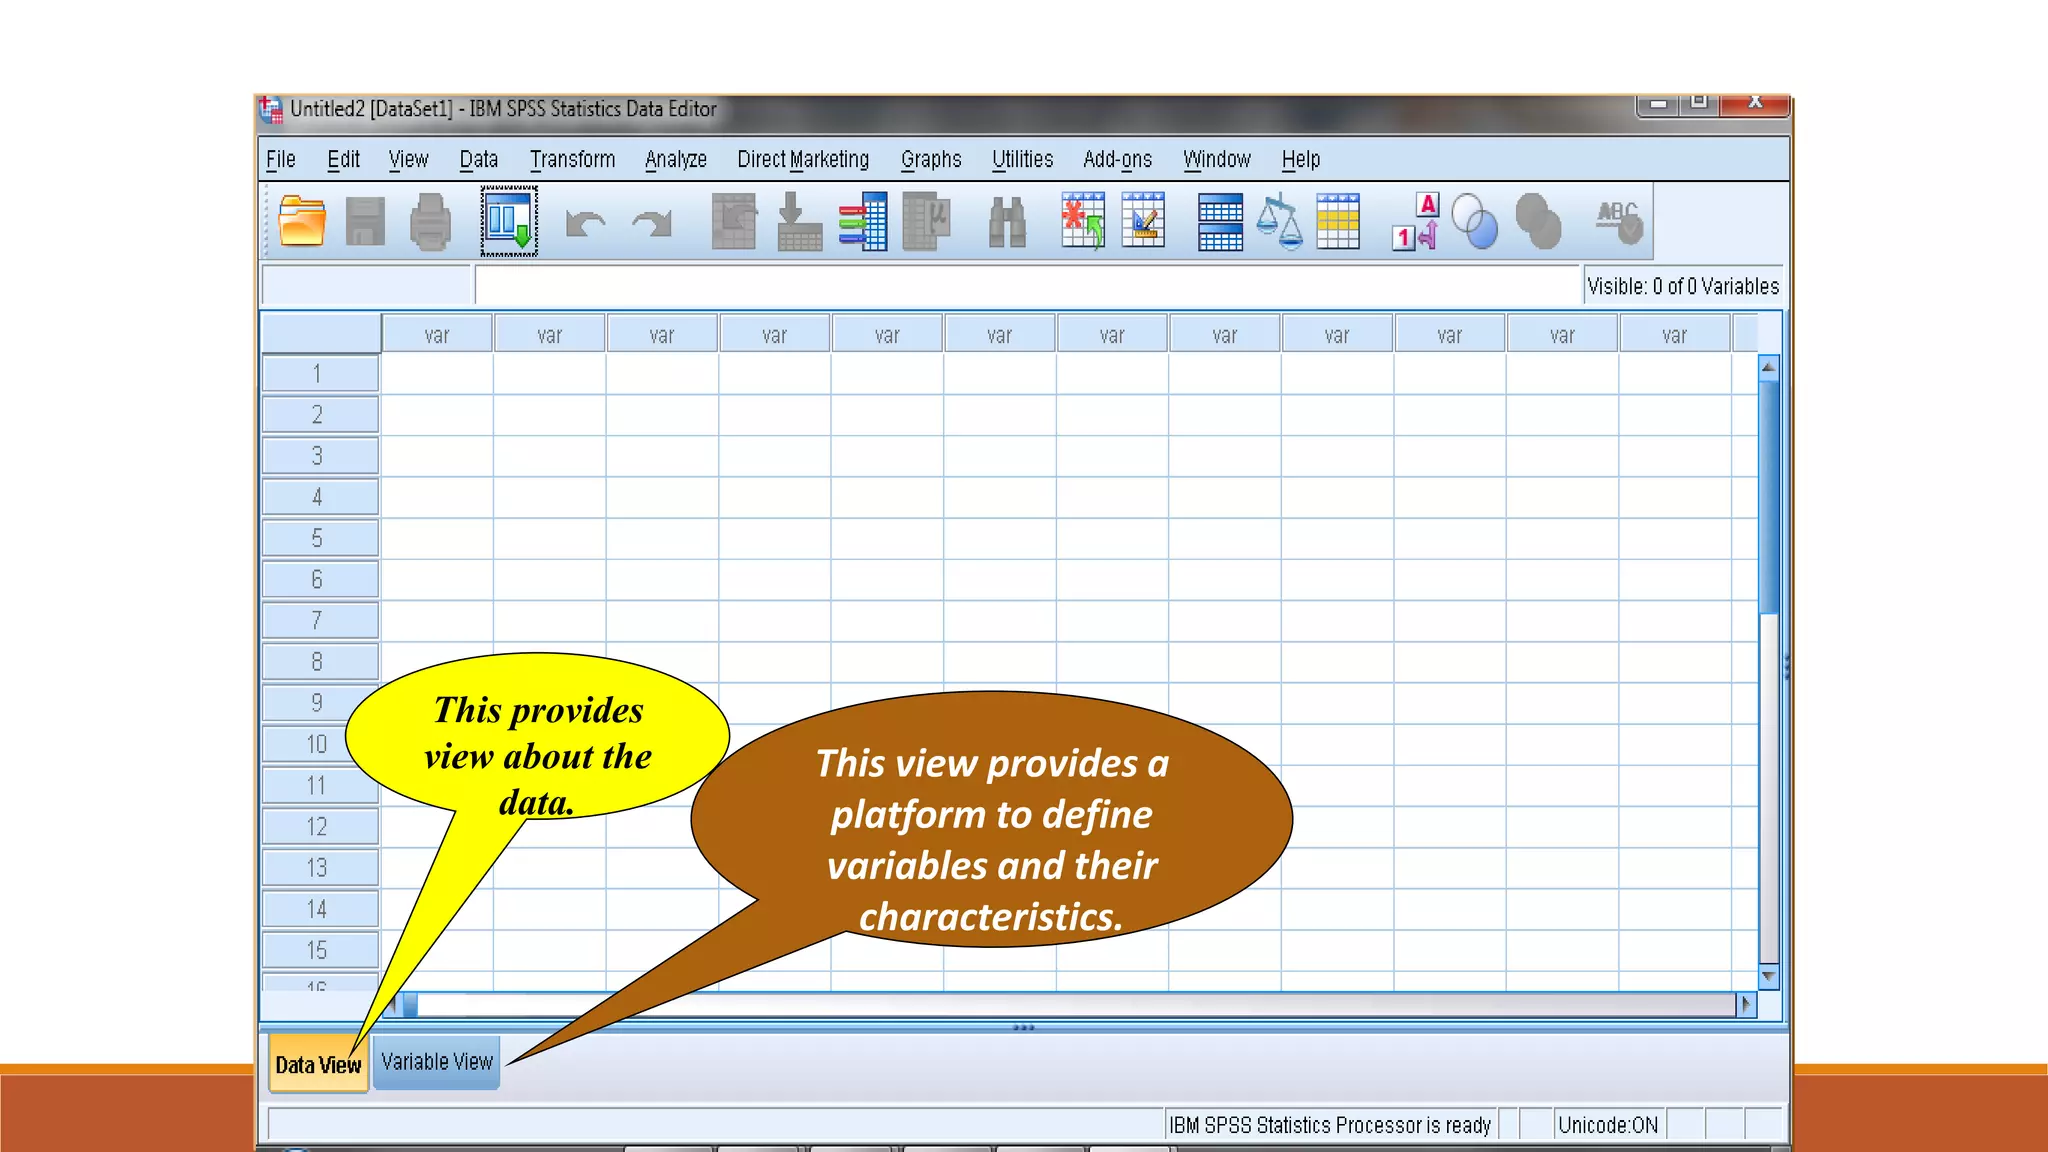
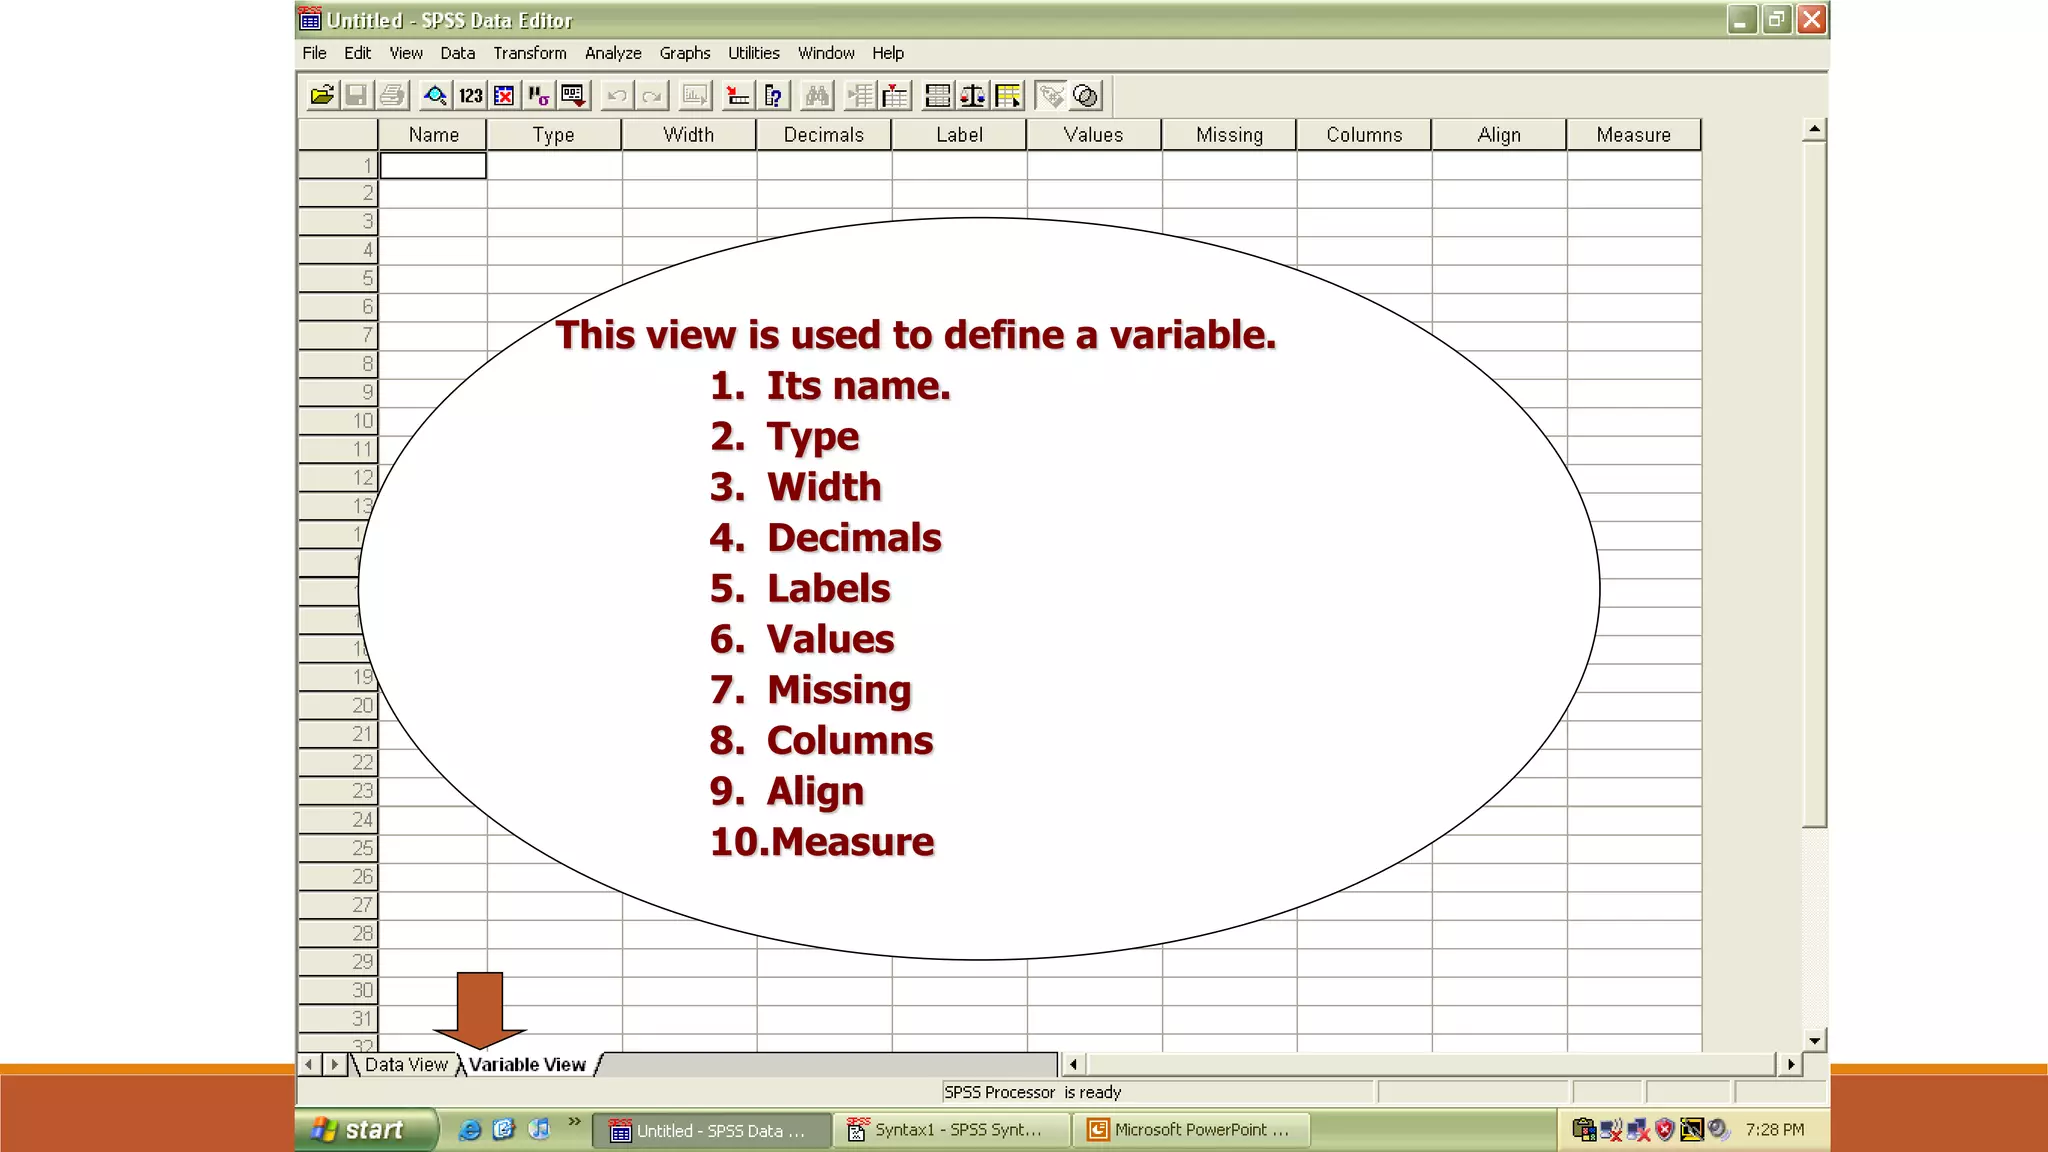
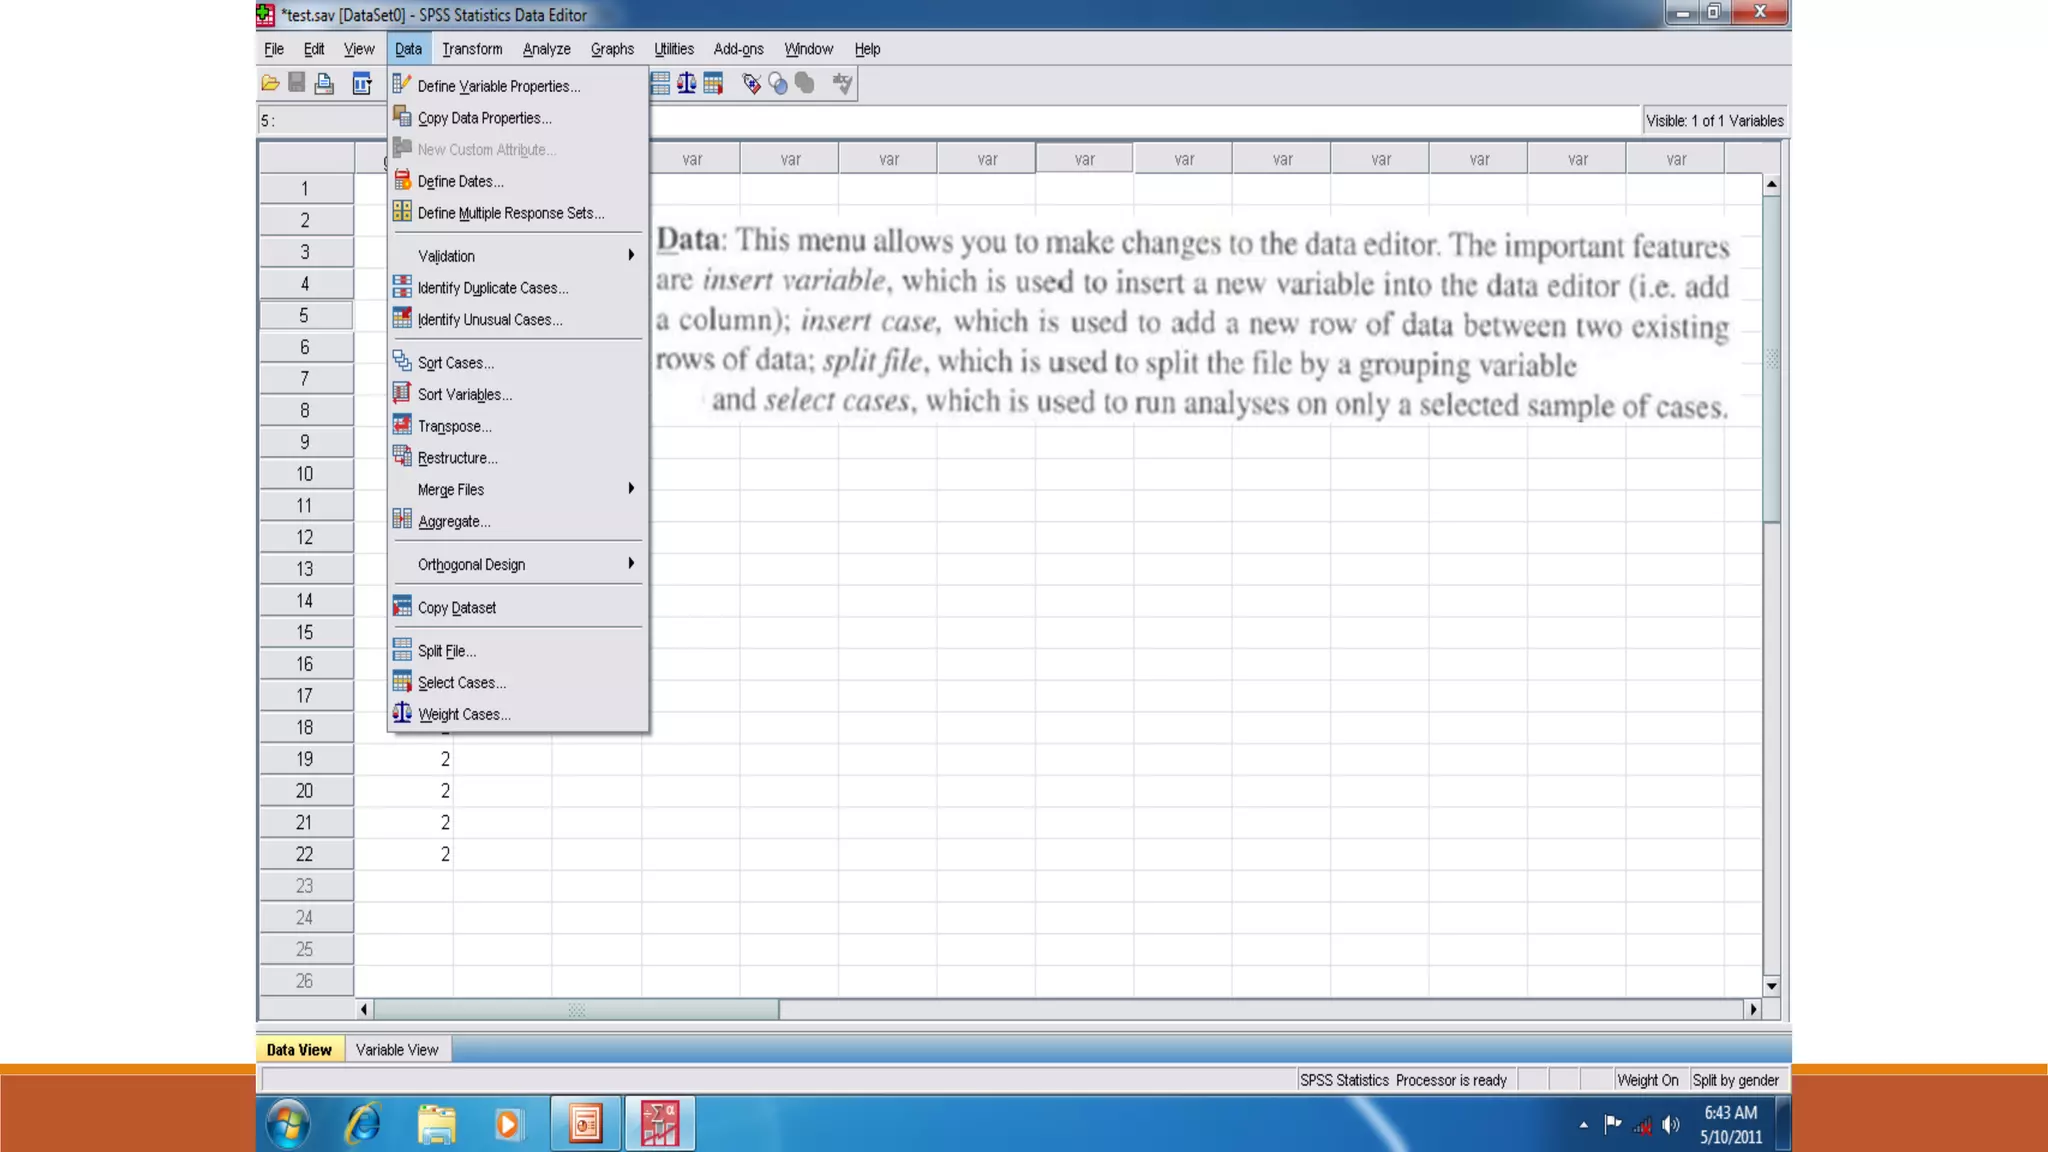
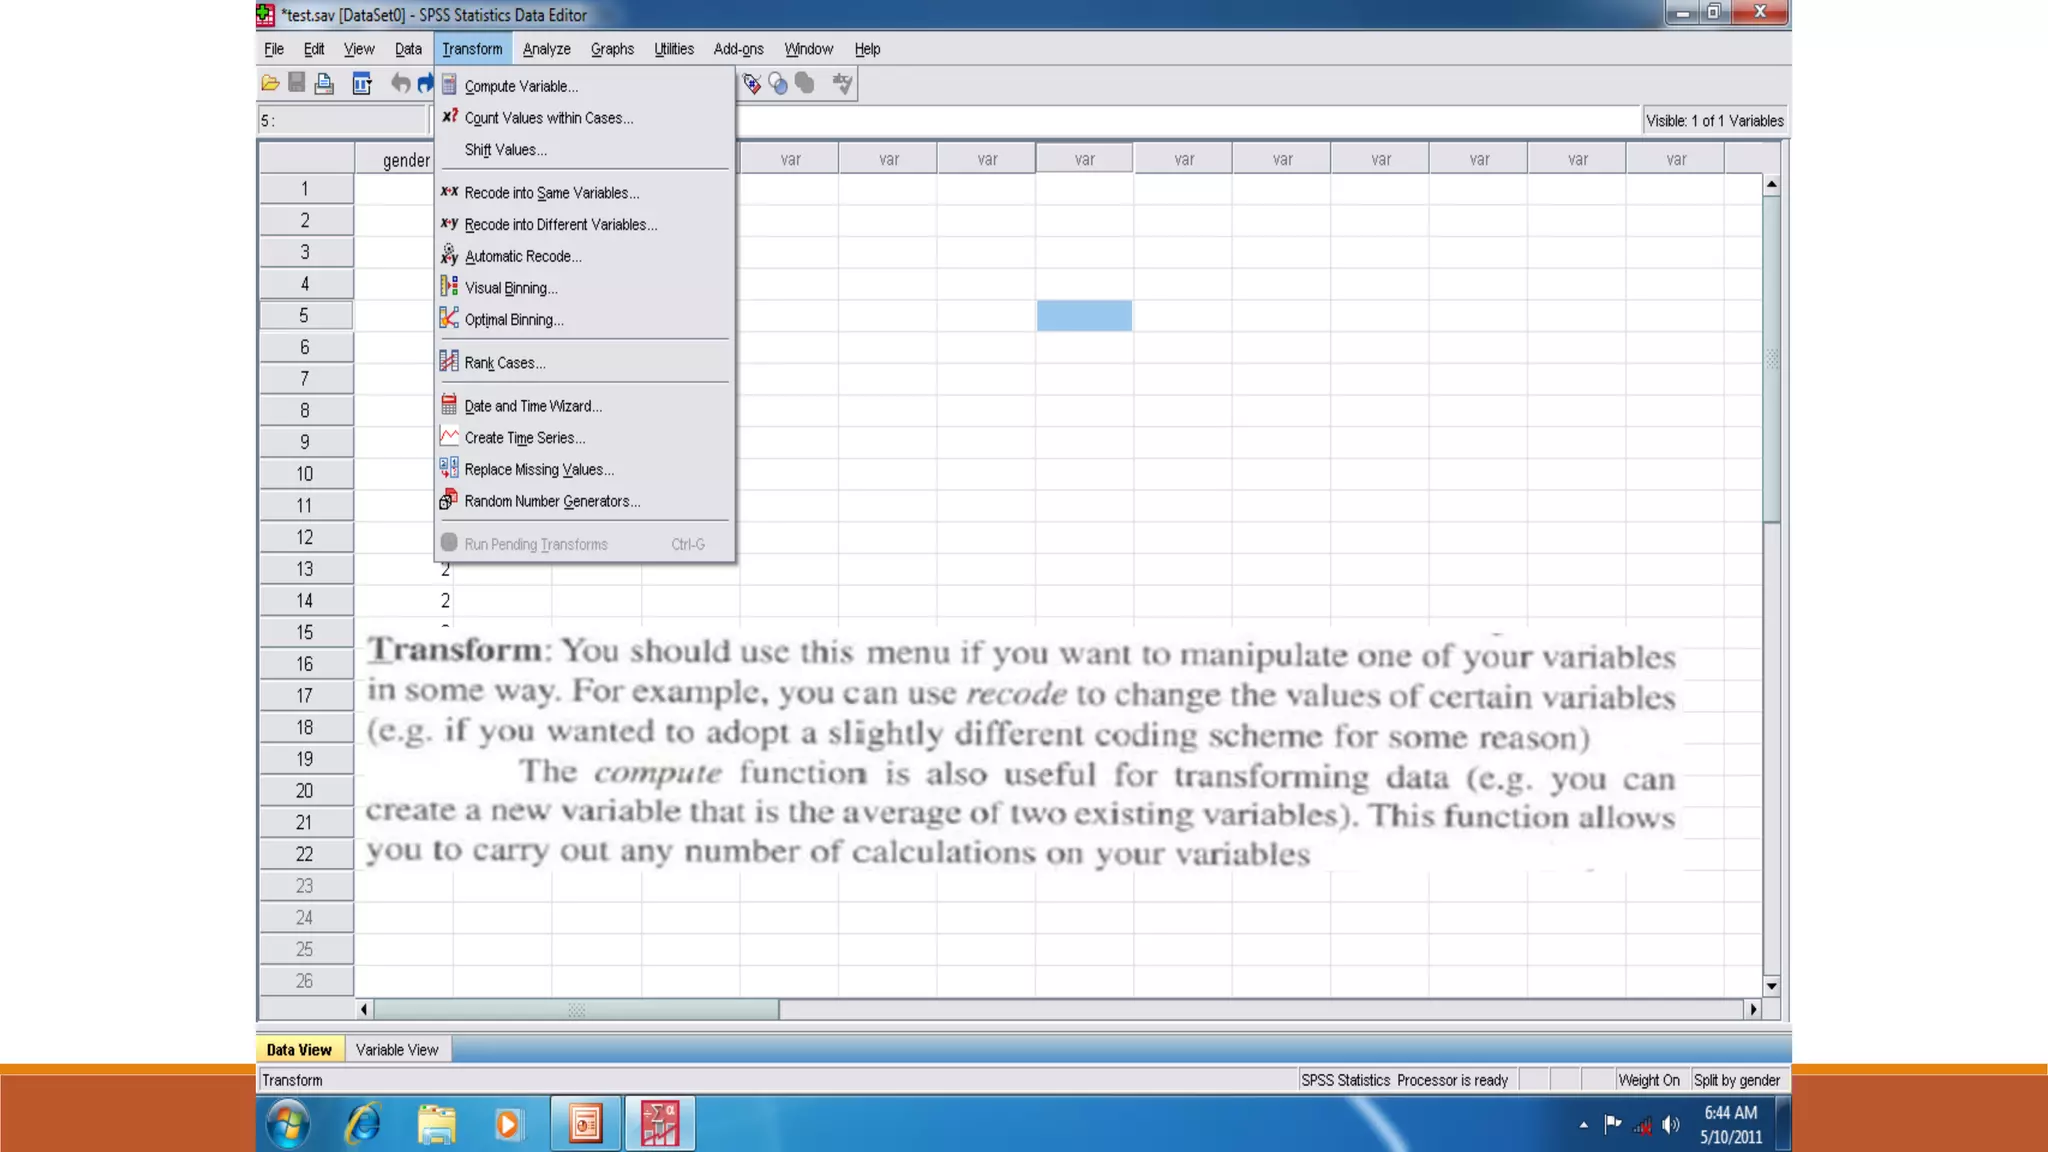
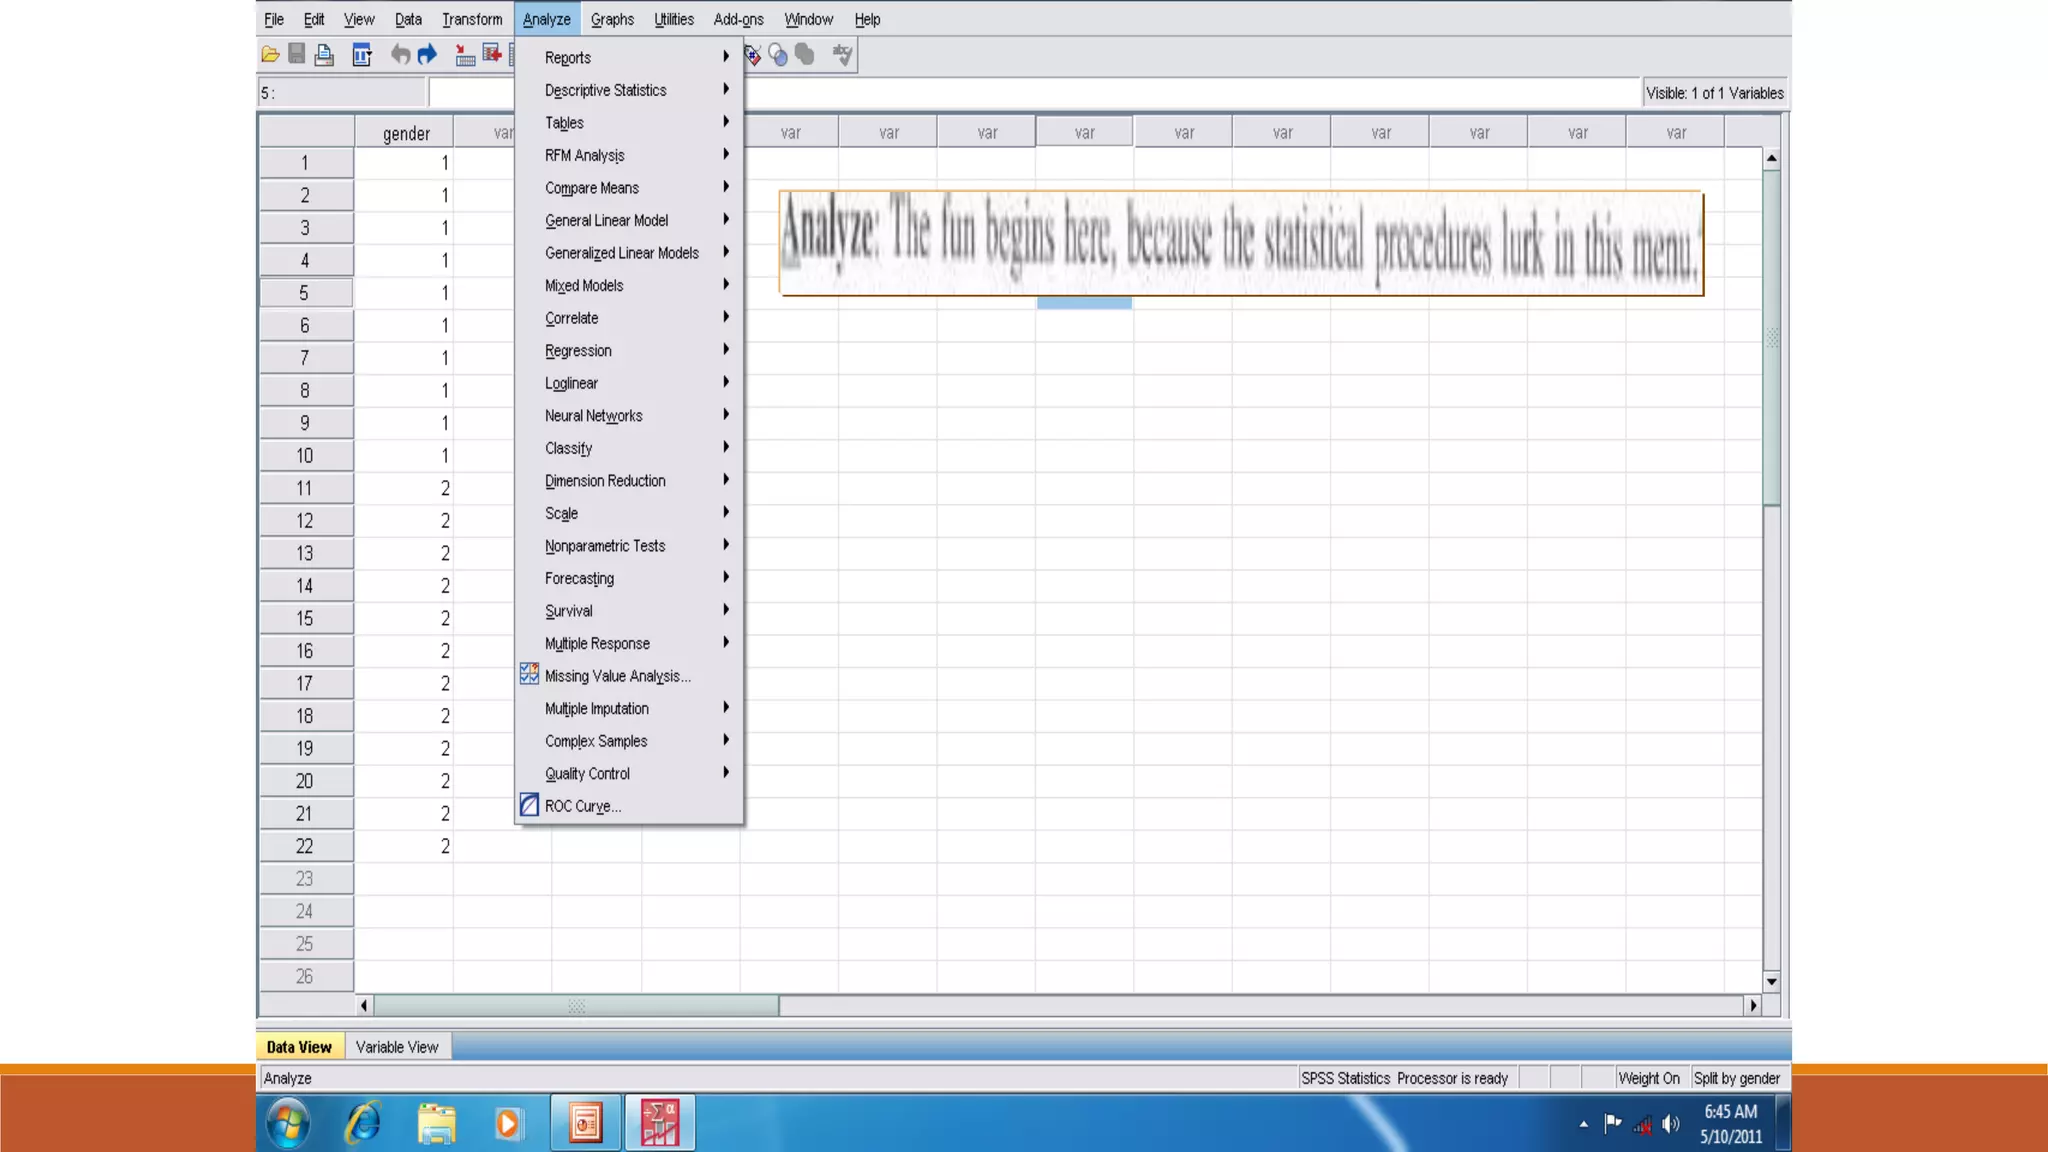
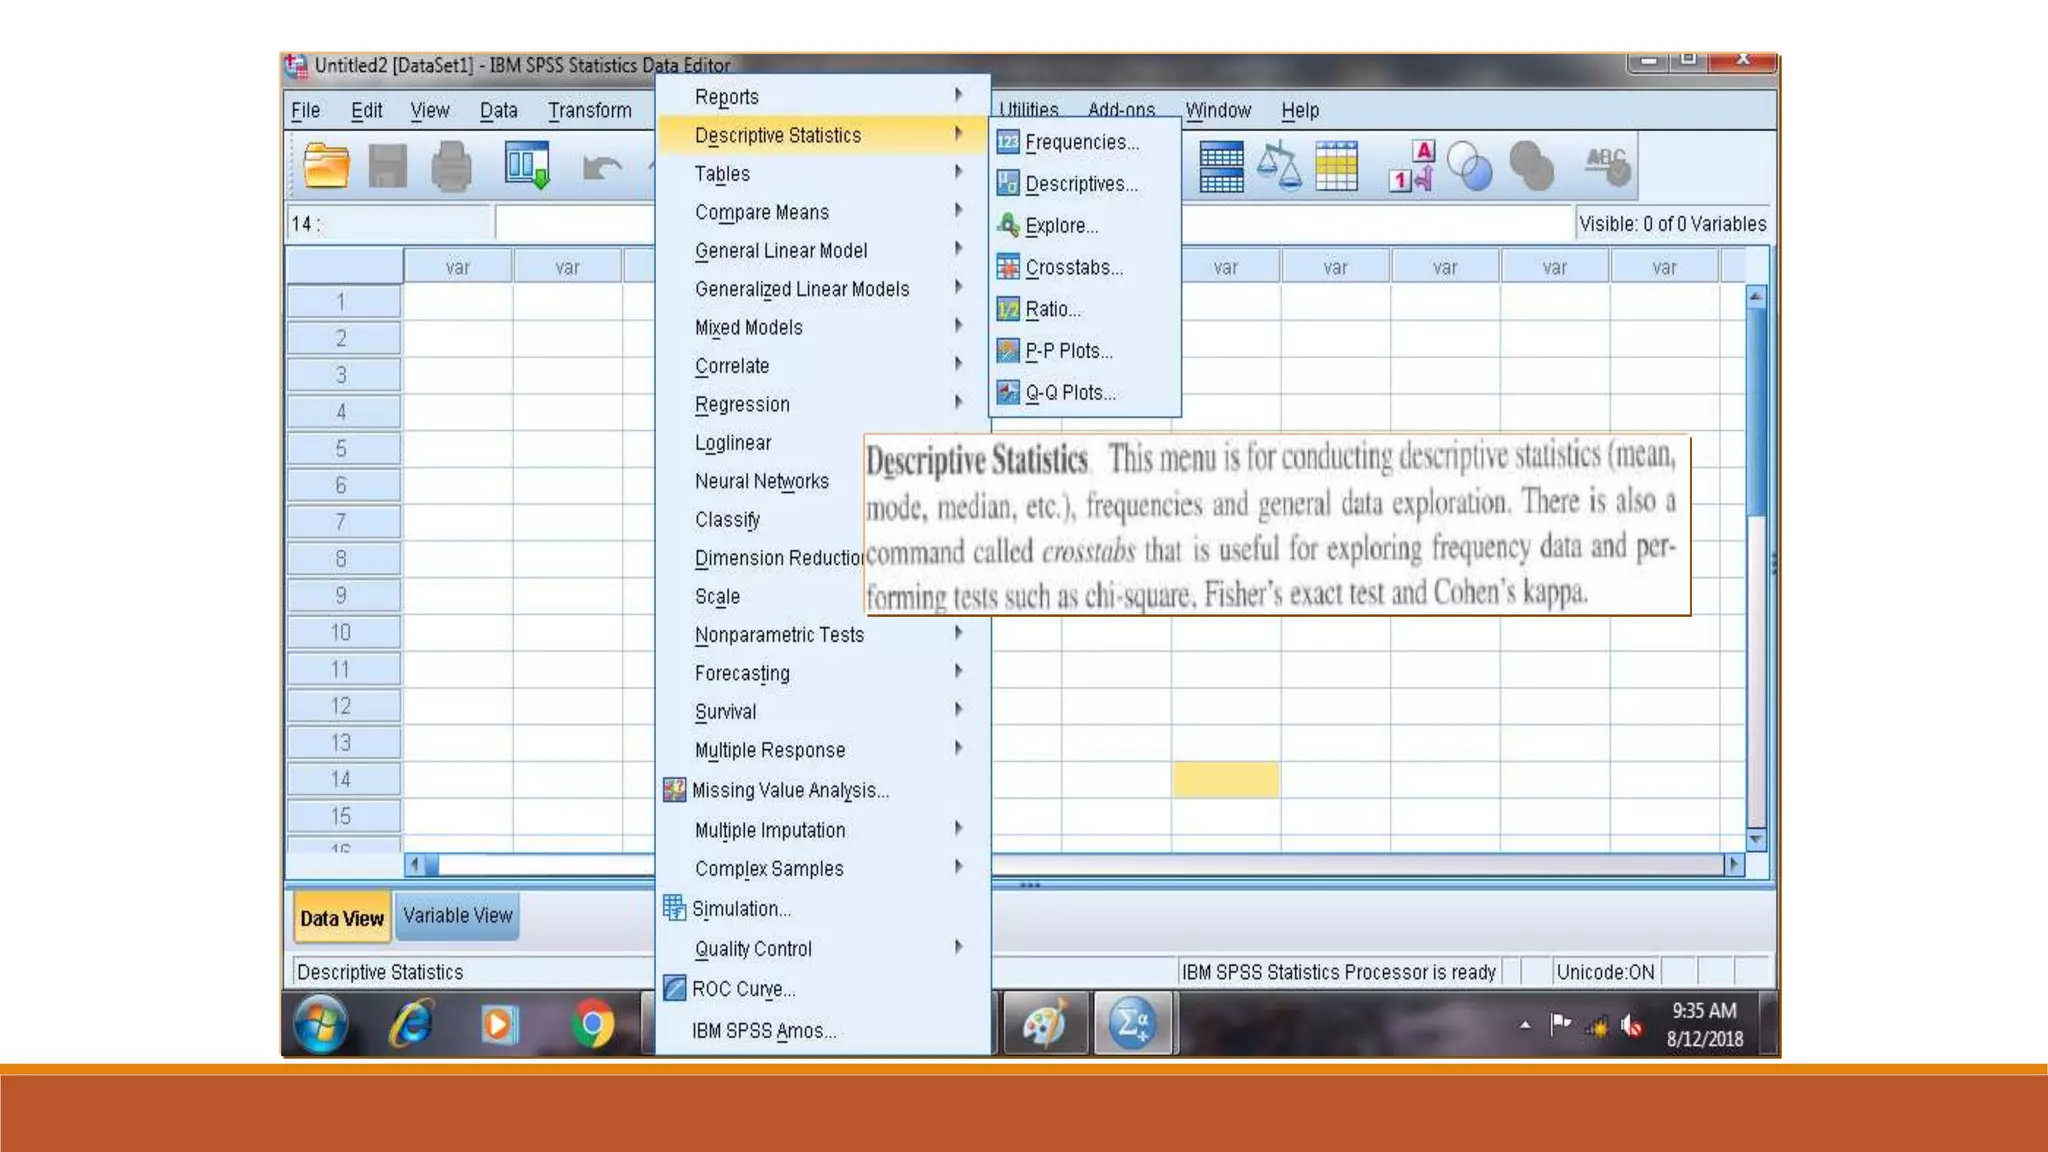
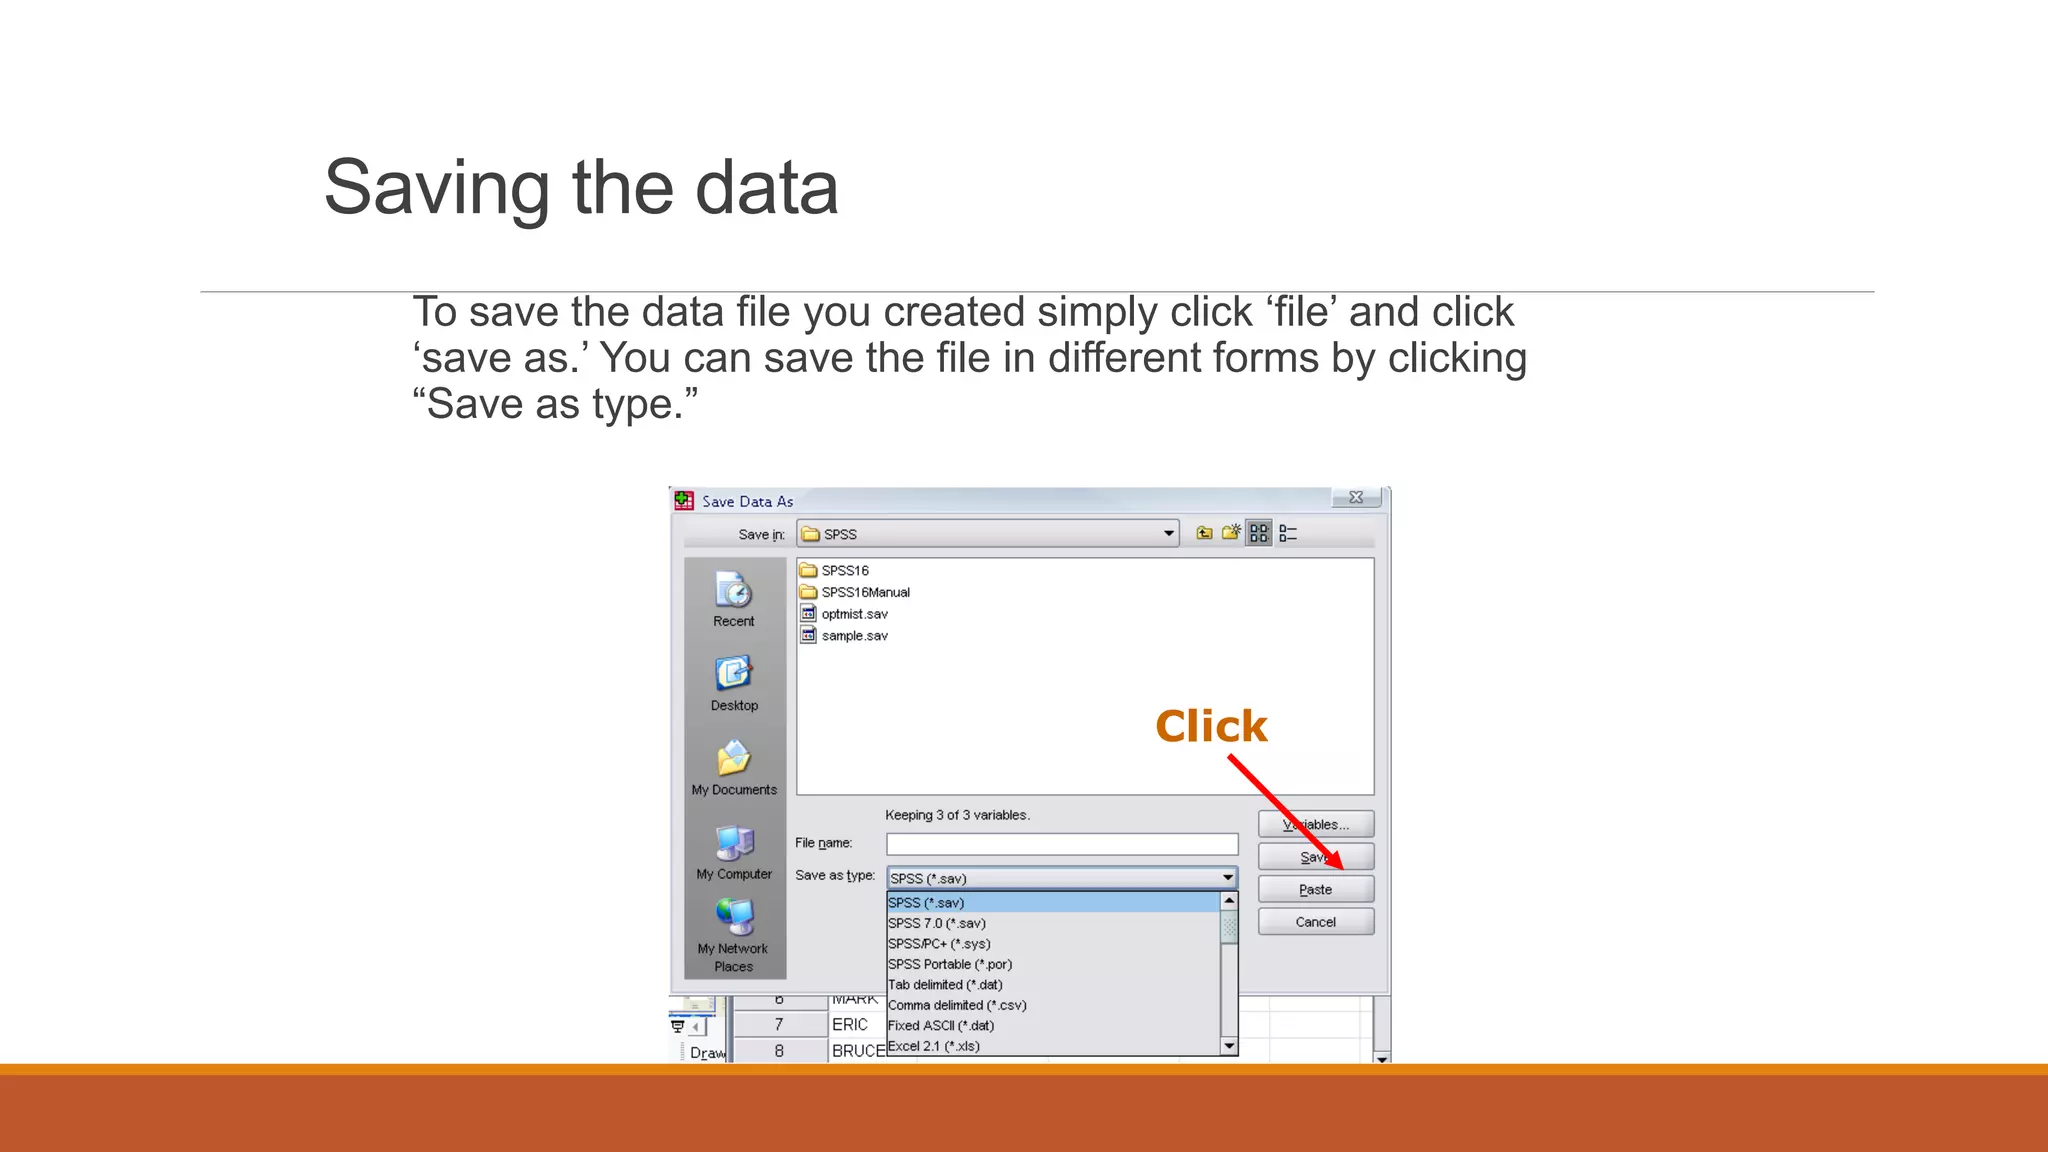
Introduction to SPSS
SPSS - AN INTRODUCTION
Statistical Package for the Social Sciences
SPSS was initially developed in 1965 at Stanford University in California.
SPSS is a registered trademark of SPSS Inc.
The software was originally meant for the social sciences, but has become popular in other fields
such as health sciences and especially in marketing, market research and data mining..
To begin with, SPSS was DOS based; now it is WINDOWS based; a number of versions are
released and the latest is SPSS 25.0.
IBM acquired spss.com!!!
Between 2009 and 2010 the premier software for SPSS was called PASW (Predictive Analytics
Software) Statistics.
The latest version is - IBM SPSS Statistics 25
The Core Functions of SPSS
SPSS offers four programs that assist researchers with their complex data analysis needs.
Statistics Program
SPSS’s Statistics program provides a plethora of basic statistical functions, some of which include
frequencies, cross tabulation, and bivariate statistics.
Modeler Program
SPSS’s Modeler program enables researchers to build and validate predictive models using
advanced statistical procedures.
The Core Functions of SPSS
Text Analytics for Surveys Program
SPSS’s Text Analytics for Surveys program helps survey administrators uncover powerful insights
from responses to open ended survey questions.
Visualization Designer
SPSS’s Visualization Designer program allows researchers to use their data to create a wide
variety of visuals like density charts and radial boxplots with ease.
The First Screen …
The Main Screen
This provides
view about the
data.
This view provides a
platform to define
variables and their
characteristics.
The Variable View
…
This view is used to define a variable.
1. Its name.
2. Type
3. Width
4. Decimals
5. Labels
6. Values
7. Missing
8. Columns
9. Align
10.Measure
Name
Each variable must have a unique name of not more than 8 characters and
starting with a letter
Try to give meaningful variable names:
Describing the characteristic: for example, age
Linking to the questionnaire: for example, A1Q3
Keep the names consistent across files
Rules for Variable Name
Type
Internal formats:
◦ Numeric - Numeric measurements, Codes, Definition of the size of the variable
◦ String (alphanumeric)- String variables contain words or characters; strings can include numbers but,
taken here as characters, mathematical operations cannot be applied to them. The maximum size of a
string variable is 255 characters
◦ Date- The input format for date variables must be defined, such as DD/MM/YYYY, MM/DD/YYYY or
MM/DD/YY
Computers store dates as numbers from a base date; in SPSS, dates are stored as the number of
seconds from 14 October 1582
Type
Output formats:
◦ Comma
◦ Dot
◦ Scientific notation
◦ Dollar
◦ Custom currency
Width and Decimals
◦ Width =
◦ Width allows you to determine the number of characters SPSS will allow to be entered for the variable
◦ # of digits displayed in data view
◦ Decimals = # of decimal places displayed in data view
It has to be less than or equal to 16
Labels
Descriptors for the variables
Name of variable displayed when running analyses
Maximum 256 characters
Used in the output
Values
Value labels are descriptors of the categories of a variable Coding
Value Labels – i.e. 1 = Male, 0 = Female
Missing
Values that the system will recognize as missing
Defines missing values
The values are excluded from some analysis
Columns and Align
Columns sets the amount of space reserved to display the contents of the variable in Data View;
generally the default value is adequate
Align sets whether the contents of the variable appear on the left, centre or right of the cell in
Data View
Numeric variables are right-hand justified by default and string variables left-hand justified by
default; the defaults are generally adequate
Measure
Levels of measurement:
◦ Nominal
◦ Ordinal
◦ Interval
◦ Ratio
In SPSS, interval and ratio are designated together as Scale
The default for string variables is Nominal
The default for numeric variables is Scale
This view is used to enter
and edit data. (Data Editor)
DR. SANKET VIJ, B. P. S. WOMEN UNIVERSITY, KHANPUR KALAN, SONIPAT
Output and Draft Viewer
DR. SANKET VIJ, B. P. S. WOMEN UNIVERSITY, KHANPUR KALAN, SONIPAT
Loglinear is a technique used
in statistics to examine the
relationship between more
than two categorical variables.
You find factor analysis here
Here, You will find reliability
analysis
Practice 1
How would you put the following information into SPSS?name gender height
sheryl female 5.7
jennifer female 5.4
tara female 5.3
christian male 5.6
jose male 5.8
roberto male 5.7
kasie female 5.5
cady female 5.5
sandy female 5.6
daniel male 6
kurra female 5.4
ashley female 5.4
alain male 6.1
Practice 1 (Solution Sample)
Click
Click
Saving the data
To save the data file you created simply click ‘file’ and click
‘save as.’ You can save the file in different forms by clicking
“Save as type.”
Click

Introduction to spss

  • 1.
  • 2.
    SPSS - ANINTRODUCTION Statistical Package for the Social Sciences SPSS was initially developed in 1965 at Stanford University in California. SPSS is a registered trademark of SPSS Inc. The software was originally meant for the social sciences, but has become popular in other fields such as health sciences and especially in marketing, market research and data mining.. To begin with, SPSS was DOS based; now it is WINDOWS based; a number of versions are released and the latest is SPSS 25.0.
  • 3.
    IBM acquired spss.com!!! Between2009 and 2010 the premier software for SPSS was called PASW (Predictive Analytics Software) Statistics. The latest version is - IBM SPSS Statistics 25
  • 4.
    The Core Functionsof SPSS SPSS offers four programs that assist researchers with their complex data analysis needs. Statistics Program SPSS’s Statistics program provides a plethora of basic statistical functions, some of which include frequencies, cross tabulation, and bivariate statistics. Modeler Program SPSS’s Modeler program enables researchers to build and validate predictive models using advanced statistical procedures.
  • 5.
    The Core Functionsof SPSS Text Analytics for Surveys Program SPSS’s Text Analytics for Surveys program helps survey administrators uncover powerful insights from responses to open ended survey questions. Visualization Designer SPSS’s Visualization Designer program allows researchers to use their data to create a wide variety of visuals like density charts and radial boxplots with ease.
  • 6.
  • 8.
  • 9.
    This provides view aboutthe data. This view provides a platform to define variables and their characteristics.
  • 10.
  • 11.
    This view isused to define a variable. 1. Its name. 2. Type 3. Width 4. Decimals 5. Labels 6. Values 7. Missing 8. Columns 9. Align 10.Measure
  • 12.
    Name Each variable musthave a unique name of not more than 8 characters and starting with a letter Try to give meaningful variable names: Describing the characteristic: for example, age Linking to the questionnaire: for example, A1Q3 Keep the names consistent across files
  • 13.
  • 14.
    Type Internal formats: ◦ Numeric- Numeric measurements, Codes, Definition of the size of the variable ◦ String (alphanumeric)- String variables contain words or characters; strings can include numbers but, taken here as characters, mathematical operations cannot be applied to them. The maximum size of a string variable is 255 characters ◦ Date- The input format for date variables must be defined, such as DD/MM/YYYY, MM/DD/YYYY or MM/DD/YY Computers store dates as numbers from a base date; in SPSS, dates are stored as the number of seconds from 14 October 1582
  • 15.
    Type Output formats: ◦ Comma ◦Dot ◦ Scientific notation ◦ Dollar ◦ Custom currency
  • 16.
    Width and Decimals ◦Width = ◦ Width allows you to determine the number of characters SPSS will allow to be entered for the variable ◦ # of digits displayed in data view ◦ Decimals = # of decimal places displayed in data view It has to be less than or equal to 16
  • 17.
    Labels Descriptors for thevariables Name of variable displayed when running analyses Maximum 256 characters Used in the output
  • 18.
    Values Value labels aredescriptors of the categories of a variable Coding Value Labels – i.e. 1 = Male, 0 = Female
  • 19.
    Missing Values that thesystem will recognize as missing Defines missing values The values are excluded from some analysis
  • 20.
    Columns and Align Columnssets the amount of space reserved to display the contents of the variable in Data View; generally the default value is adequate Align sets whether the contents of the variable appear on the left, centre or right of the cell in Data View Numeric variables are right-hand justified by default and string variables left-hand justified by default; the defaults are generally adequate
  • 21.
    Measure Levels of measurement: ◦Nominal ◦ Ordinal ◦ Interval ◦ Ratio In SPSS, interval and ratio are designated together as Scale The default for string variables is Nominal The default for numeric variables is Scale
  • 22.
    This view isused to enter and edit data. (Data Editor)
  • 23.
    DR. SANKET VIJ,B. P. S. WOMEN UNIVERSITY, KHANPUR KALAN, SONIPAT Output and Draft Viewer
  • 24.
    DR. SANKET VIJ,B. P. S. WOMEN UNIVERSITY, KHANPUR KALAN, SONIPAT
  • 25.
    DR. SANKET VIJ,B. P. S. WOMEN UNIVERSITY, KHANPUR KALAN, SONIPAT
  • 26.
    DR. SANKET VIJ,B. P. S. WOMEN UNIVERSITY, KHANPUR KALAN, SONIPAT
  • 27.
    DR. SANKET VIJ,B. P. S. WOMEN UNIVERSITY, KHANPUR KALAN, SONIPAT
  • 28.
    DR. SANKET VIJ,B. P. S. WOMEN UNIVERSITY, KHANPUR KALAN, SONIPAT
  • 29.
    DR. SANKET VIJ,B. P. S. WOMEN UNIVERSITY, KHANPUR KALAN, SONIPAT
  • 34.
    Loglinear is atechnique used in statistics to examine the relationship between more than two categorical variables.
  • 35.
    You find factoranalysis here
  • 36.
    Here, You willfind reliability analysis
  • 52.
    Practice 1 How wouldyou put the following information into SPSS?name gender height sheryl female 5.7 jennifer female 5.4 tara female 5.3 christian male 5.6 jose male 5.8 roberto male 5.7 kasie female 5.5 cady female 5.5 sandy female 5.6 daniel male 6 kurra female 5.4 ashley female 5.4 alain male 6.1
  • 53.
    Practice 1 (SolutionSample) Click
  • 54.
  • 55.
    Saving the data Tosave the data file you created simply click ‘file’ and click ‘save as.’ You can save the file in different forms by clicking “Save as type.” Click