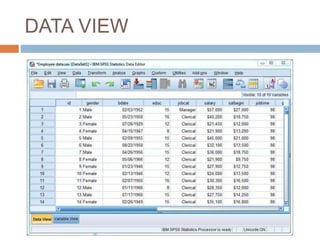
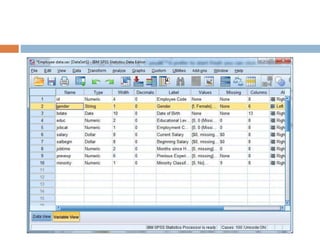
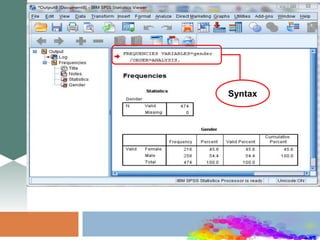
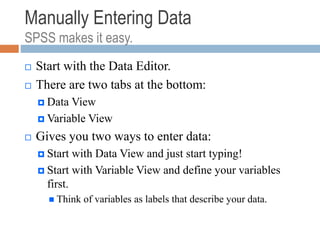
SlideShare a Scribd company logo
1 of 29
INTRODUCTION
TO SPSS
What is SPSS?
Originally it is an acronym “Statistical Package for the
Social Sciences” but now it stands for Statistical Product
and Service Solutions It is also known by the name
PASW (Predictive Analytics Software)
It is a software used for data analysis in business research.
Can be used for:
o Processing Questionnaires
o Reporting in Tables and Graphs
o Analyzing: Means, Chi-square, Regression, …and much
more..
History
SPSS has a long heritage
 Introduced in 1968.
 Was originally developed to facilitate statistical
analysis in the social sciences.
 Early versions designed to run on mainframe
computers.
 On July 28, 2009 IBM announced it was acquiring
SPSS Inc. for $ 1.2 billion in cash
 The current versions (2015) are officially named
IBM SPSS Statistics.
About SPSS Incorporated
 SPSS Inc. is a leading worldwide provider of
predictive analytics software and solutions.
 SPSS Inc. was a software house headquartered in
Chicago and incorporated in Delaware
 The company was started in 1968 by Norman Nie,
Dale Bent, and Hadlai "Tex" Hull
 Today SPSS has more than 250,000 customers
worldwide, served by more than 1,200 employees in
60 countries.
Now the company is known as
SPSS: An IBM® Company
:
General Capabilities
SPSS has a lot of great features
 Can import data from many different sources, such as
Microsoft® Excel and SAS®.
 Provides analysis tools to generate reports, charts,
plots, descriptive statistics, and run advanced
statistical analyses.
 In addition to user interface, provides a command
syntax that can simplify certain things, such as
running repetitive tasks.
Basic Operations in SPSS
(Basic Steps In Data Analysis)
 Variable Entry (adding or deleting a variable)
 Data Entry (adding or deleting the data)
 Saving the data
 Importing data from Excel file
 Checking the data entered
 Sorting the data
 Transforming the data
7
Variables
 A concept which can take on different
quantitative values is called a variable.
 Ex. What are variables you would consider in buying
a second hand bike?
 Brand
 Type
 Age
 Condition (Excellent, good, poor)
 Price
8
 Dichotomous variables (having two values only)
 Yes or No
 Male or Female
 Income, age or a test score are the examples of
continuous variables.
 These variables may take on any value within a given
range, or in some cases, an infinite set.
9
Measurement Scales
 The process of assigning numbers to objects in such
a way that specific properties of the objects are
faithfully represented by specific properties of the
numbers.
 Types of Scales:
 Nominal
 Ordinal
 Scale
 Interval
 Ratio
10
Types of Scales
 Nominal
 example: nationality, race, gender…
 based on a concept (two categories variable called
“dichotomous nominal”)
 Ordinal
 example: knowledge, skill... (more than, equal, less than)
 rank-ordered in terms of a criterion from highest to lowest
 Interval/Ratio
 example: age, income, speed...
 based on arithmetic qualities and have a fixed zero point
7 3
8
Nominal Numbers
Assigned
to Runners
Ordinal Rank Order
of Winners
Interval Performance
Rating on a
Scale
Ratio Time to Finish
in Seconds
Third
place
Second
place
First
place
Finish
Finish
8.2 9.1 9.6
15.2 14.1 13.4
Scale
Scale Basic
Characteristics
Common
Examples
Nominal Numbers identify
& classify objects
Gender,
numbering of
football players
Percentages,
mode
Chi-square,
binomial test
Ordinal Nos. indicate the
relative positions
of objects but not
the magnitude of
differences
between them
Quality rankings,
rankings of teams
in a tournament
Percentile,
median
Rank-order
correlation,
Friedman
ANOVA
Ratio Zero point is fixed,
ratios of scale
values can be
compared
Length, weight Geometric
mean, harmonic
mean
Coefficient of
variation
Permissible Statistics
Descriptive Inferential
Interval Differences
between objects
Temperature
(Fahrenheit)
Range, mean,
standard
Product-
moment
Primary Scales
SPSS INTERFACE
TYPES OF WINDOWS
Data view
Variable View
Output Viewer
Pivot Table Editor
Chart Editor
Text Output Editor
Syntax Editor
Data Editor (.sav files)
 The Data Editor lets you see and manipulate
your data. You will always have at least one
Data Editor open (even if you have not yet
opened a data set). When you open an SPSS
data file, what you see is a working copy of
your data. Changes you make to your data are
not permanent until you save them (click File -
Save or Save As). Data files are saved with a
file type of .sav, a file type that most other
software cannot work with
Data Viewer
Entering
Editing
Displaying
DATA
No. of Respondents/Questionnaires/Schedules
DATA VIEW
VARIABLE VIEW
 In the Variable View you can see and edit the
information that defines each variable
(sometimes called meta-data) in your data set:
each column of the Data View is described by
a row of the Variable View.
Variable View
Programming
Defining
Qualitative
Questions
Number of Questions
1. Opens automatically if it
runs a procedure
2. Displays Statistical results,
Graphs and save it for
future use.
Outline Pane
Navigate output
Highlight output
Pivot table editor
Text output edit
Chart Editor
Pivot table Editor
Text Edit
Double
Click
Editing
Options
Chart Editor
Syntax
Manually Entering Data
SPSS makes it easy.
 Start with the Data Editor.
 There are two tabs at the bottom:
 Data View
 Variable View
 Gives you two ways to enter data:
 Start with Data View and just start typing!
 Start with Variable View and define your variables
first.
 Think of variables as labels that describe your data.
 Gender
 Age
spss-anintroduction-150704135929-lva1-app6892.ppt

More Related Content

Similar to spss-anintroduction-150704135929-lva1-app6892.ppt

Introduction to Statistical package of social sciences
Introduction to Statistical package of social sciencesIntroduction to Statistical package of social sciences
Introduction to Statistical package of social sciences
prachisachdev4
 
Topic 4 intro spss_stata 30032012 sy_srini
Topic 4 intro spss_stata 30032012 sy_sriniTopic 4 intro spss_stata 30032012 sy_srini
Topic 4 intro spss_stata 30032012 sy_srini
SM Lalon
 
Cssu dw dm
Cssu dw dmCssu dw dm
Cssu dw dm
sumit621
 

Similar to spss-anintroduction-150704135929-lva1-app6892.ppt (20)

SPSS: Quick Look
SPSS: Quick LookSPSS: Quick Look
SPSS: Quick Look
 
Introduction to Statistical package of social sciences
Introduction to Statistical package of social sciencesIntroduction to Statistical package of social sciences
Introduction to Statistical package of social sciences
 
Topic 4 intro spss_stata 30032012 sy_srini
Topic 4 intro spss_stata 30032012 sy_sriniTopic 4 intro spss_stata 30032012 sy_srini
Topic 4 intro spss_stata 30032012 sy_srini
 
Uses of SPSS and Excel to analyze data
Uses of SPSS and Excel   to analyze dataUses of SPSS and Excel   to analyze data
Uses of SPSS and Excel to analyze data
 
extra material for practicals in spss.pptx
extra material for practicals in spss.pptxextra material for practicals in spss.pptx
extra material for practicals in spss.pptx
 
Introduction To SPSS
Introduction To SPSSIntroduction To SPSS
Introduction To SPSS
 
Presentation on spss
Presentation on spssPresentation on spss
Presentation on spss
 
Spss basics tutorial
Spss basics tutorialSpss basics tutorial
Spss basics tutorial
 
SPSS introduction Presentation
SPSS introduction Presentation SPSS introduction Presentation
SPSS introduction Presentation
 
SoftwareforDataAnalysisinSPSSOnoverview1.docx
SoftwareforDataAnalysisinSPSSOnoverview1.docxSoftwareforDataAnalysisinSPSSOnoverview1.docx
SoftwareforDataAnalysisinSPSSOnoverview1.docx
 
Introduction to the Research Method and SPSS
Introduction to the Research Method and SPSS Introduction to the Research Method and SPSS
Introduction to the Research Method and SPSS
 
SPSS :Introduction for beginners
SPSS :Introduction for beginners SPSS :Introduction for beginners
SPSS :Introduction for beginners
 
Lobsters, Wine and Market Research
Lobsters, Wine and Market ResearchLobsters, Wine and Market Research
Lobsters, Wine and Market Research
 
Cssu dw dm
Cssu dw dmCssu dw dm
Cssu dw dm
 
Stata tutorial university of princeton
Stata tutorial university of princetonStata tutorial university of princeton
Stata tutorial university of princeton
 
DATA HANDLING FOR SPSS
DATA HANDLING FOR SPSSDATA HANDLING FOR SPSS
DATA HANDLING FOR SPSS
 
data analysis techniques and statistical softwares
data analysis techniques and statistical softwaresdata analysis techniques and statistical softwares
data analysis techniques and statistical softwares
 
6967176.ppt
6967176.ppt6967176.ppt
6967176.ppt
 
Spss
SpssSpss
Spss
 
Ibm spss statistics 19 brief guide
Ibm spss statistics 19 brief guideIbm spss statistics 19 brief guide
Ibm spss statistics 19 brief guide
 

More from FlorArquillano3 (9)

SHS ORIENTATION on voucher program 2023.pdf
SHS ORIENTATION on voucher program 2023.pdfSHS ORIENTATION on voucher program 2023.pdf
SHS ORIENTATION on voucher program 2023.pdf
 
DESCRIPTIVE STATISTICS - FREQUENCY DISTRIBUTION.pdf
DESCRIPTIVE STATISTICS - FREQUENCY DISTRIBUTION.pdfDESCRIPTIVE STATISTICS - FREQUENCY DISTRIBUTION.pdf
DESCRIPTIVE STATISTICS - FREQUENCY DISTRIBUTION.pdf
 
FUNDAMENTALS OF INDUSTRIAL SECURITY.pdf
FUNDAMENTALS OF  INDUSTRIAL SECURITY.pdfFUNDAMENTALS OF  INDUSTRIAL SECURITY.pdf
FUNDAMENTALS OF INDUSTRIAL SECURITY.pdf
 
MIST-BSISM OBE Syllabus fundamentals of Investigation and Intelligence.pdf
MIST-BSISM OBE Syllabus fundamentals of Investigation and Intelligence.pdfMIST-BSISM OBE Syllabus fundamentals of Investigation and Intelligence.pdf
MIST-BSISM OBE Syllabus fundamentals of Investigation and Intelligence.pdf
 
LESSON 2_CLASSIFICATION OF ENTREPRENEURS.pdf
LESSON 2_CLASSIFICATION OF ENTREPRENEURS.pdfLESSON 2_CLASSIFICATION OF ENTREPRENEURS.pdf
LESSON 2_CLASSIFICATION OF ENTREPRENEURS.pdf
 
LESSON 1_ENTREPRENEURSHIP (AN OVERVIEW).pdf
LESSON 1_ENTREPRENEURSHIP (AN OVERVIEW).pdfLESSON 1_ENTREPRENEURSHIP (AN OVERVIEW).pdf
LESSON 1_ENTREPRENEURSHIP (AN OVERVIEW).pdf
 
STUDY ABOUT MEASUREMENT AND ITS CONVERSION.pptx
STUDY ABOUT MEASUREMENT AND ITS CONVERSION.pptxSTUDY ABOUT MEASUREMENT AND ITS CONVERSION.pptx
STUDY ABOUT MEASUREMENT AND ITS CONVERSION.pptx
 
BIG BANG THEORY how the earth started.pdf
BIG BANG THEORY how the earth started.pdfBIG BANG THEORY how the earth started.pdf
BIG BANG THEORY how the earth started.pdf
 
BEHAVIOUR ENTREP 1 - STRATEGIC PLANNING.pdf
BEHAVIOUR ENTREP 1 - STRATEGIC PLANNING.pdfBEHAVIOUR ENTREP 1 - STRATEGIC PLANNING.pdf
BEHAVIOUR ENTREP 1 - STRATEGIC PLANNING.pdf
 

Recently uploaded

SPLICE Working Group: Reusable Code Examples
SPLICE Working Group:Reusable Code ExamplesSPLICE Working Group:Reusable Code Examples
SPLICE Working Group: Reusable Code Examples
Peter Brusilovsky
 
SURVEY I created for uni project research
SURVEY I created for uni project researchSURVEY I created for uni project research
SURVEY I created for uni project research
CaitlinCummins3
 
Transparency, Recognition and the role of eSealing - Ildiko Mazar and Koen No...
Transparency, Recognition and the role of eSealing - Ildiko Mazar and Koen No...Transparency, Recognition and the role of eSealing - Ildiko Mazar and Koen No...
Transparency, Recognition and the role of eSealing - Ildiko Mazar and Koen No...
EADTU
 

Recently uploaded (20)

PSYPACT- Practicing Over State Lines May 2024.pptx
PSYPACT- Practicing Over State Lines May 2024.pptxPSYPACT- Practicing Over State Lines May 2024.pptx
PSYPACT- Practicing Over State Lines May 2024.pptx
 
OS-operating systems- ch05 (CPU Scheduling) ...
OS-operating systems- ch05 (CPU Scheduling) ...OS-operating systems- ch05 (CPU Scheduling) ...
OS-operating systems- ch05 (CPU Scheduling) ...
 
SPLICE Working Group: Reusable Code Examples
SPLICE Working Group:Reusable Code ExamplesSPLICE Working Group:Reusable Code Examples
SPLICE Working Group: Reusable Code Examples
 
Sternal Fractures & Dislocations - EMGuidewire Radiology Reading Room
Sternal Fractures & Dislocations - EMGuidewire Radiology Reading RoomSternal Fractures & Dislocations - EMGuidewire Radiology Reading Room
Sternal Fractures & Dislocations - EMGuidewire Radiology Reading Room
 
Basic Civil Engineering notes on Transportation Engineering & Modes of Transport
Basic Civil Engineering notes on Transportation Engineering & Modes of TransportBasic Civil Engineering notes on Transportation Engineering & Modes of Transport
Basic Civil Engineering notes on Transportation Engineering & Modes of Transport
 
VAMOS CUIDAR DO NOSSO PLANETA! .
VAMOS CUIDAR DO NOSSO PLANETA!                    .VAMOS CUIDAR DO NOSSO PLANETA!                    .
VAMOS CUIDAR DO NOSSO PLANETA! .
 
e-Sealing at EADTU by Kamakshi Rajagopal
e-Sealing at EADTU by Kamakshi Rajagopale-Sealing at EADTU by Kamakshi Rajagopal
e-Sealing at EADTU by Kamakshi Rajagopal
 
TỔNG HỢP HƠN 100 ĐỀ THI THỬ TỐT NGHIỆP THPT TOÁN 2024 - TỪ CÁC TRƯỜNG, TRƯỜNG...
TỔNG HỢP HƠN 100 ĐỀ THI THỬ TỐT NGHIỆP THPT TOÁN 2024 - TỪ CÁC TRƯỜNG, TRƯỜNG...TỔNG HỢP HƠN 100 ĐỀ THI THỬ TỐT NGHIỆP THPT TOÁN 2024 - TỪ CÁC TRƯỜNG, TRƯỜNG...
TỔNG HỢP HƠN 100 ĐỀ THI THỬ TỐT NGHIỆP THPT TOÁN 2024 - TỪ CÁC TRƯỜNG, TRƯỜNG...
 
Scopus Indexed Journals 2024 - ISCOPUS Publications
Scopus Indexed Journals 2024 - ISCOPUS PublicationsScopus Indexed Journals 2024 - ISCOPUS Publications
Scopus Indexed Journals 2024 - ISCOPUS Publications
 
Andreas Schleicher presents at the launch of What does child empowerment mean...
Andreas Schleicher presents at the launch of What does child empowerment mean...Andreas Schleicher presents at the launch of What does child empowerment mean...
Andreas Schleicher presents at the launch of What does child empowerment mean...
 
ANTI PARKISON DRUGS.pptx
ANTI         PARKISON          DRUGS.pptxANTI         PARKISON          DRUGS.pptx
ANTI PARKISON DRUGS.pptx
 
When Quality Assurance Meets Innovation in Higher Education - Report launch w...
When Quality Assurance Meets Innovation in Higher Education - Report launch w...When Quality Assurance Meets Innovation in Higher Education - Report launch w...
When Quality Assurance Meets Innovation in Higher Education - Report launch w...
 
Including Mental Health Support in Project Delivery, 14 May.pdf
Including Mental Health Support in Project Delivery, 14 May.pdfIncluding Mental Health Support in Project Delivery, 14 May.pdf
Including Mental Health Support in Project Delivery, 14 May.pdf
 
How To Create Editable Tree View in Odoo 17
How To Create Editable Tree View in Odoo 17How To Create Editable Tree View in Odoo 17
How To Create Editable Tree View in Odoo 17
 
SURVEY I created for uni project research
SURVEY I created for uni project researchSURVEY I created for uni project research
SURVEY I created for uni project research
 
TỔNG HỢP HƠN 100 ĐỀ THI THỬ TỐT NGHIỆP THPT TOÁN 2024 - TỪ CÁC TRƯỜNG, TRƯỜNG...
TỔNG HỢP HƠN 100 ĐỀ THI THỬ TỐT NGHIỆP THPT TOÁN 2024 - TỪ CÁC TRƯỜNG, TRƯỜNG...TỔNG HỢP HƠN 100 ĐỀ THI THỬ TỐT NGHIỆP THPT TOÁN 2024 - TỪ CÁC TRƯỜNG, TRƯỜNG...
TỔNG HỢP HƠN 100 ĐỀ THI THỬ TỐT NGHIỆP THPT TOÁN 2024 - TỪ CÁC TRƯỜNG, TRƯỜNG...
 
The Liver & Gallbladder (Anatomy & Physiology).pptx
The Liver &  Gallbladder (Anatomy & Physiology).pptxThe Liver &  Gallbladder (Anatomy & Physiology).pptx
The Liver & Gallbladder (Anatomy & Physiology).pptx
 
Transparency, Recognition and the role of eSealing - Ildiko Mazar and Koen No...
Transparency, Recognition and the role of eSealing - Ildiko Mazar and Koen No...Transparency, Recognition and the role of eSealing - Ildiko Mazar and Koen No...
Transparency, Recognition and the role of eSealing - Ildiko Mazar and Koen No...
 
An overview of the various scriptures in Hinduism
An overview of the various scriptures in HinduismAn overview of the various scriptures in Hinduism
An overview of the various scriptures in Hinduism
 
How to Manage Website in Odoo 17 Studio App.pptx
How to Manage Website in Odoo 17 Studio App.pptxHow to Manage Website in Odoo 17 Studio App.pptx
How to Manage Website in Odoo 17 Studio App.pptx
 

spss-anintroduction-150704135929-lva1-app6892.ppt

  • 2. What is SPSS? Originally it is an acronym “Statistical Package for the Social Sciences” but now it stands for Statistical Product and Service Solutions It is also known by the name PASW (Predictive Analytics Software) It is a software used for data analysis in business research. Can be used for: o Processing Questionnaires o Reporting in Tables and Graphs o Analyzing: Means, Chi-square, Regression, …and much more..
  • 3. History SPSS has a long heritage  Introduced in 1968.  Was originally developed to facilitate statistical analysis in the social sciences.  Early versions designed to run on mainframe computers.  On July 28, 2009 IBM announced it was acquiring SPSS Inc. for $ 1.2 billion in cash  The current versions (2015) are officially named IBM SPSS Statistics.
  • 4. About SPSS Incorporated  SPSS Inc. is a leading worldwide provider of predictive analytics software and solutions.  SPSS Inc. was a software house headquartered in Chicago and incorporated in Delaware  The company was started in 1968 by Norman Nie, Dale Bent, and Hadlai "Tex" Hull  Today SPSS has more than 250,000 customers worldwide, served by more than 1,200 employees in 60 countries.
  • 5. Now the company is known as SPSS: An IBM® Company :
  • 6. General Capabilities SPSS has a lot of great features  Can import data from many different sources, such as Microsoft® Excel and SAS®.  Provides analysis tools to generate reports, charts, plots, descriptive statistics, and run advanced statistical analyses.  In addition to user interface, provides a command syntax that can simplify certain things, such as running repetitive tasks.
  • 7. Basic Operations in SPSS (Basic Steps In Data Analysis)  Variable Entry (adding or deleting a variable)  Data Entry (adding or deleting the data)  Saving the data  Importing data from Excel file  Checking the data entered  Sorting the data  Transforming the data 7
  • 8. Variables  A concept which can take on different quantitative values is called a variable.  Ex. What are variables you would consider in buying a second hand bike?  Brand  Type  Age  Condition (Excellent, good, poor)  Price 8
  • 9.  Dichotomous variables (having two values only)  Yes or No  Male or Female  Income, age or a test score are the examples of continuous variables.  These variables may take on any value within a given range, or in some cases, an infinite set. 9
  • 10. Measurement Scales  The process of assigning numbers to objects in such a way that specific properties of the objects are faithfully represented by specific properties of the numbers.  Types of Scales:  Nominal  Ordinal  Scale  Interval  Ratio 10
  • 11. Types of Scales  Nominal  example: nationality, race, gender…  based on a concept (two categories variable called “dichotomous nominal”)  Ordinal  example: knowledge, skill... (more than, equal, less than)  rank-ordered in terms of a criterion from highest to lowest  Interval/Ratio  example: age, income, speed...  based on arithmetic qualities and have a fixed zero point
  • 12. 7 3 8 Nominal Numbers Assigned to Runners Ordinal Rank Order of Winners Interval Performance Rating on a Scale Ratio Time to Finish in Seconds Third place Second place First place Finish Finish 8.2 9.1 9.6 15.2 14.1 13.4 Scale
  • 13. Scale Basic Characteristics Common Examples Nominal Numbers identify & classify objects Gender, numbering of football players Percentages, mode Chi-square, binomial test Ordinal Nos. indicate the relative positions of objects but not the magnitude of differences between them Quality rankings, rankings of teams in a tournament Percentile, median Rank-order correlation, Friedman ANOVA Ratio Zero point is fixed, ratios of scale values can be compared Length, weight Geometric mean, harmonic mean Coefficient of variation Permissible Statistics Descriptive Inferential Interval Differences between objects Temperature (Fahrenheit) Range, mean, standard Product- moment Primary Scales
  • 15. TYPES OF WINDOWS Data view Variable View Output Viewer Pivot Table Editor Chart Editor Text Output Editor Syntax Editor
  • 16. Data Editor (.sav files)  The Data Editor lets you see and manipulate your data. You will always have at least one Data Editor open (even if you have not yet opened a data set). When you open an SPSS data file, what you see is a working copy of your data. Changes you make to your data are not permanent until you save them (click File - Save or Save As). Data files are saved with a file type of .sav, a file type that most other software cannot work with
  • 17. Data Viewer Entering Editing Displaying DATA No. of Respondents/Questionnaires/Schedules
  • 19. VARIABLE VIEW  In the Variable View you can see and edit the information that defines each variable (sometimes called meta-data) in your data set: each column of the Data View is described by a row of the Variable View.
  • 21.
  • 22.
  • 23. 1. Opens automatically if it runs a procedure 2. Displays Statistical results, Graphs and save it for future use. Outline Pane Navigate output Highlight output Pivot table editor Text output edit Chart Editor
  • 27. Manually Entering Data SPSS makes it easy.  Start with the Data Editor.  There are two tabs at the bottom:  Data View  Variable View  Gives you two ways to enter data:  Start with Data View and just start typing!  Start with Variable View and define your variables first.  Think of variables as labels that describe your data.