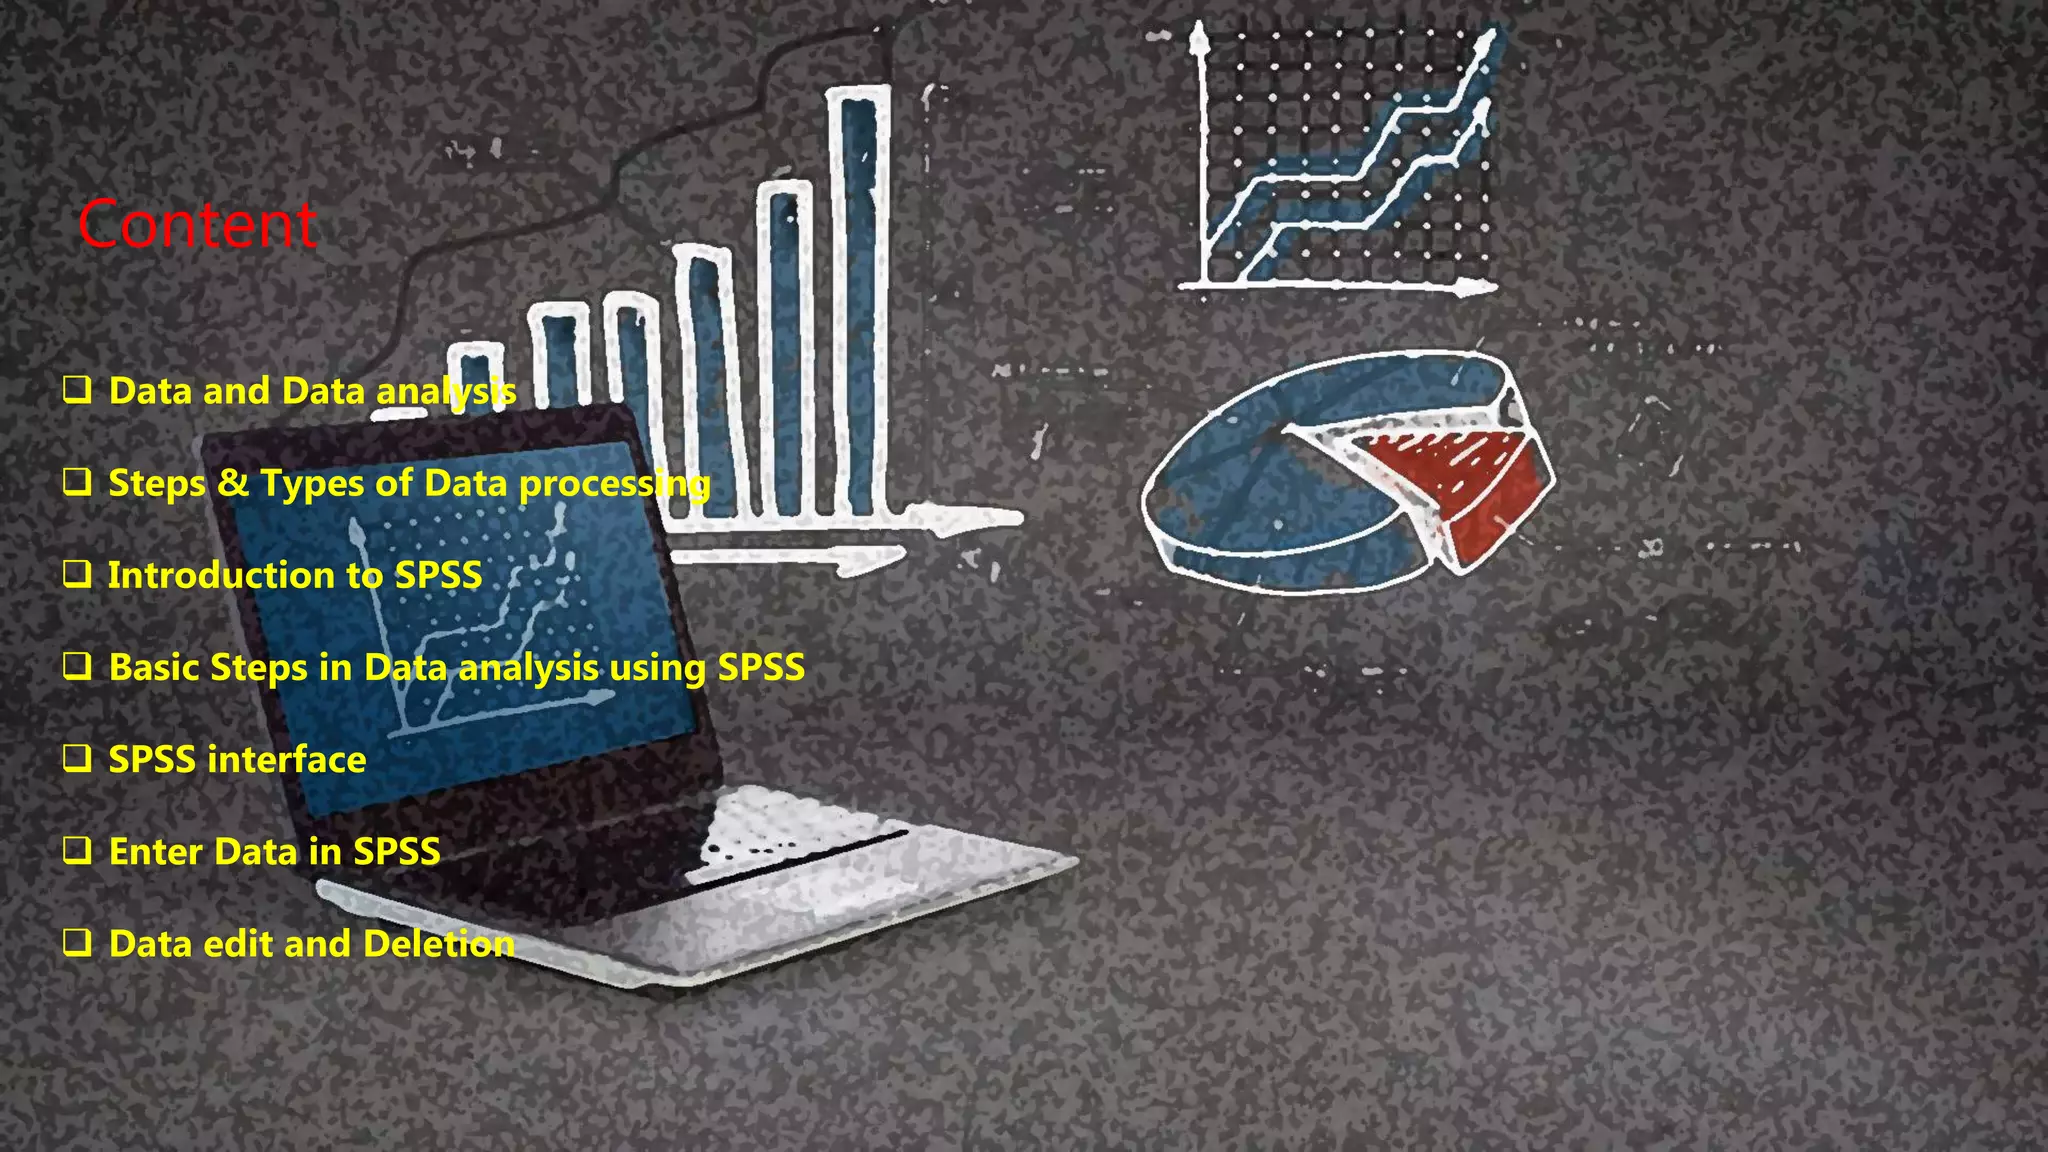
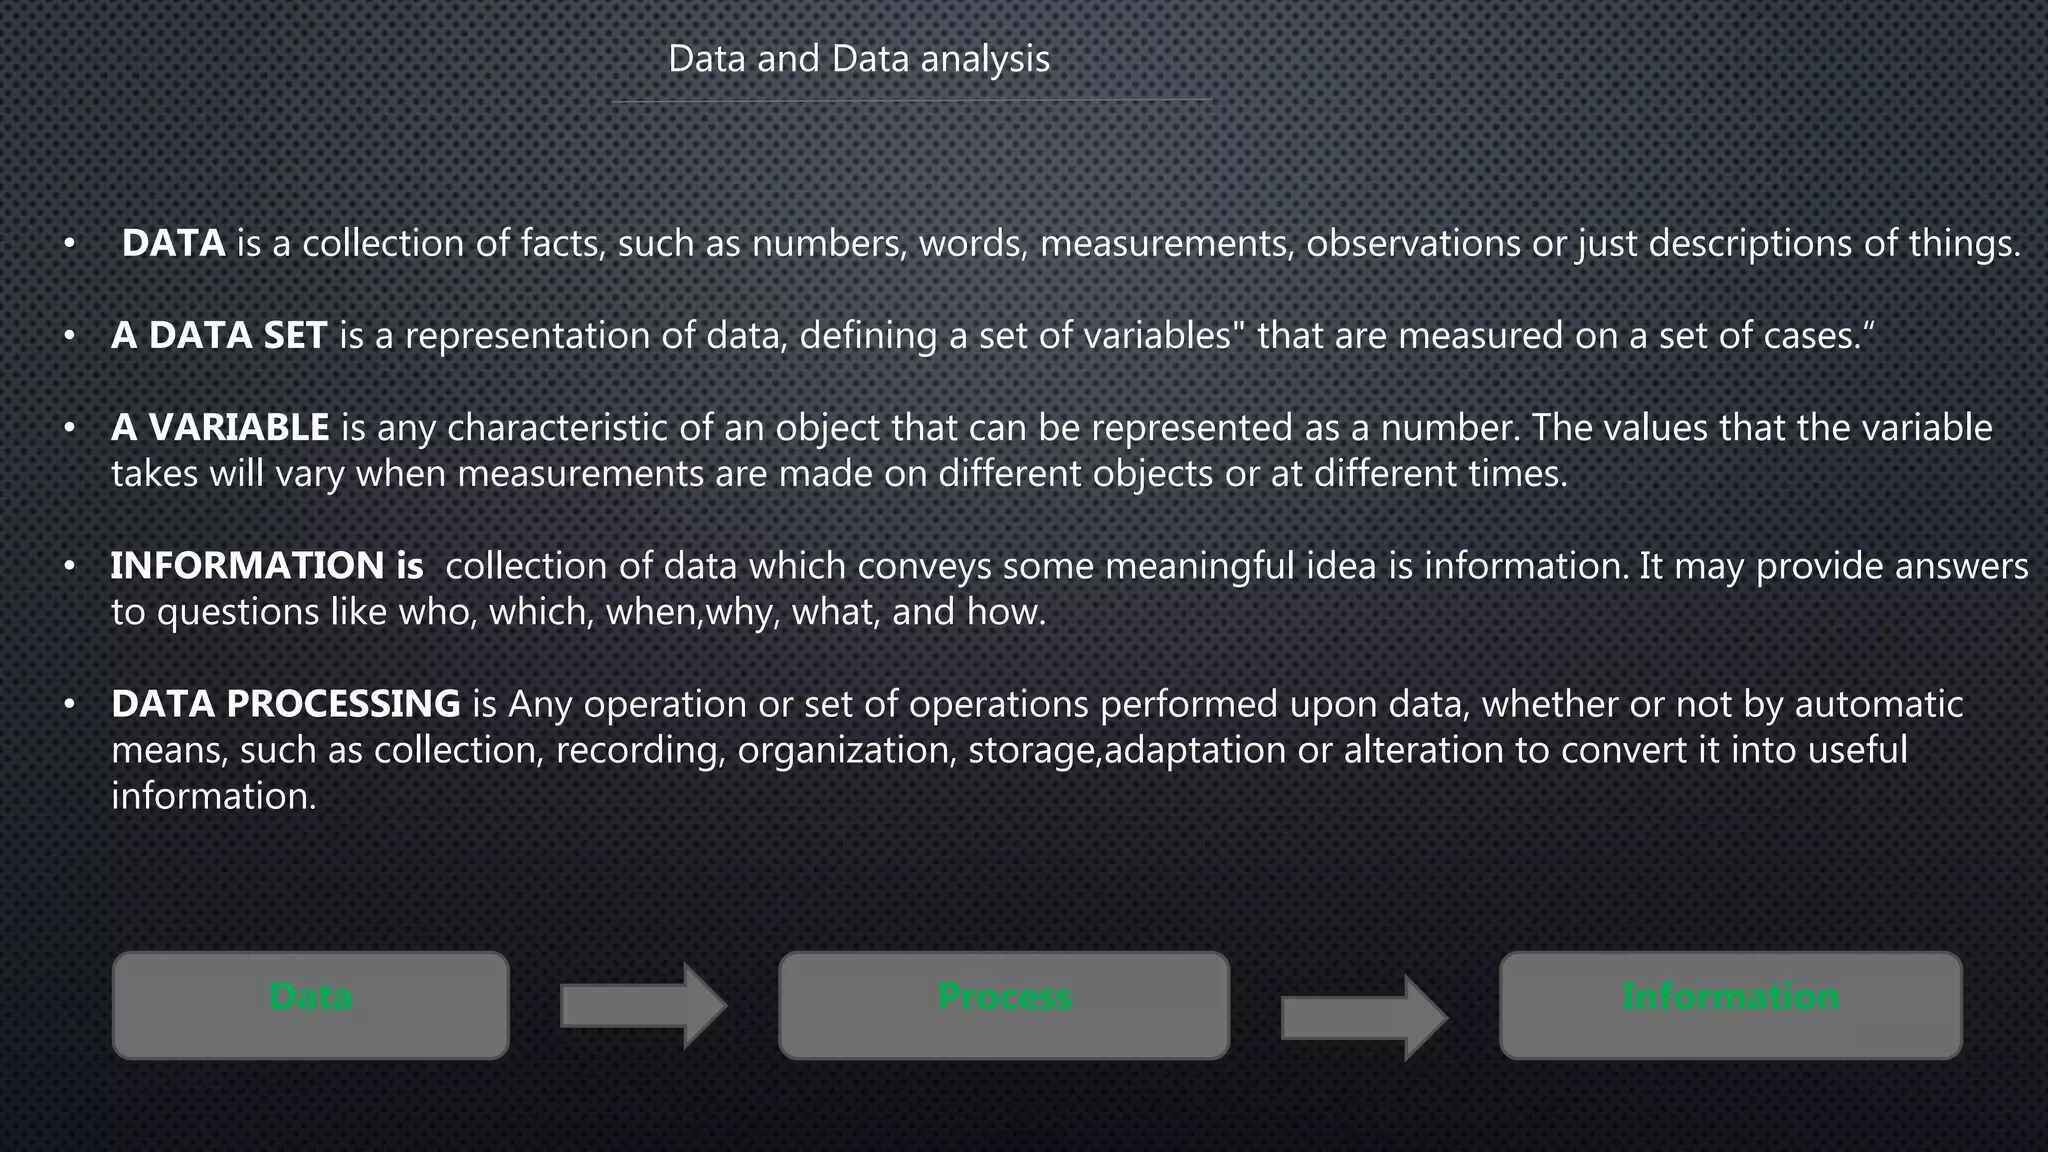
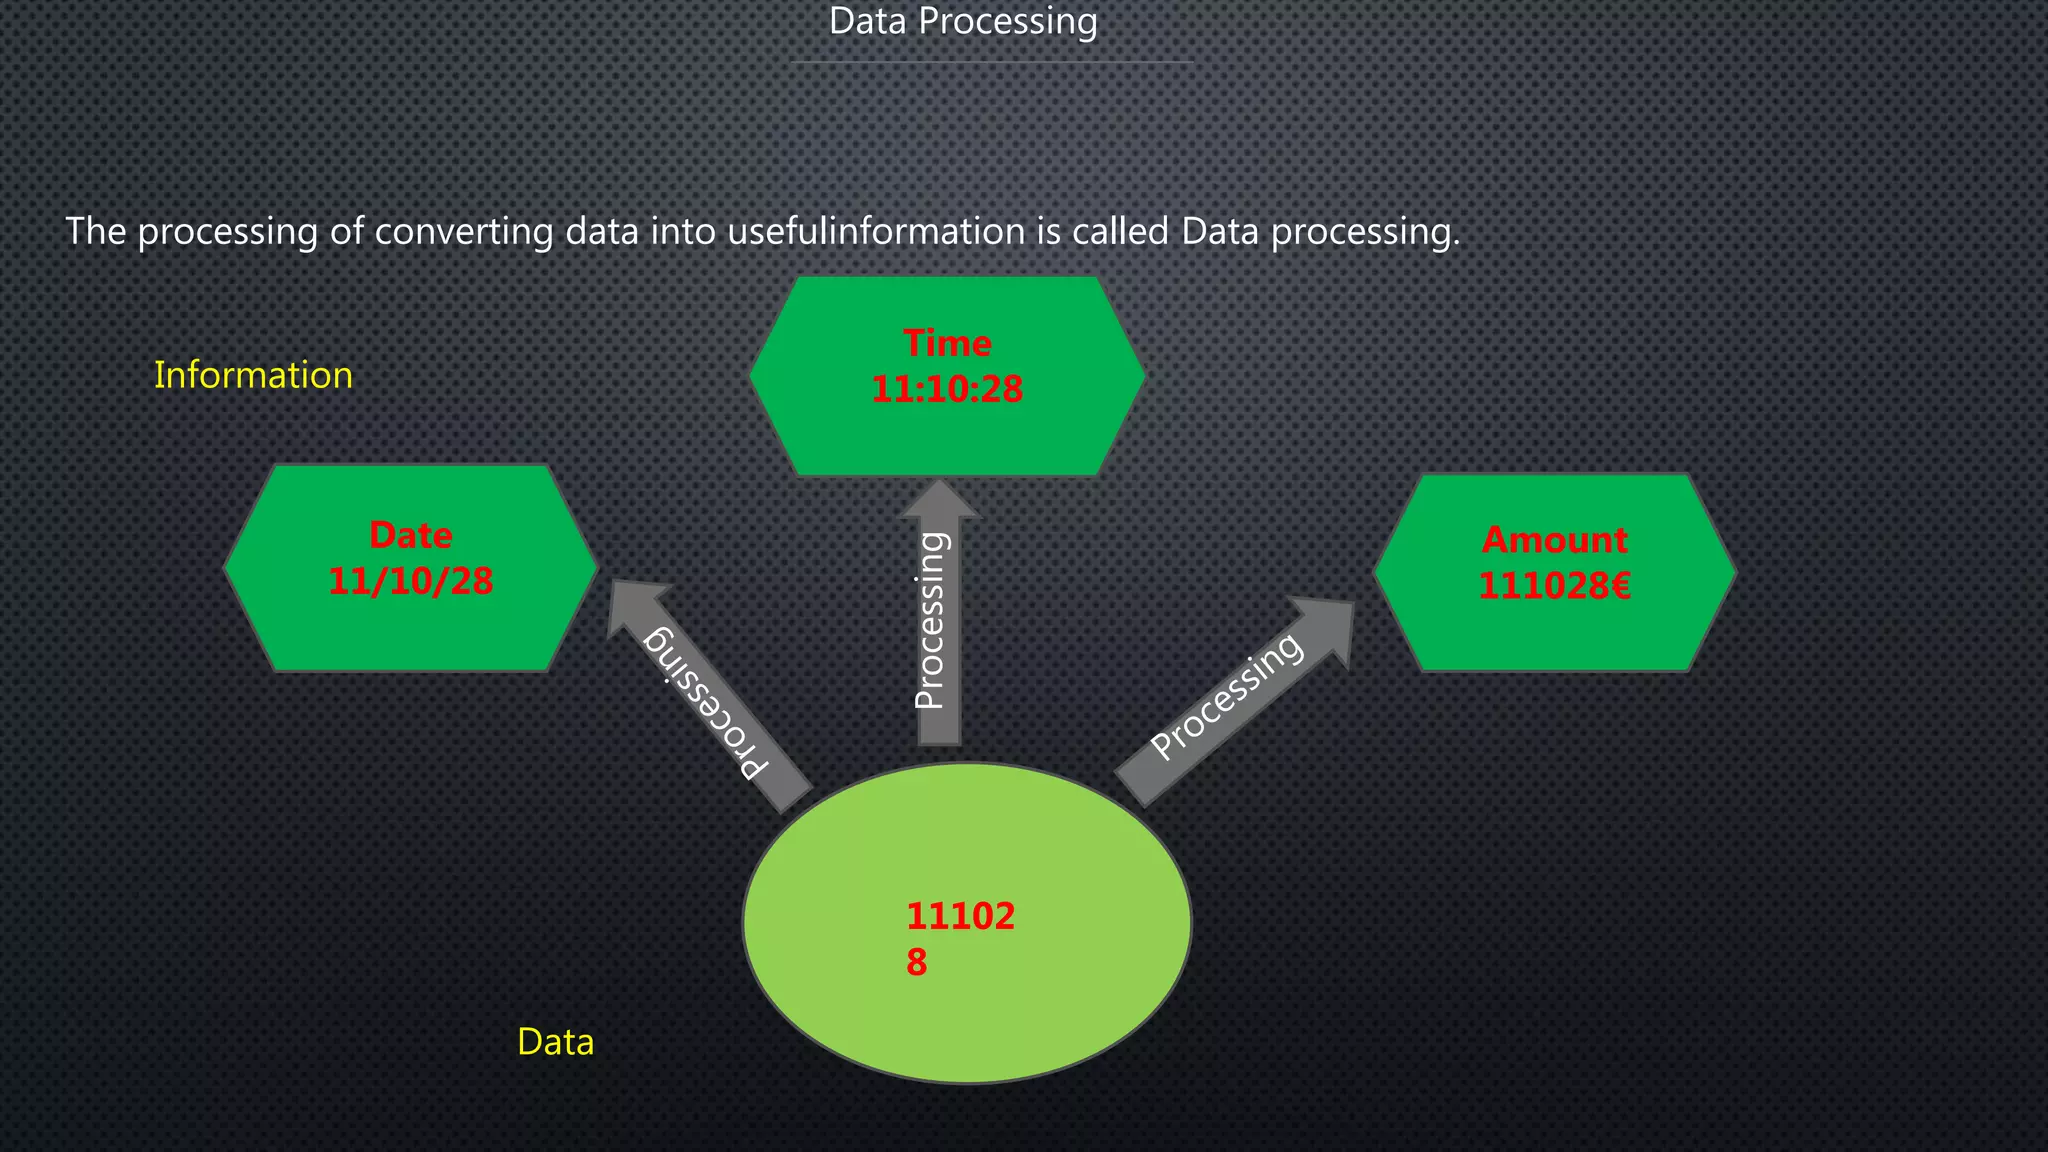
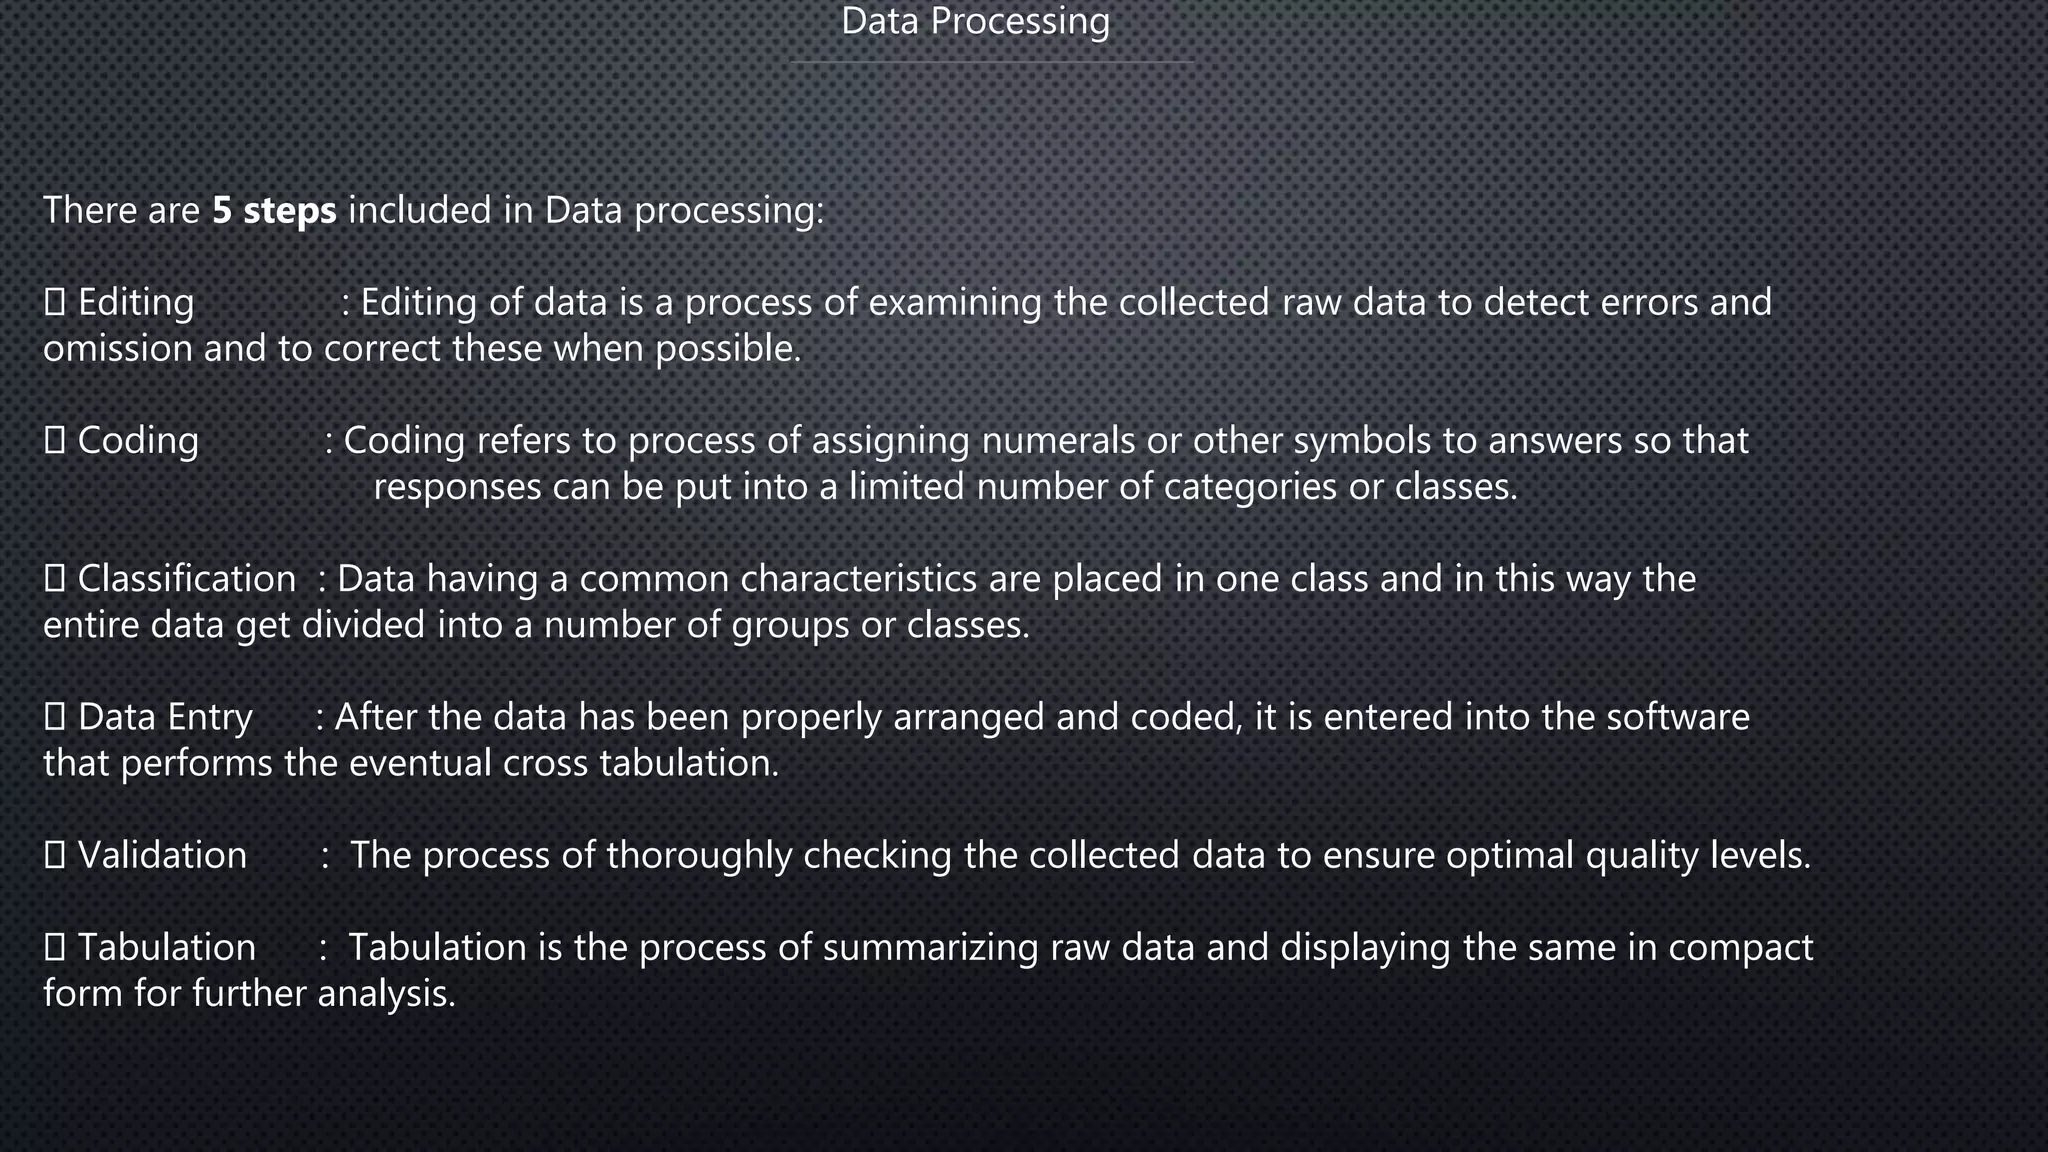
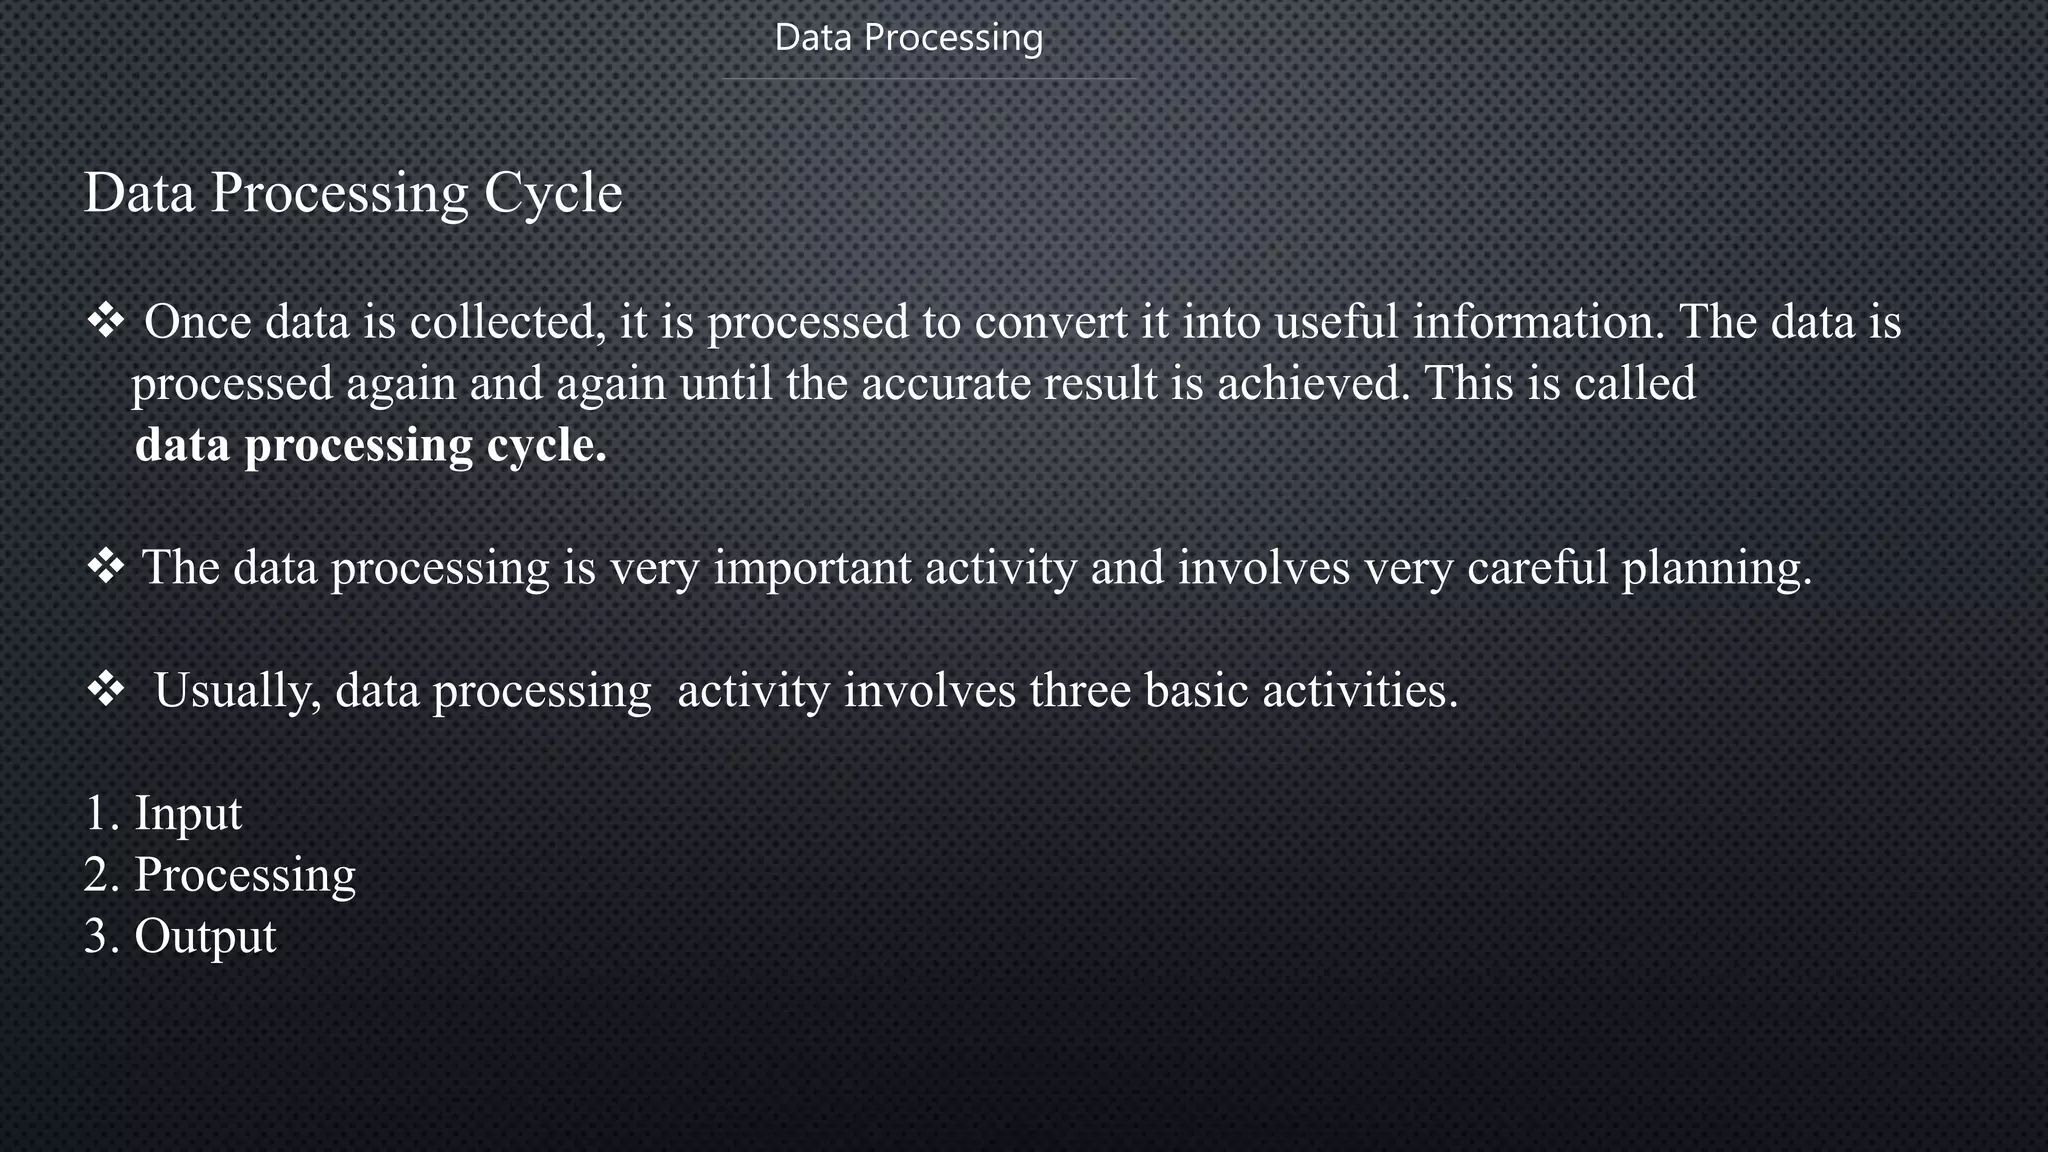
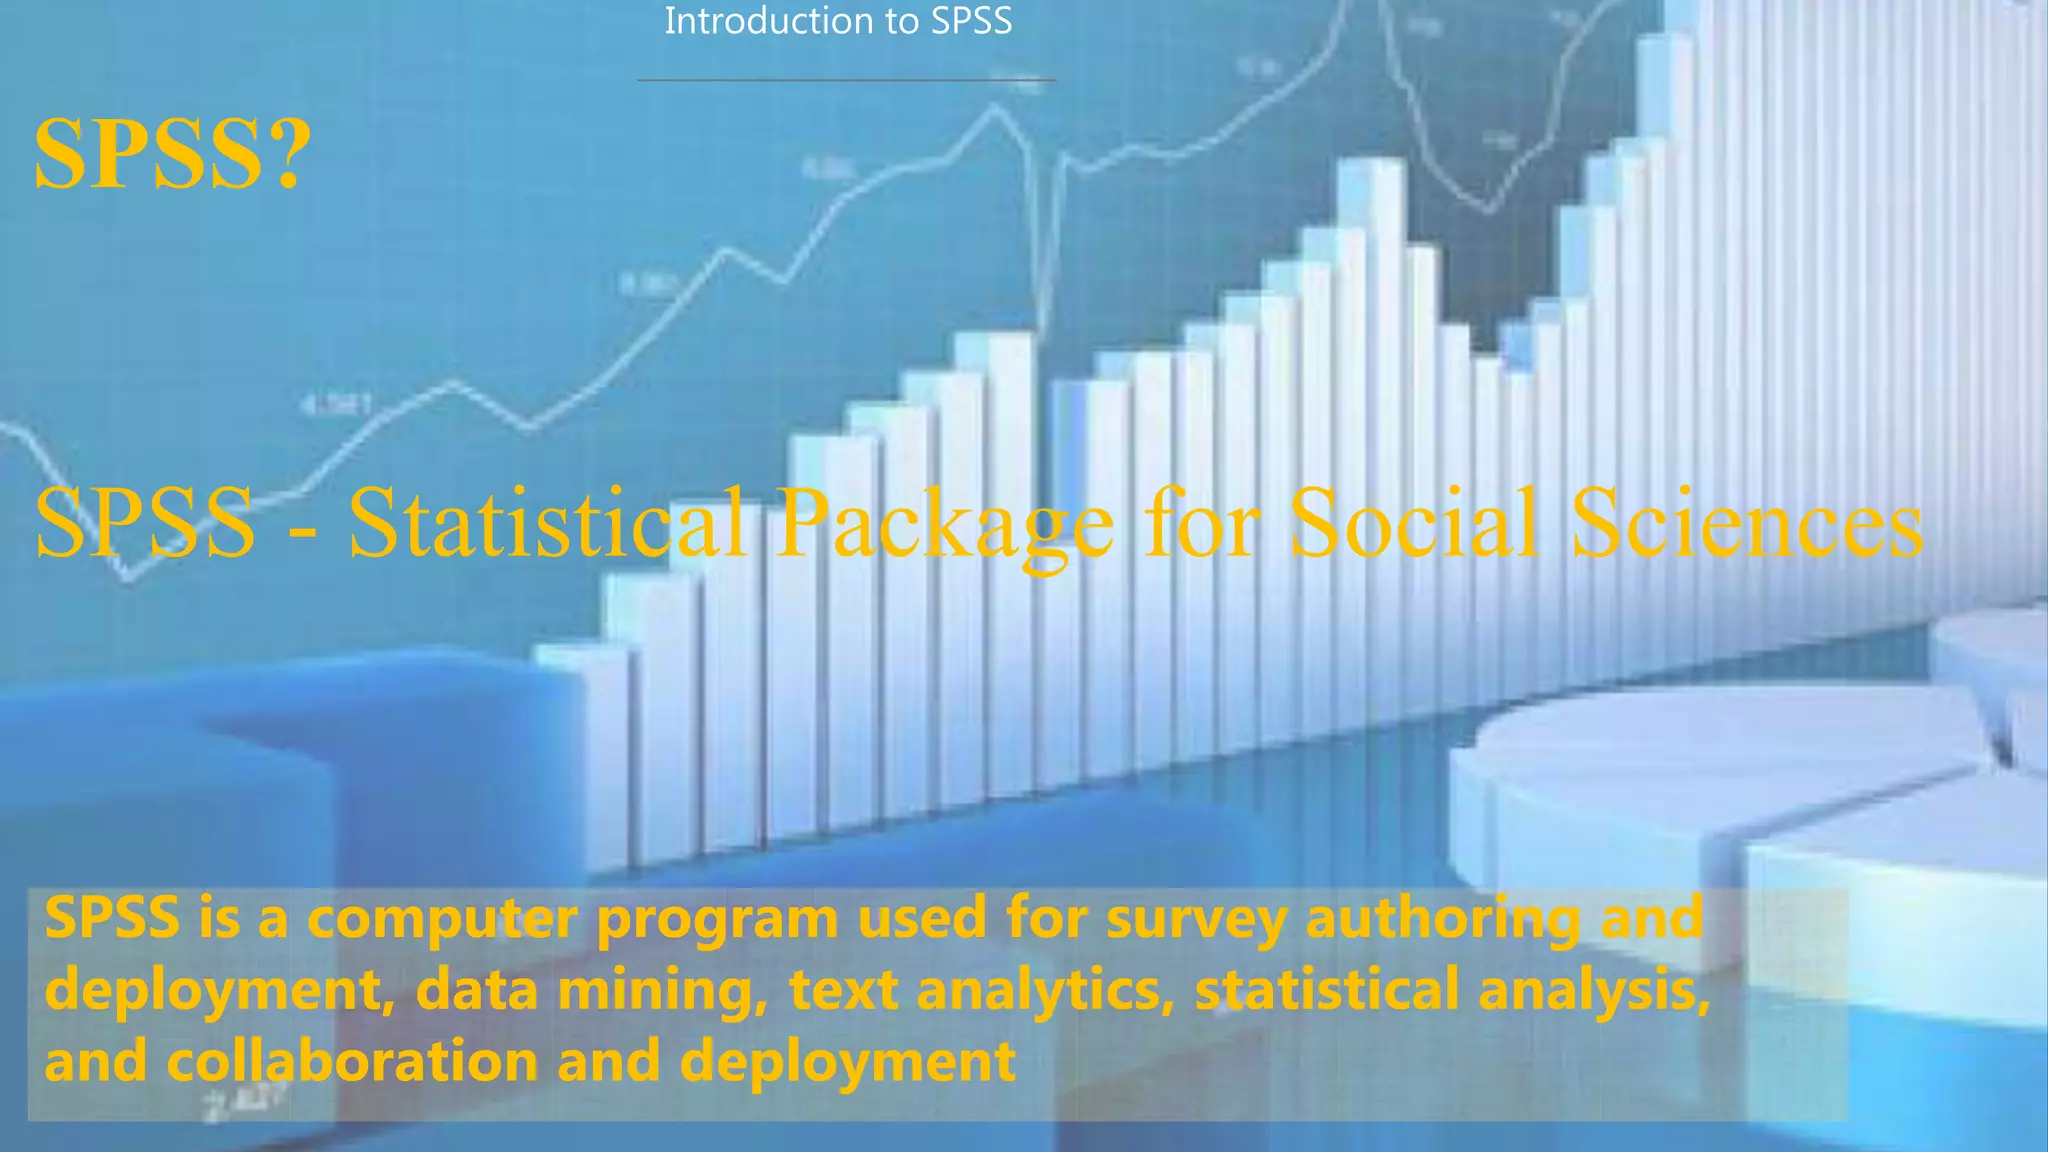
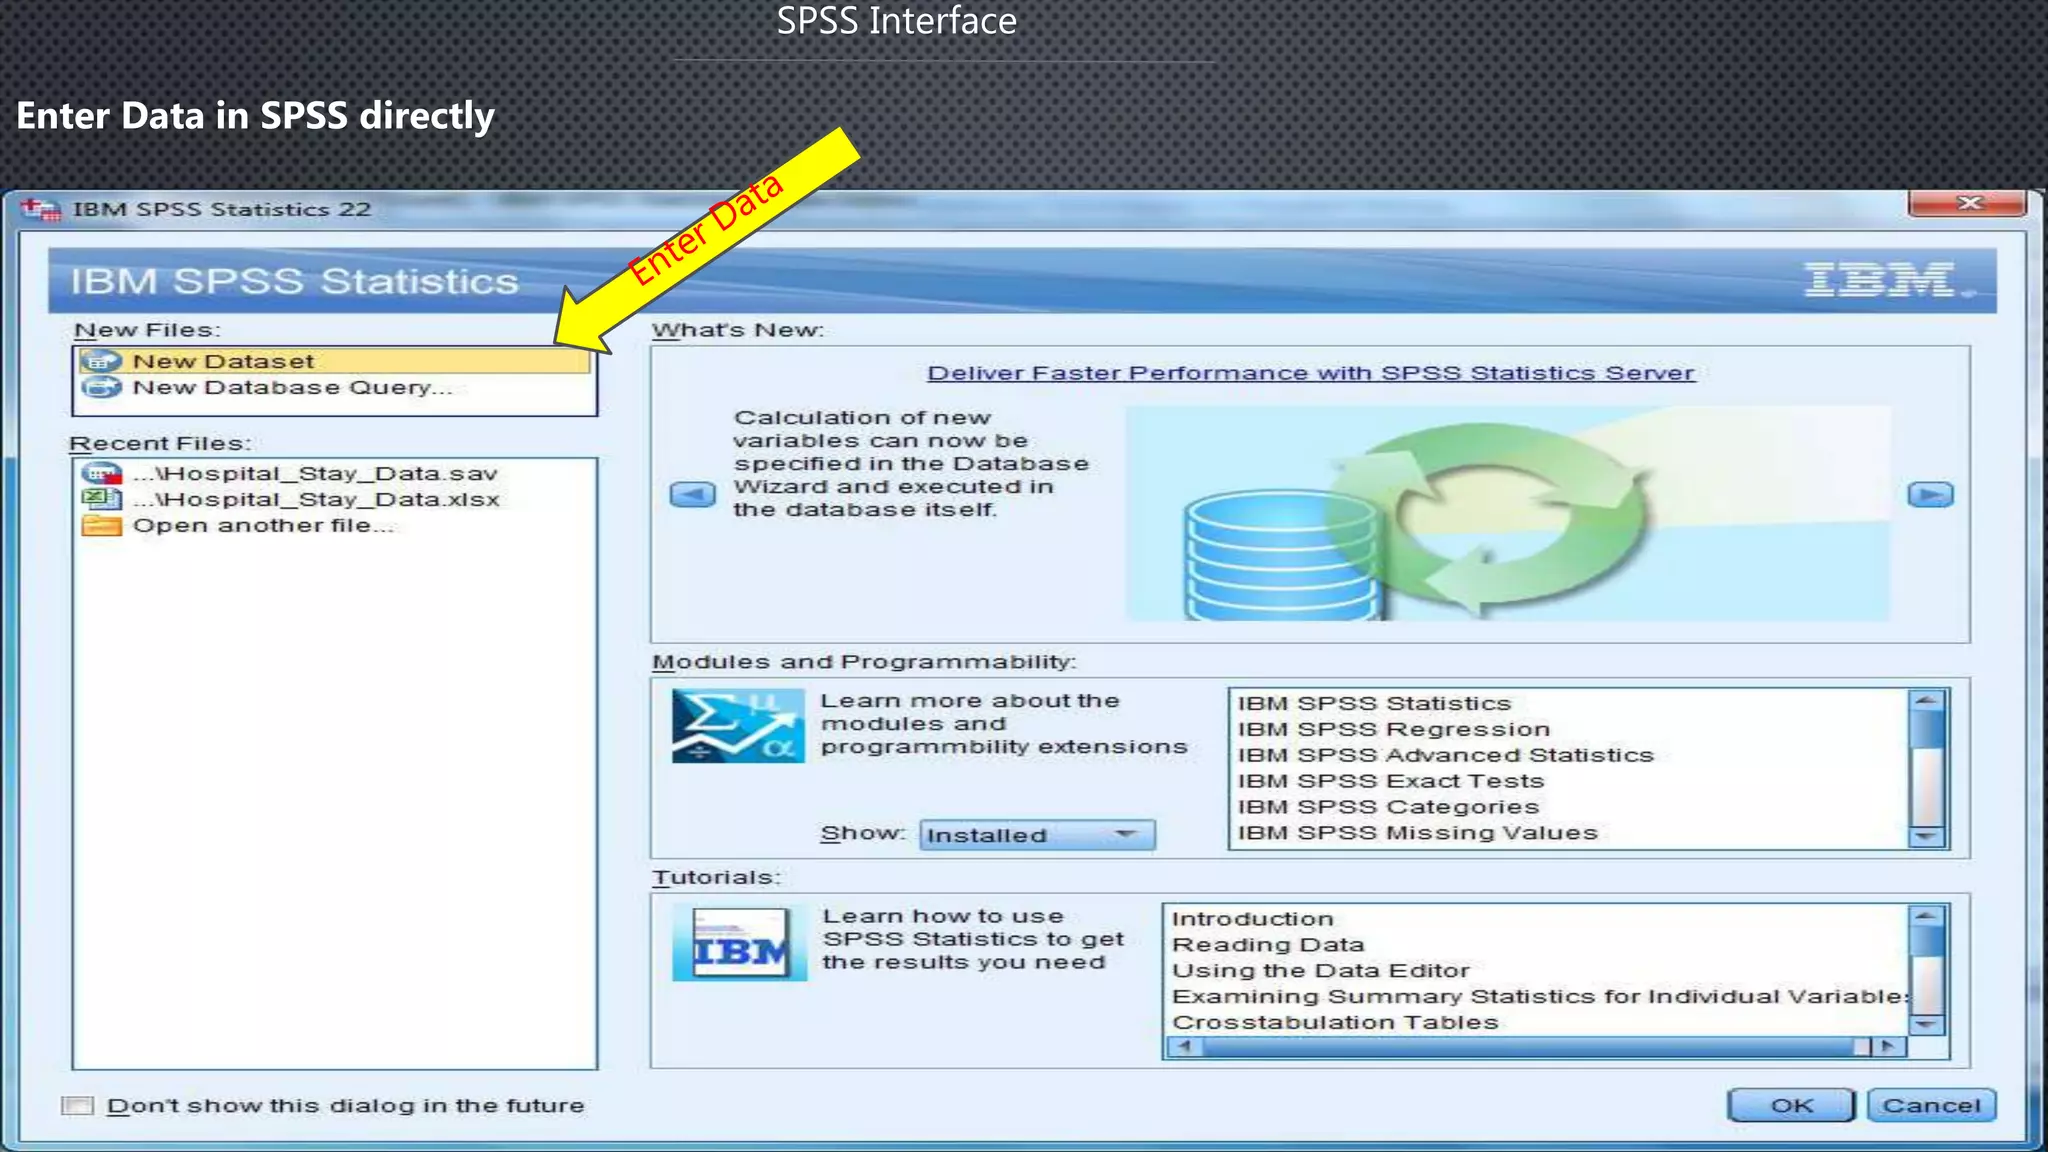
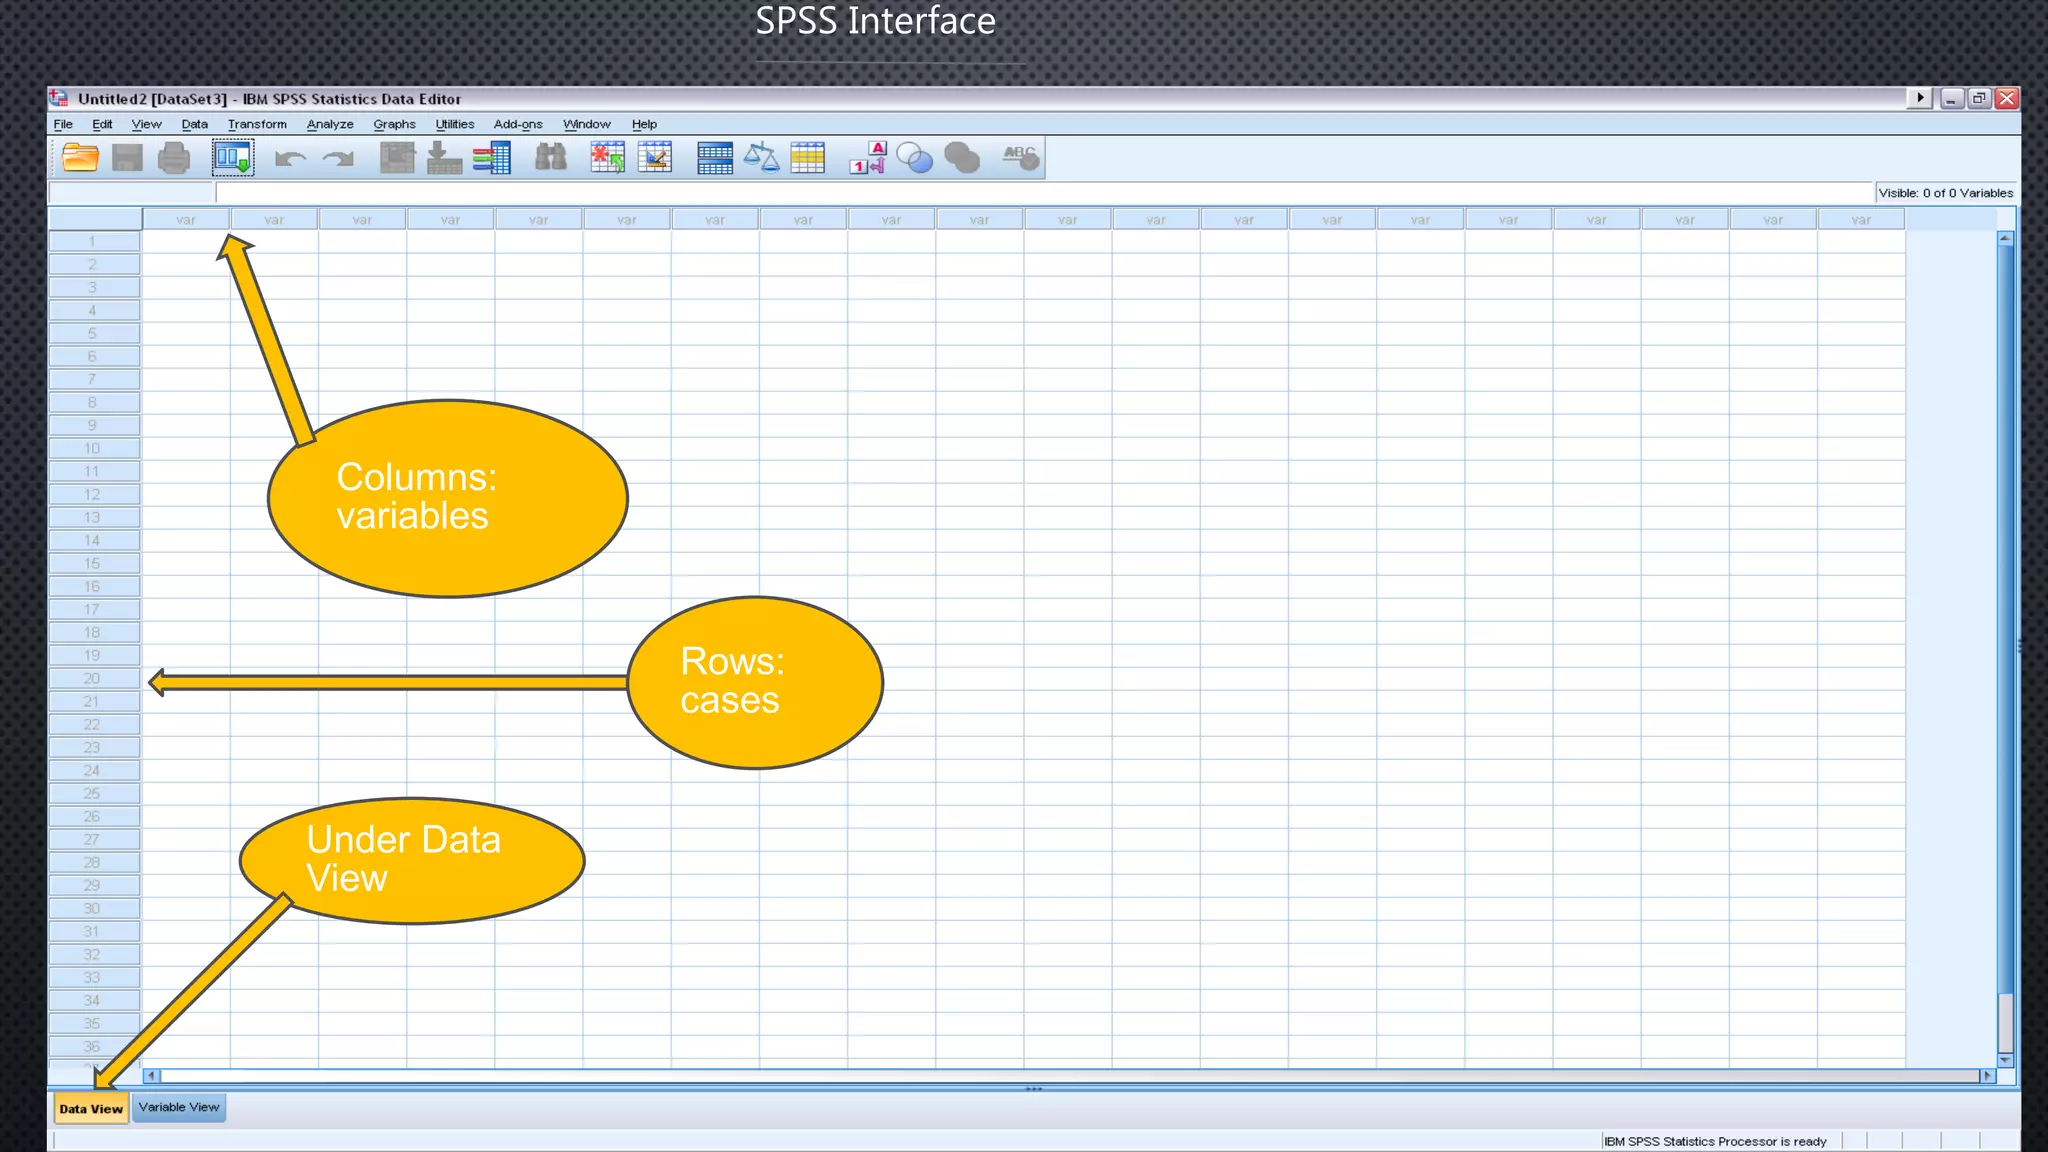
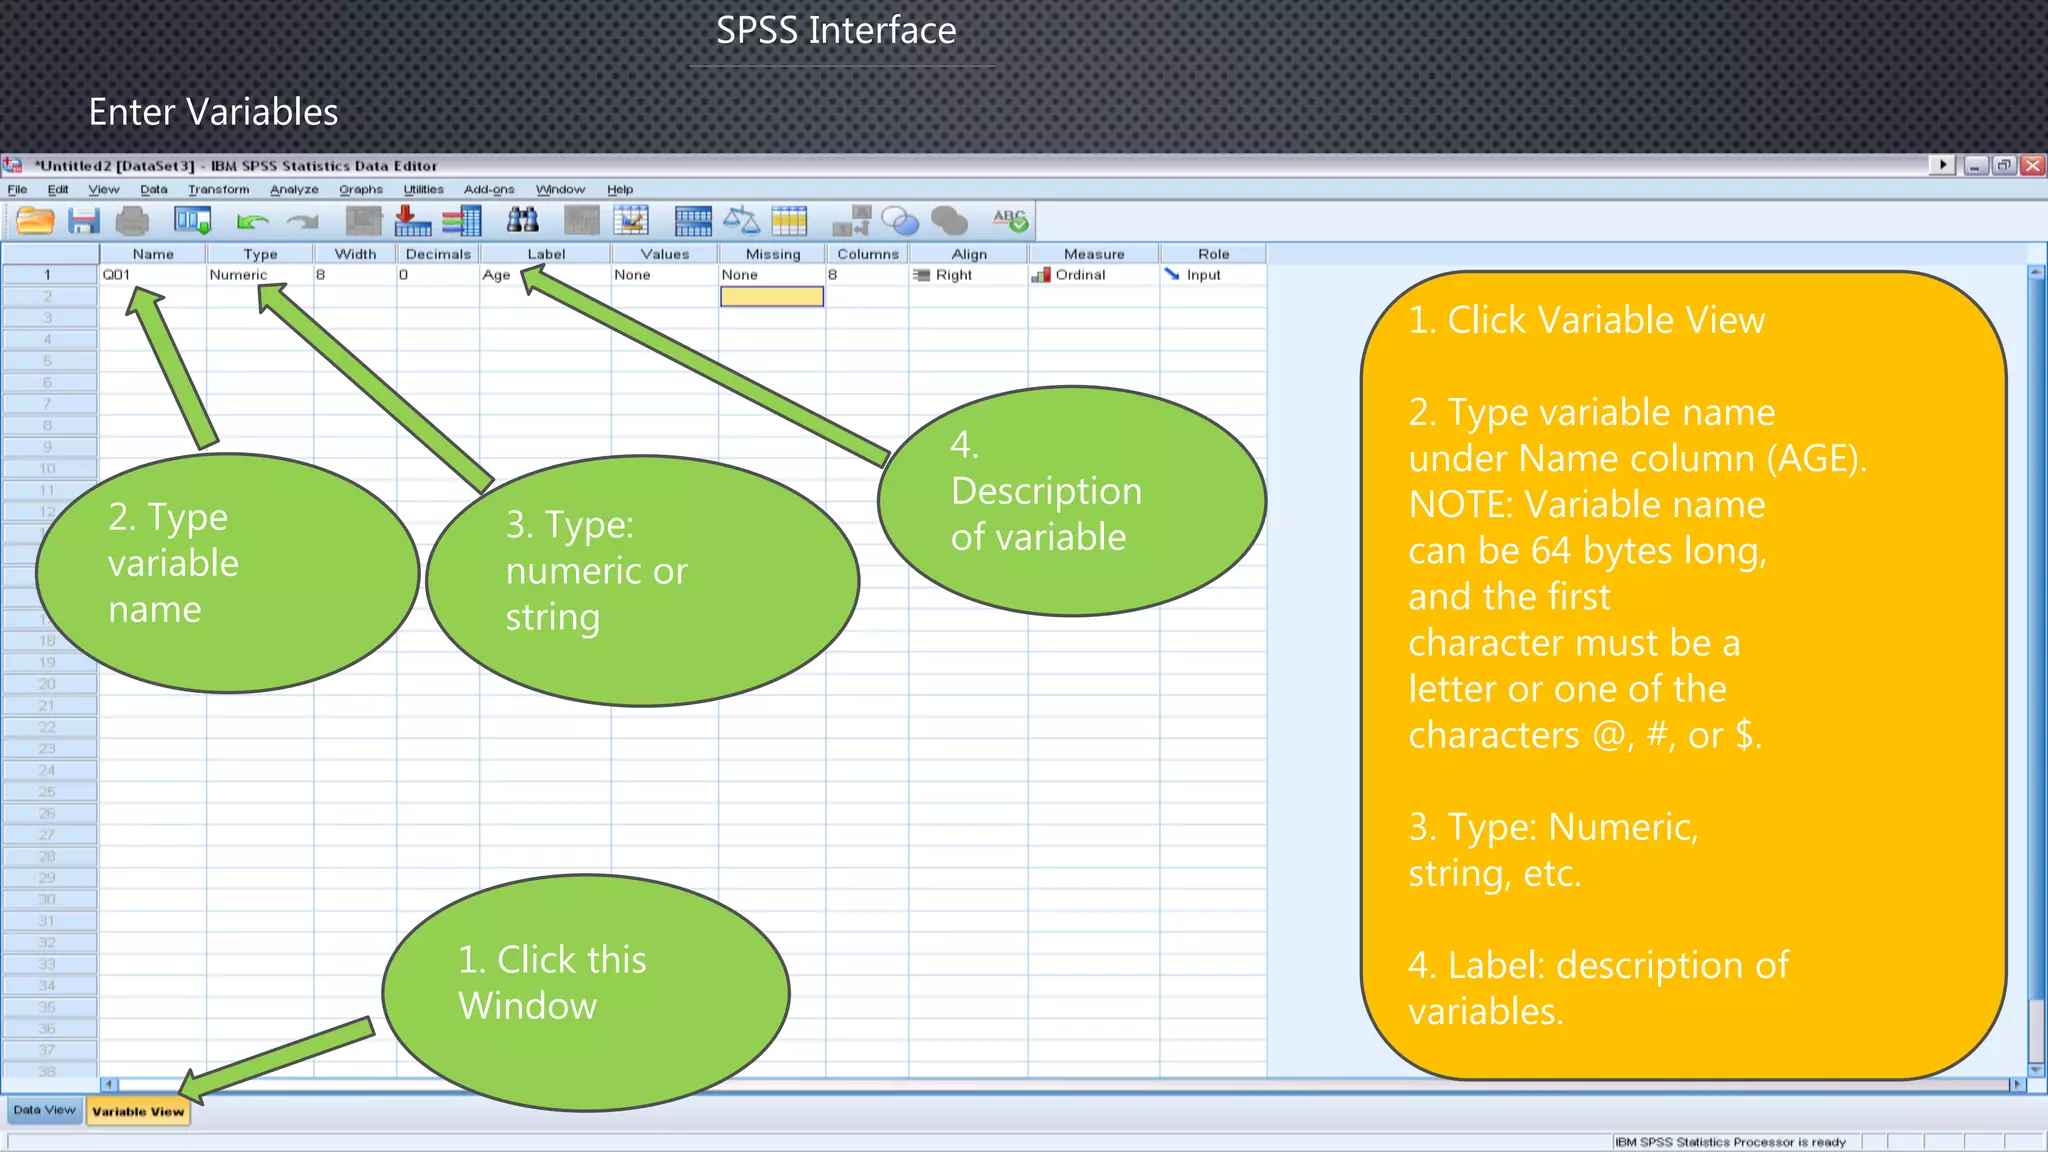
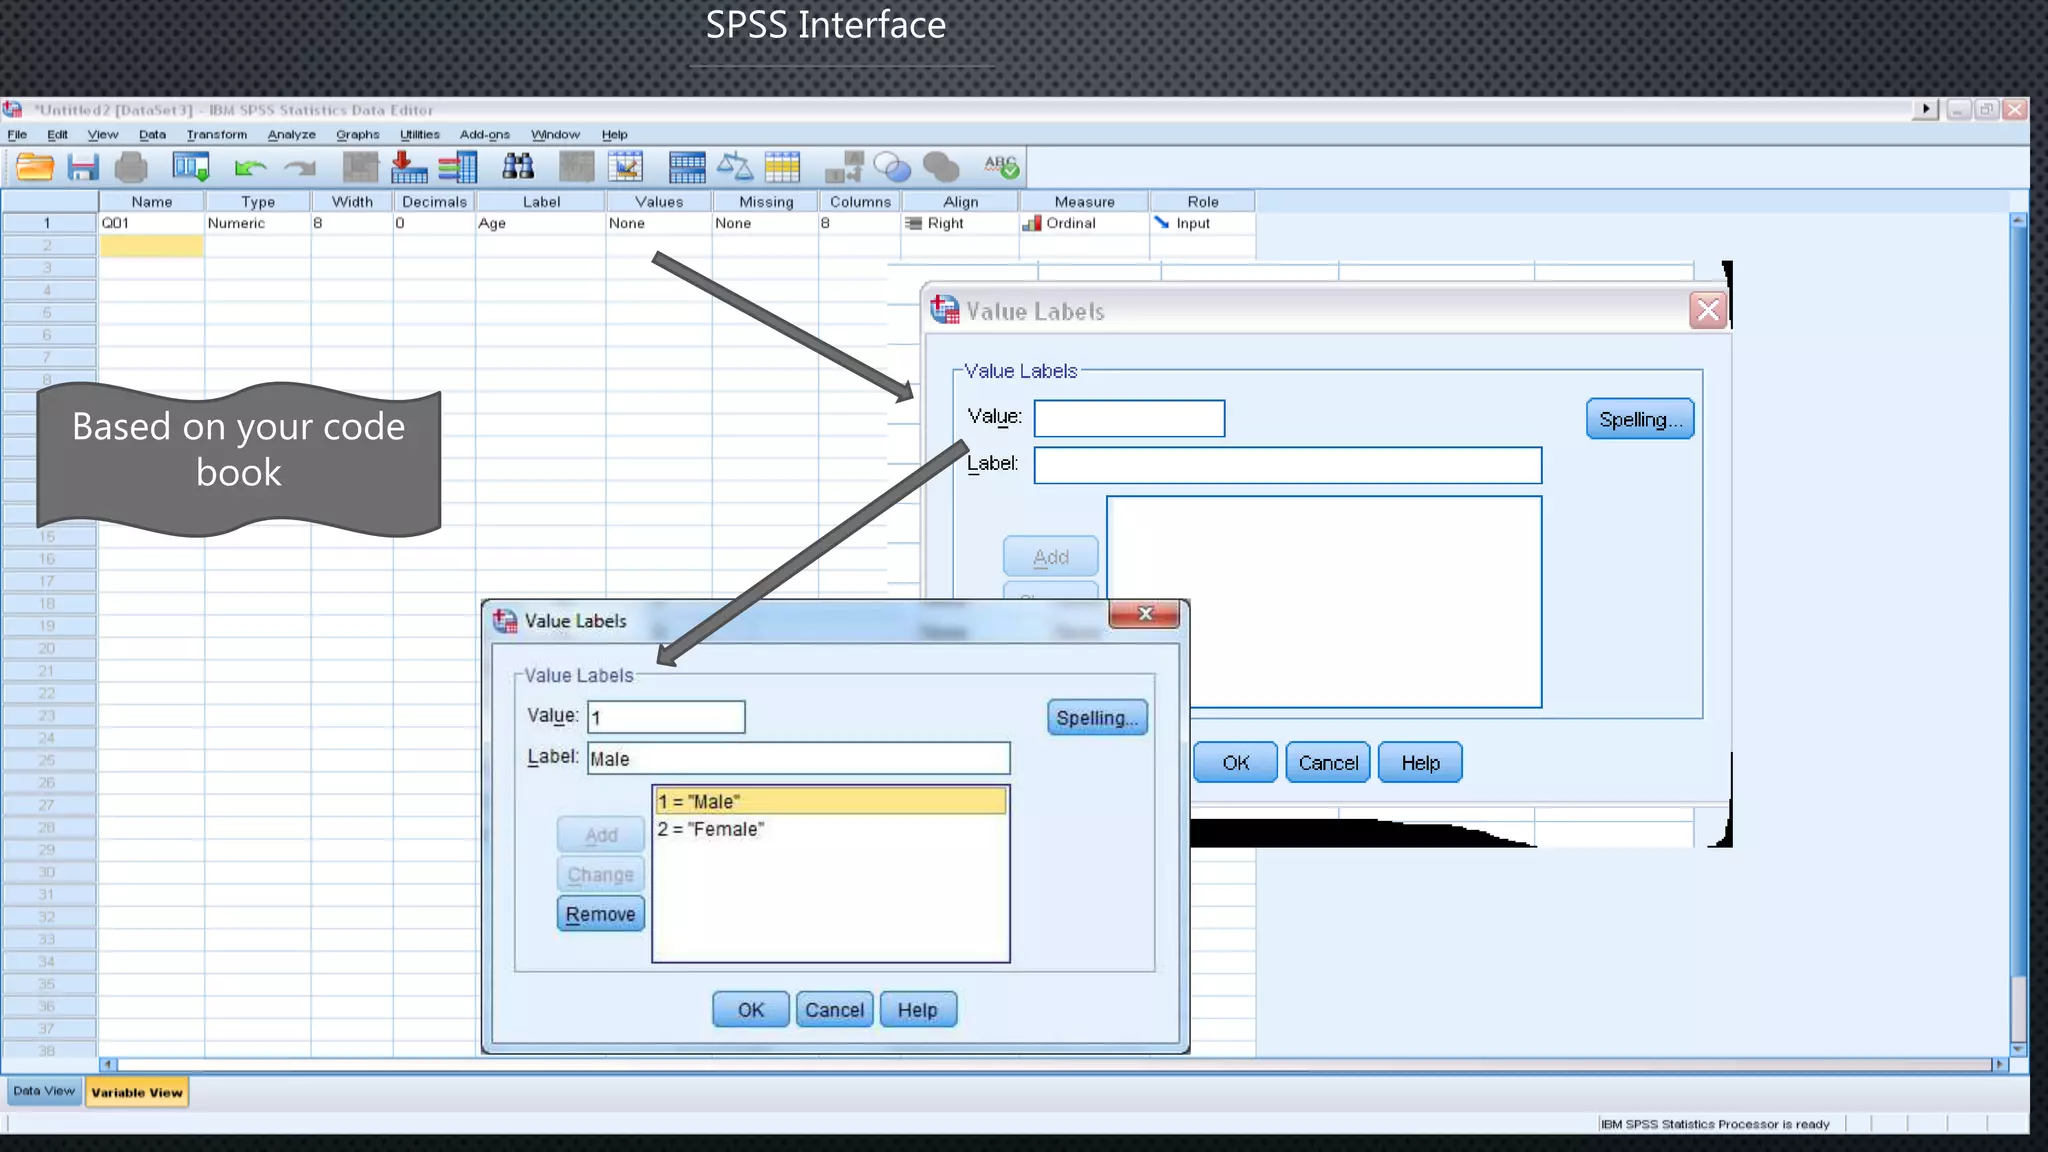
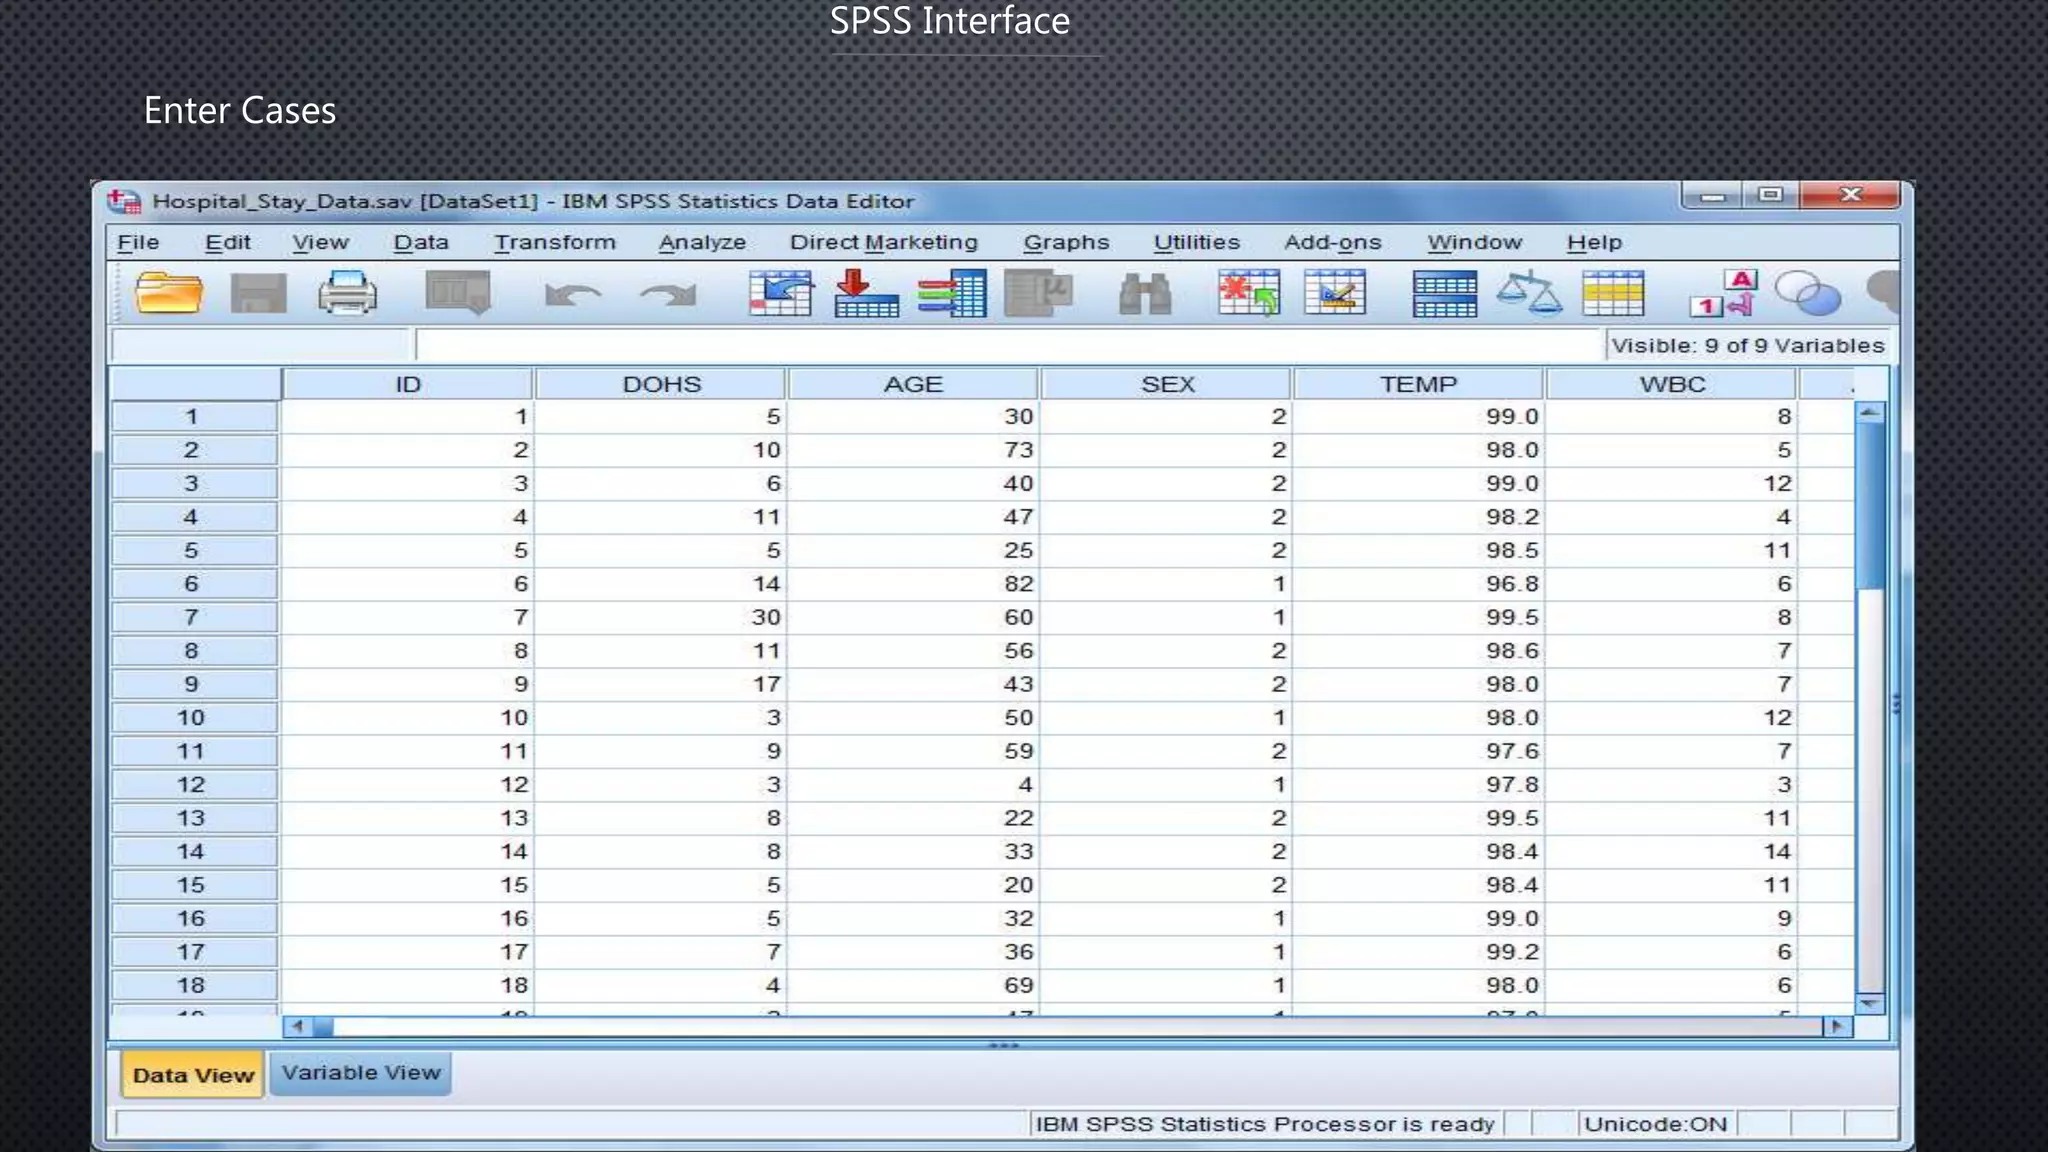
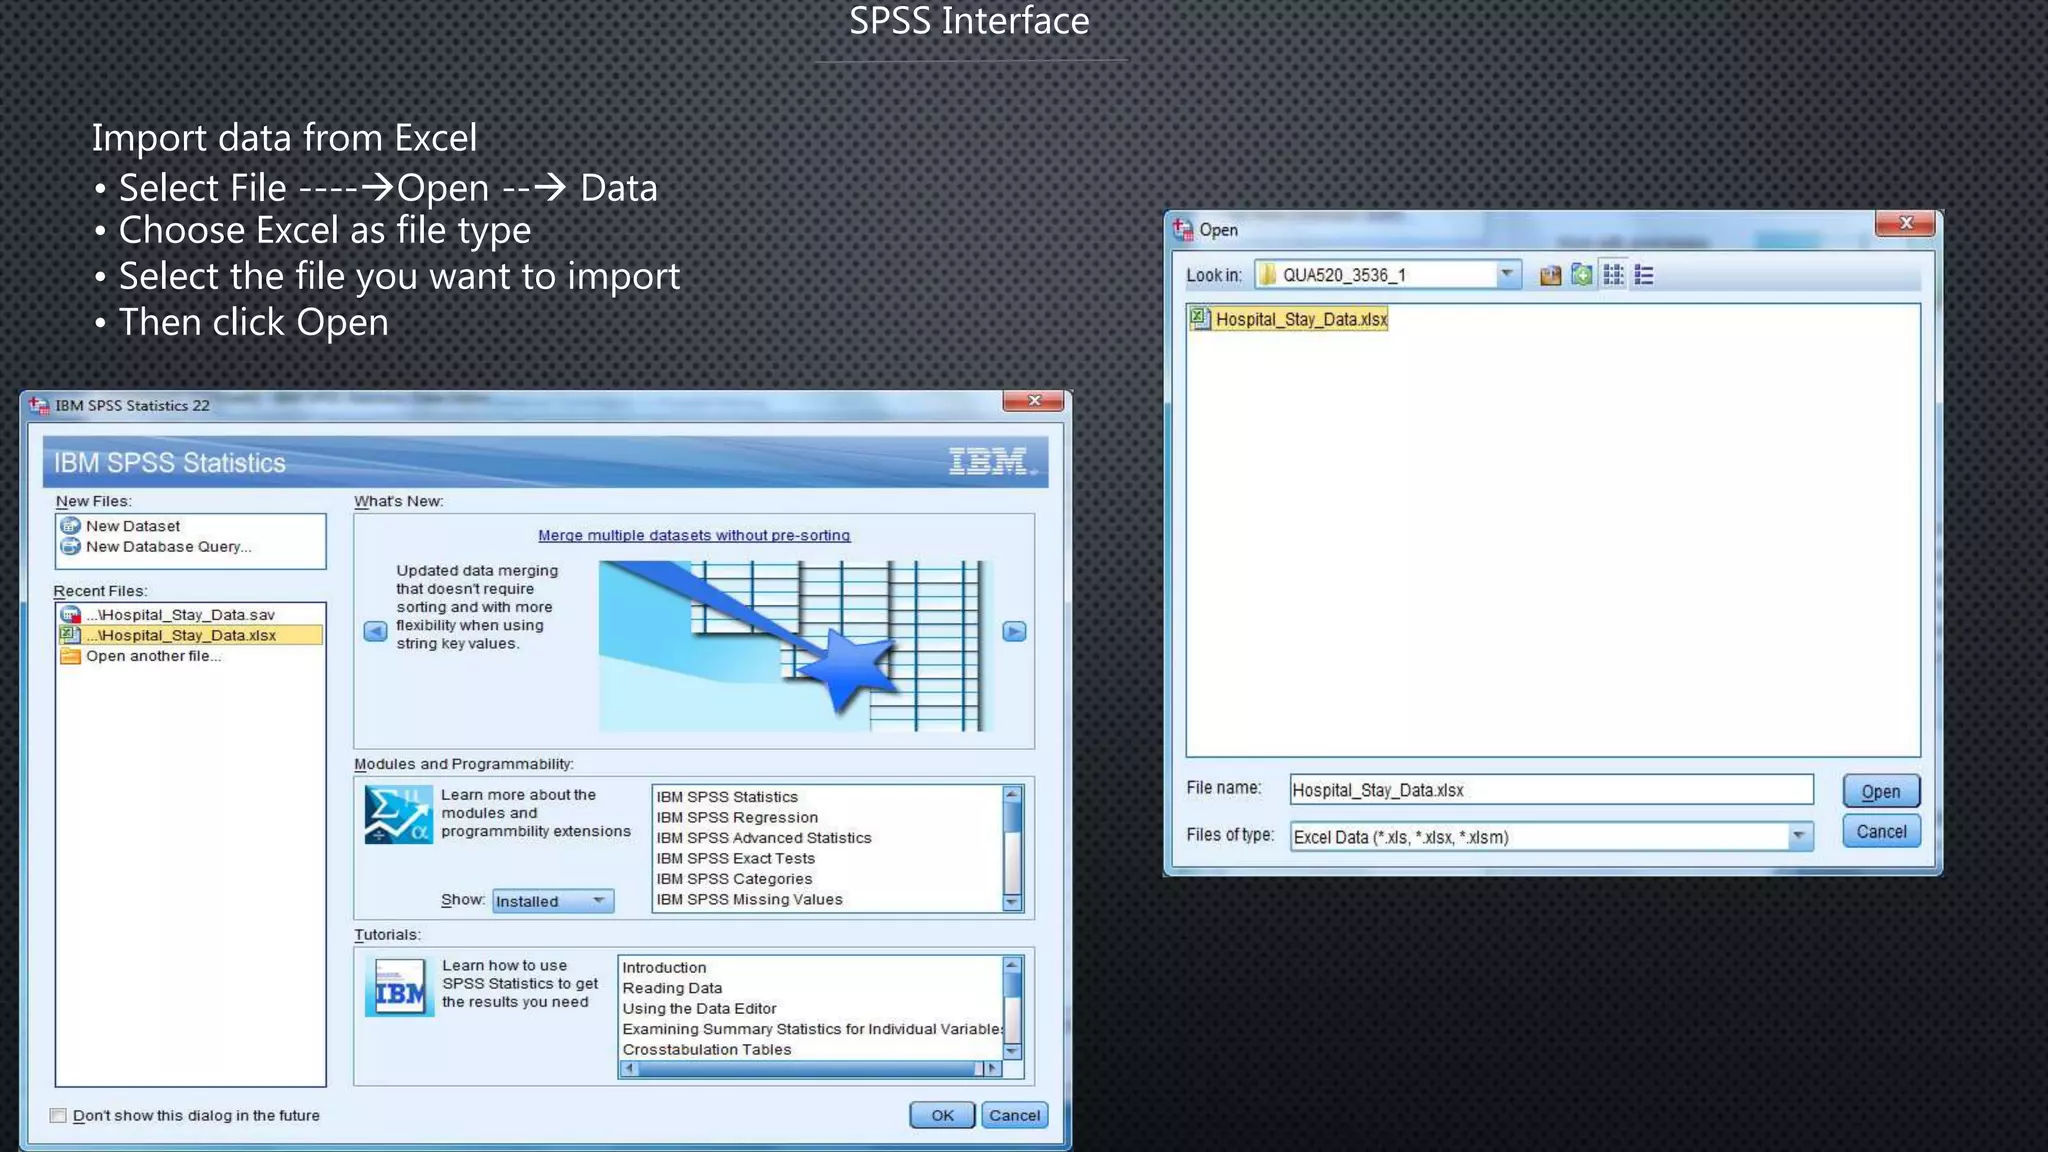
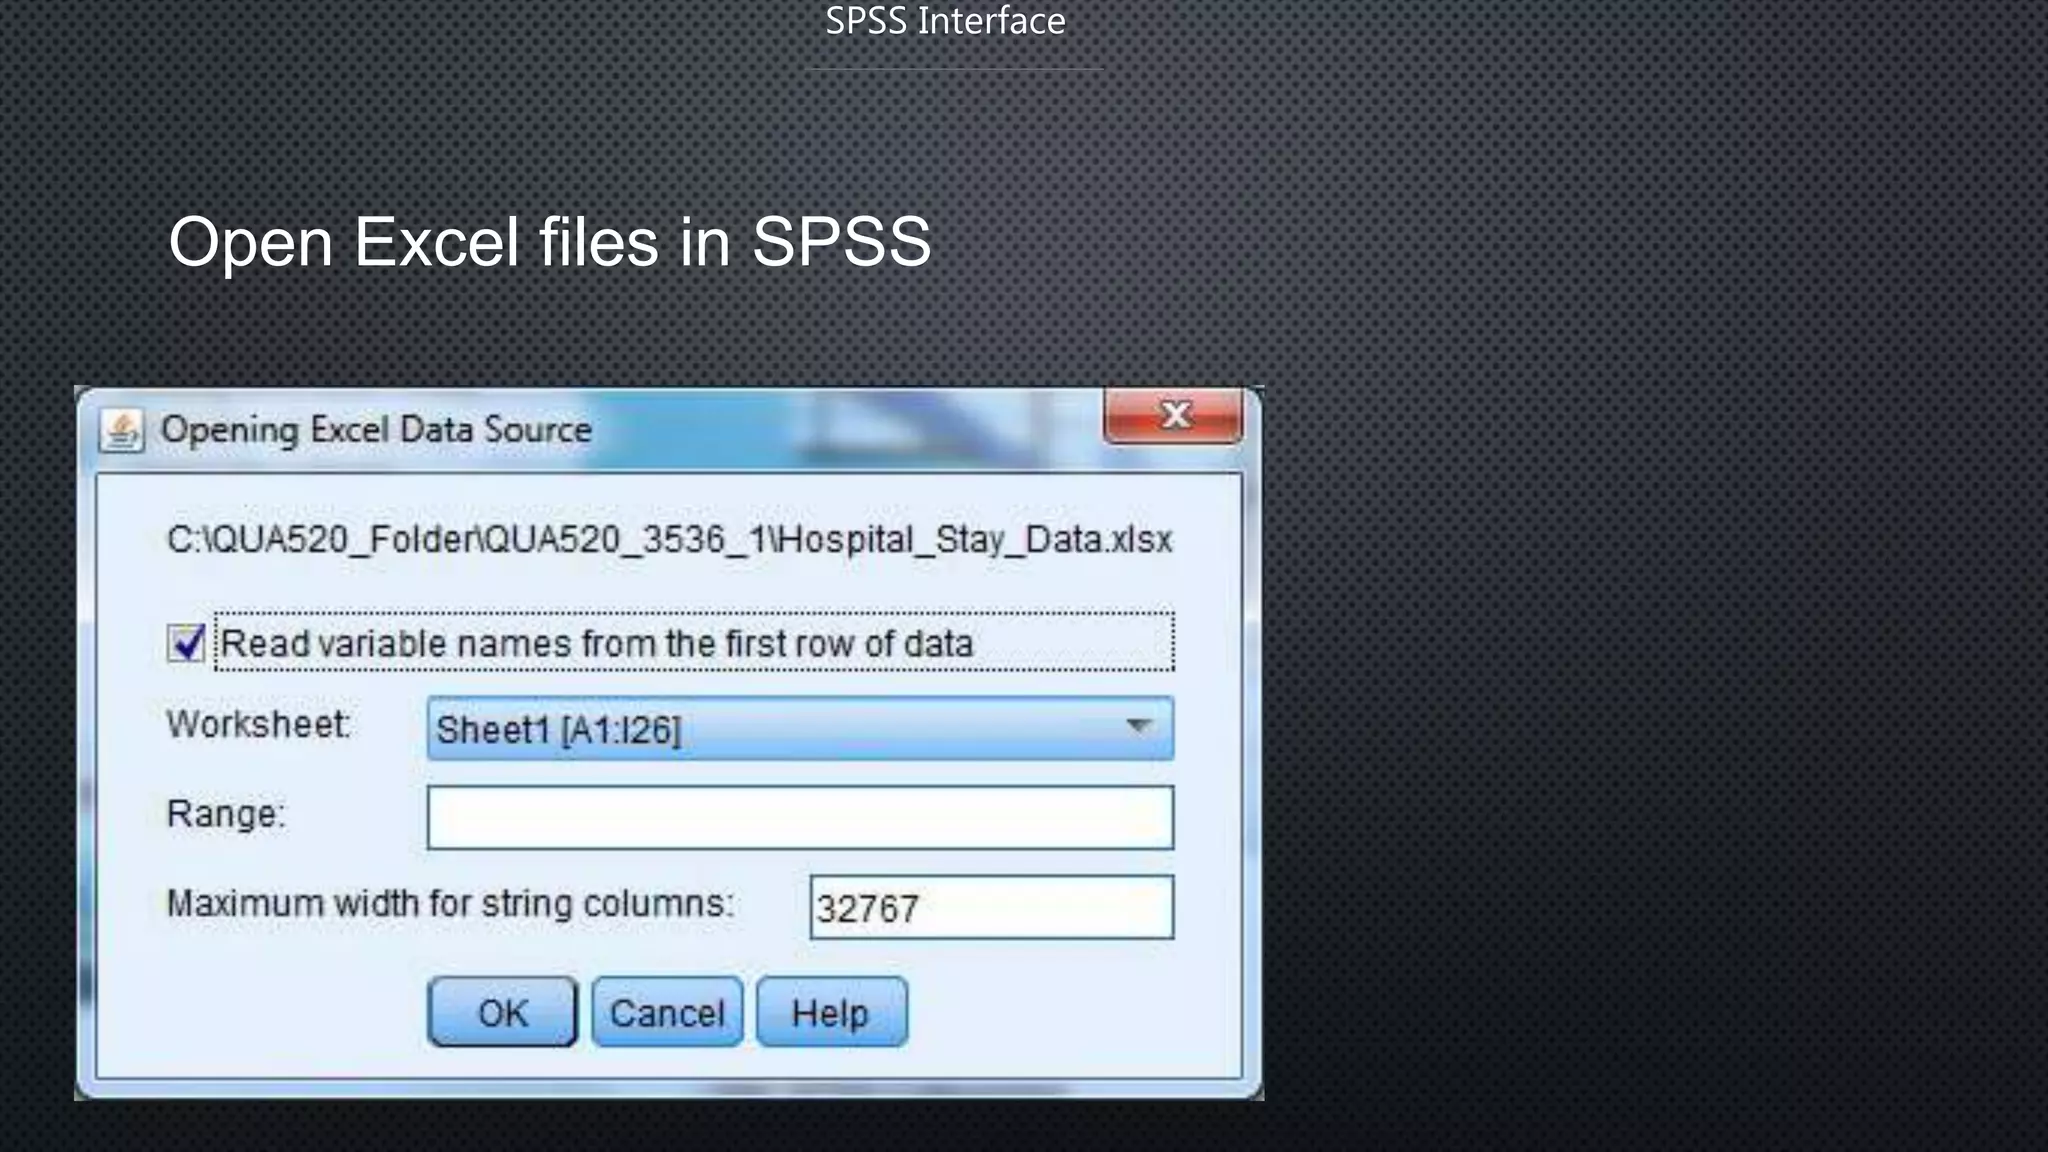
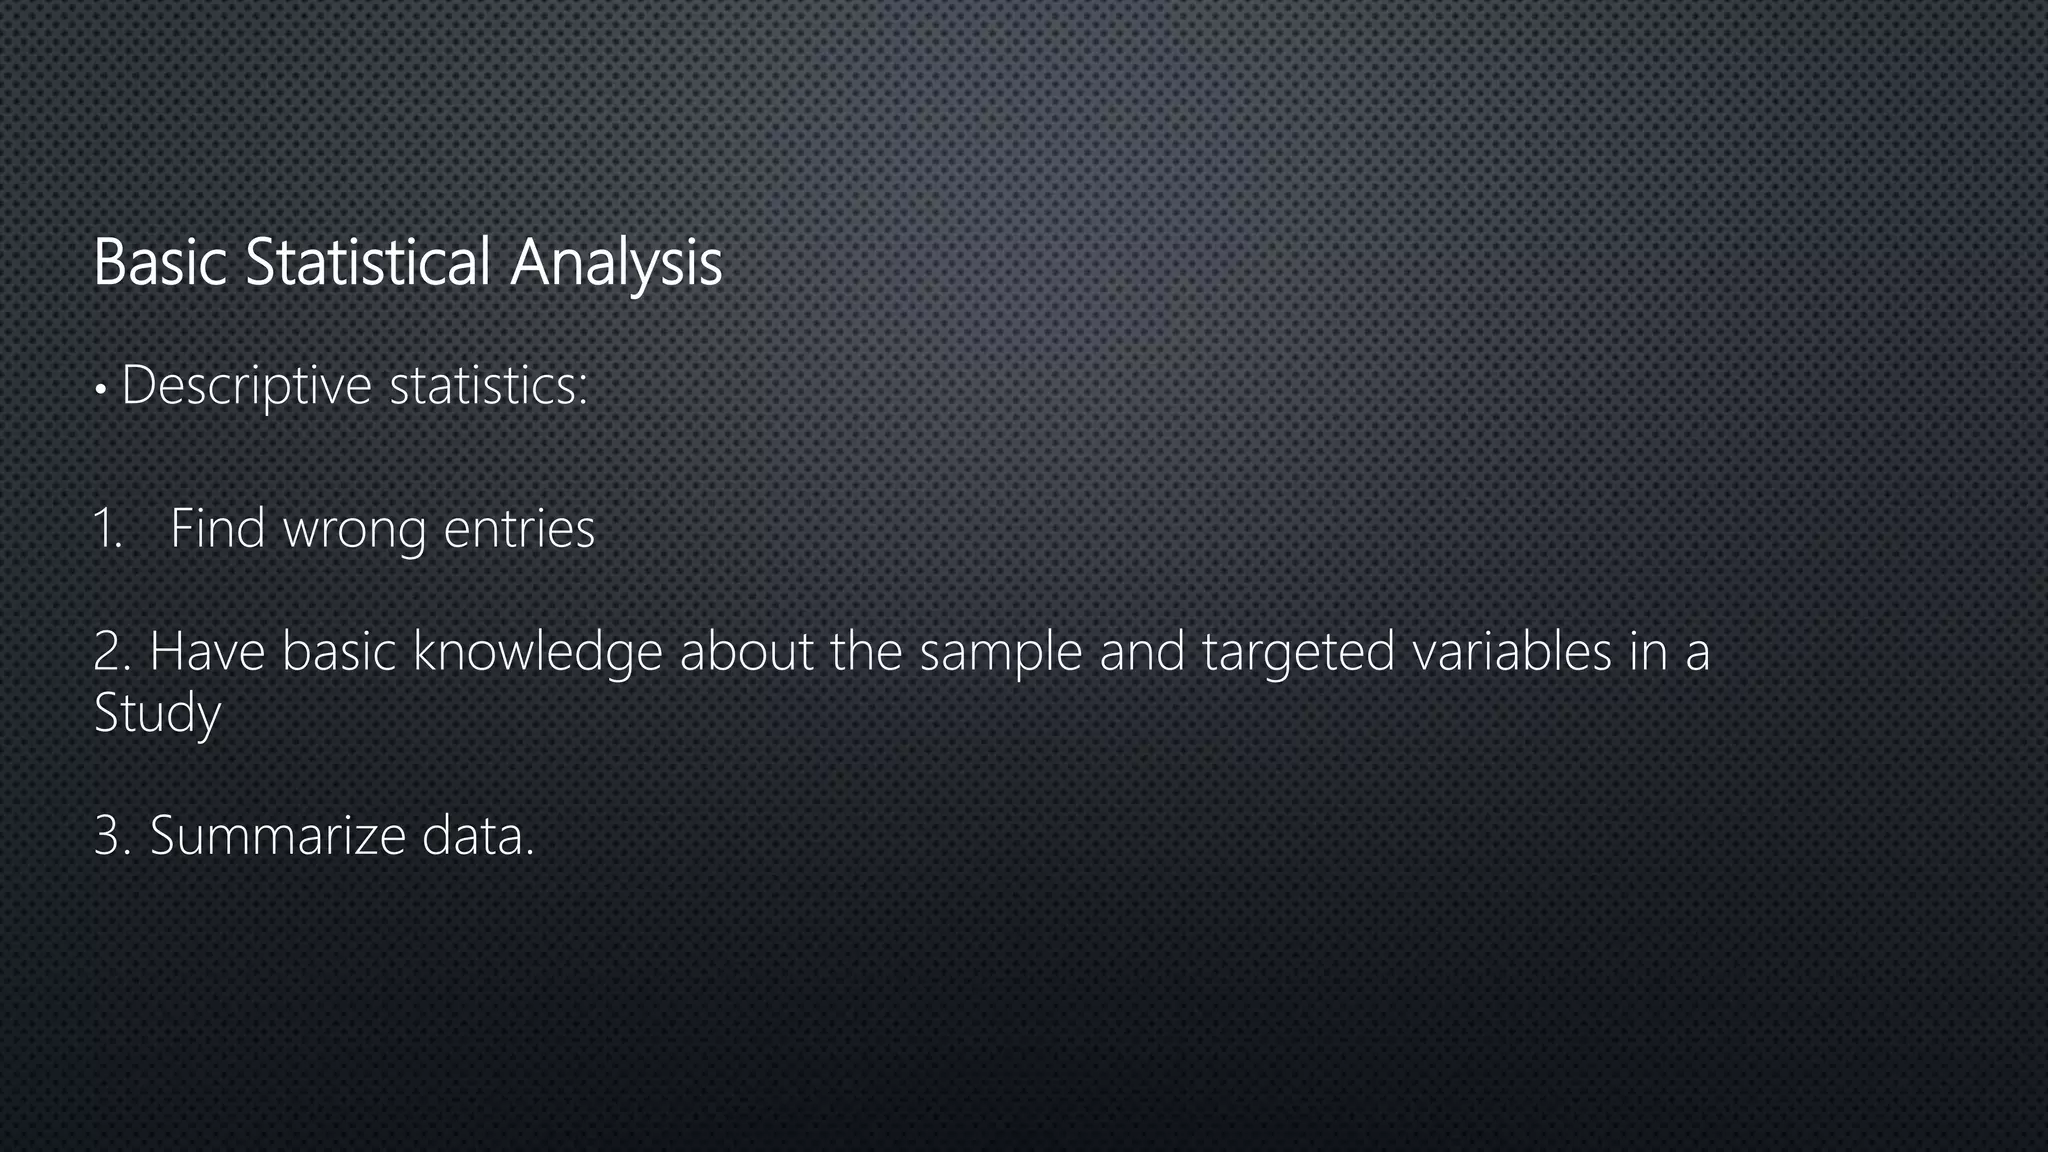
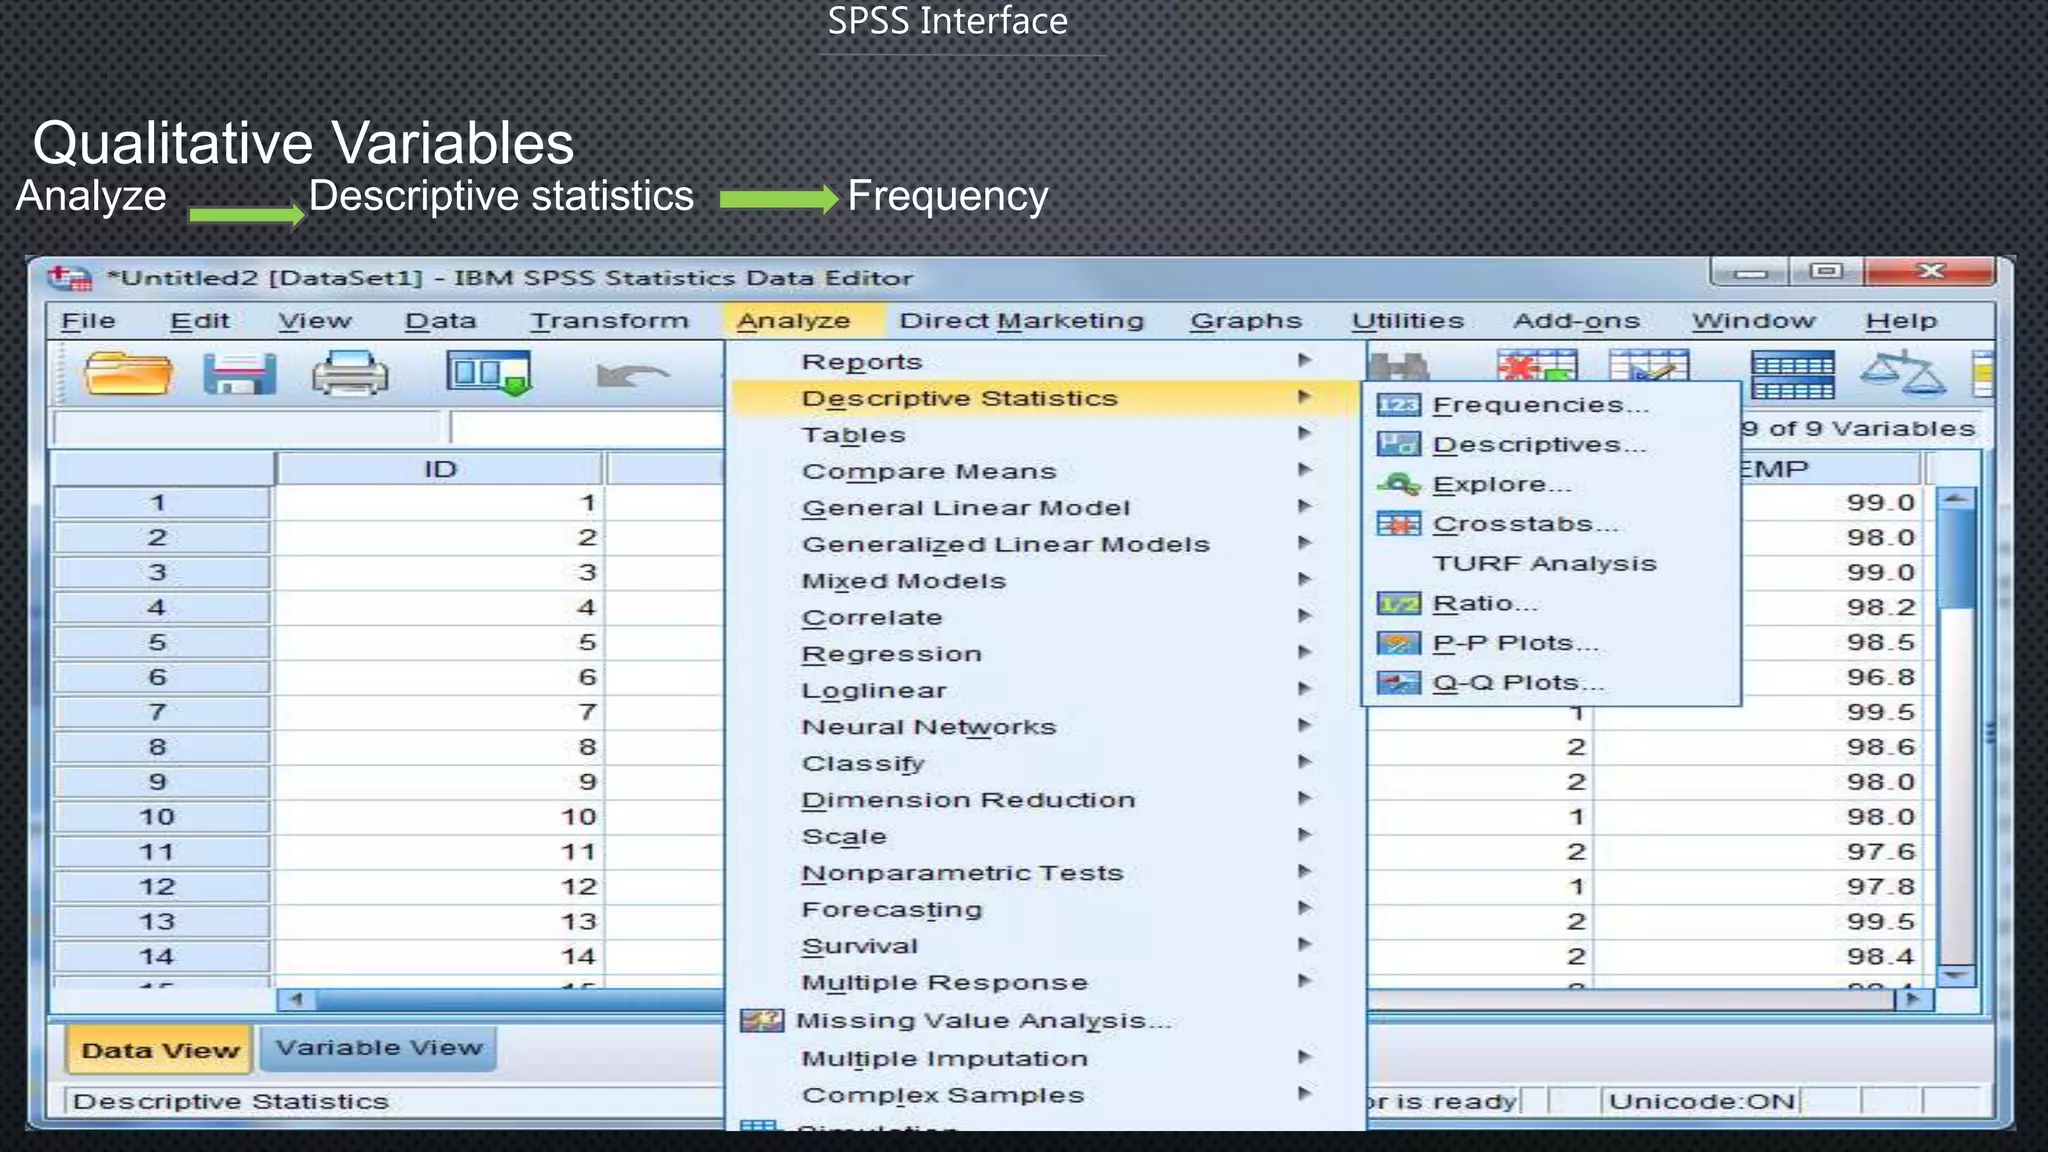
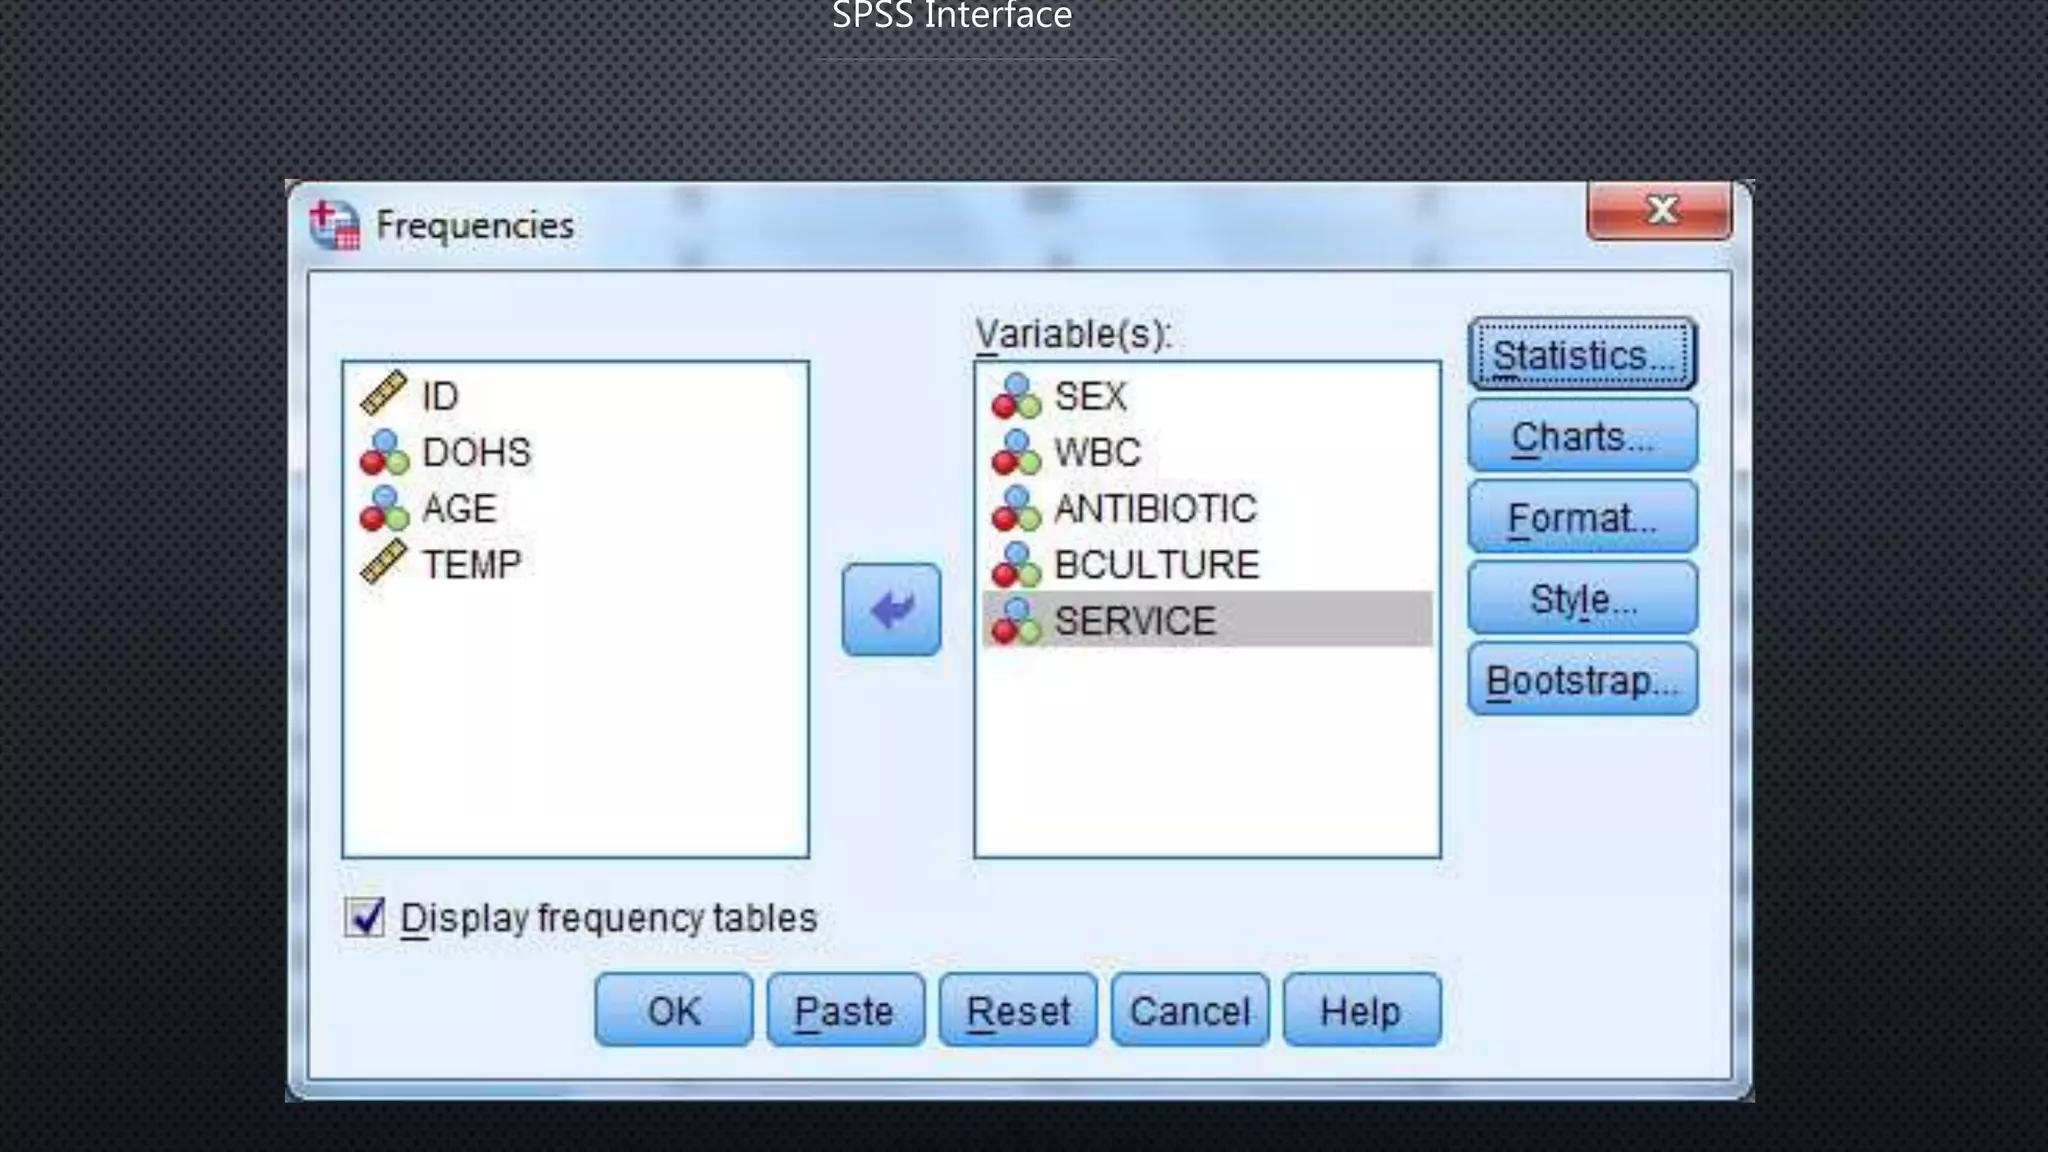
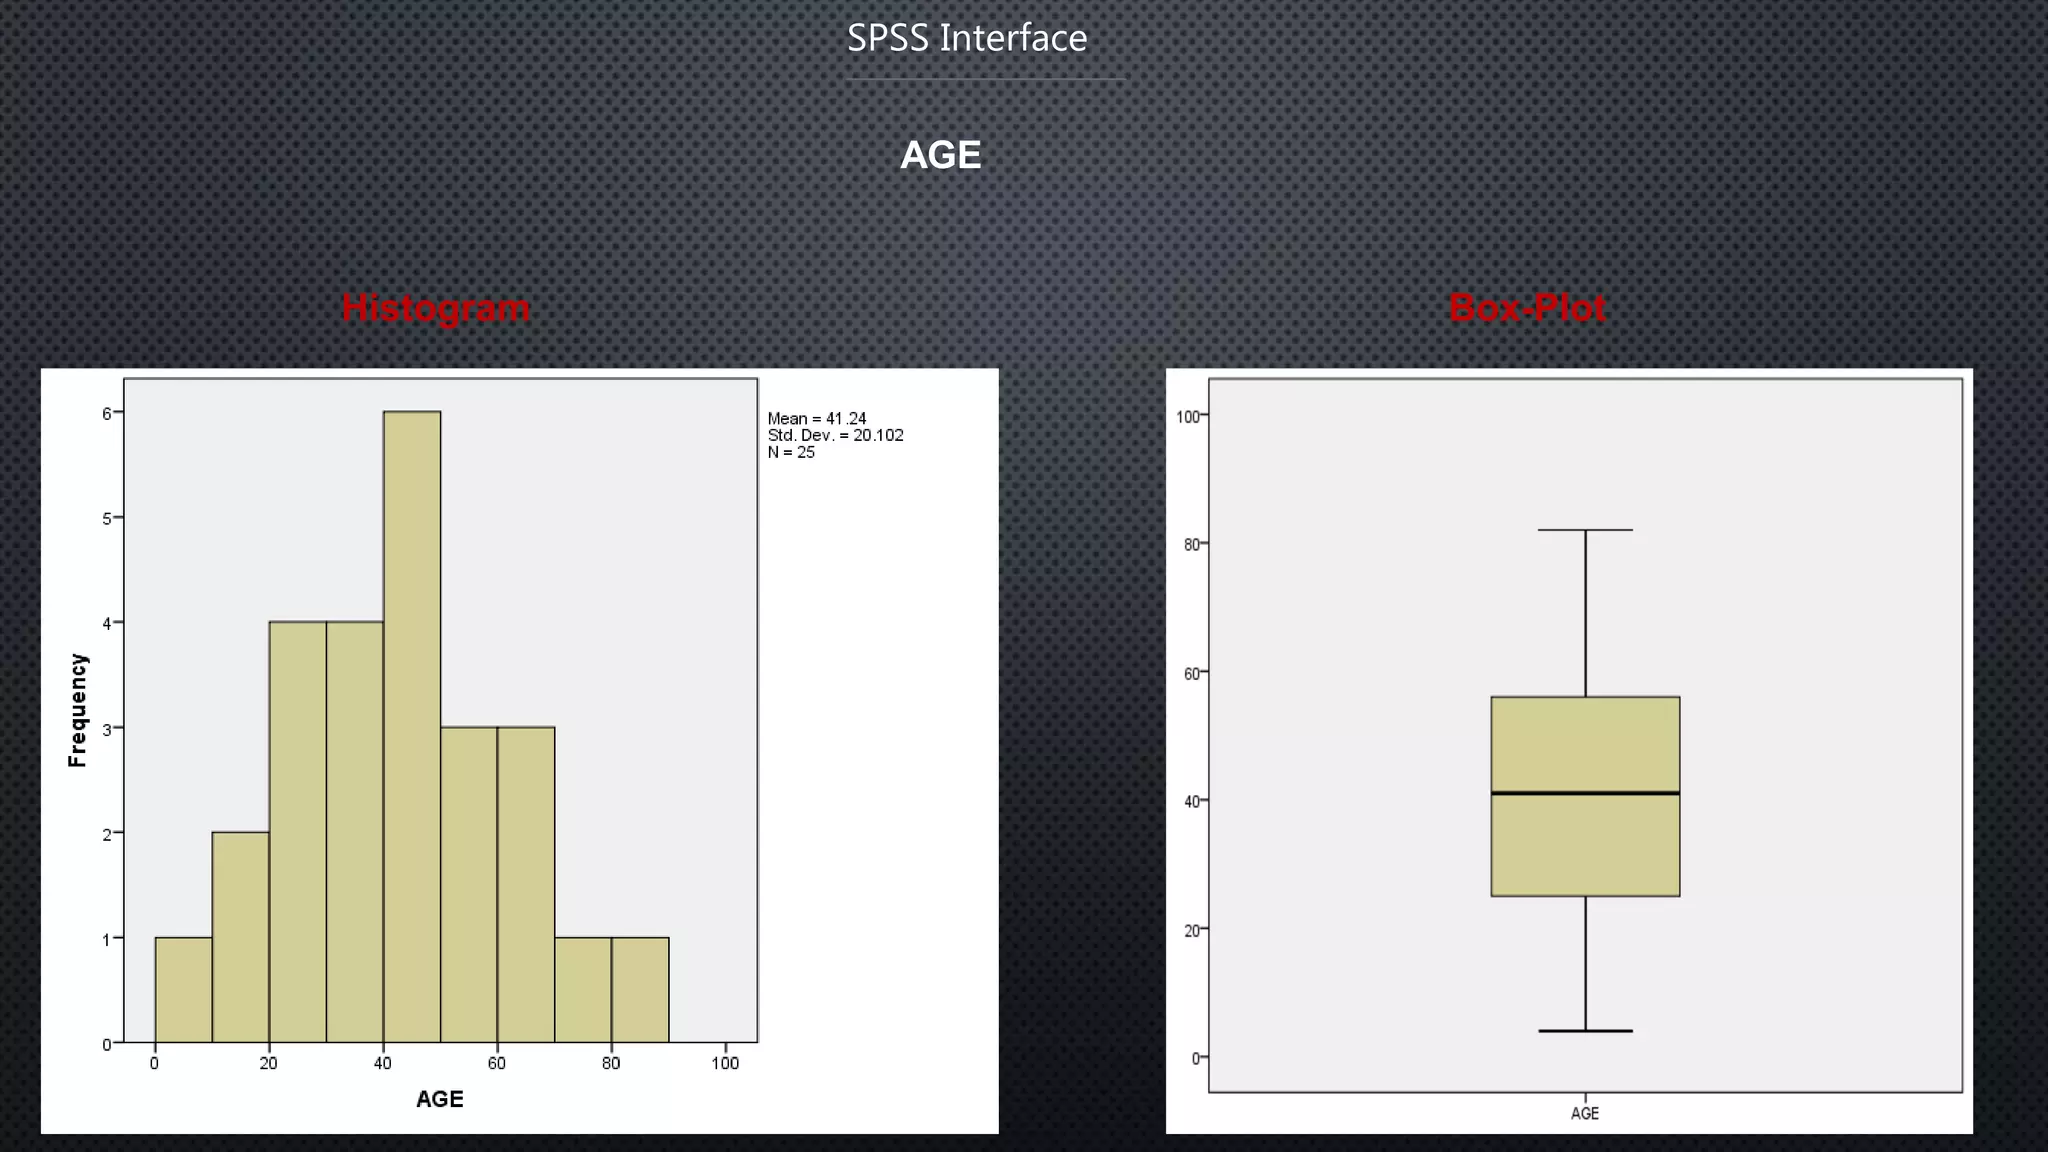
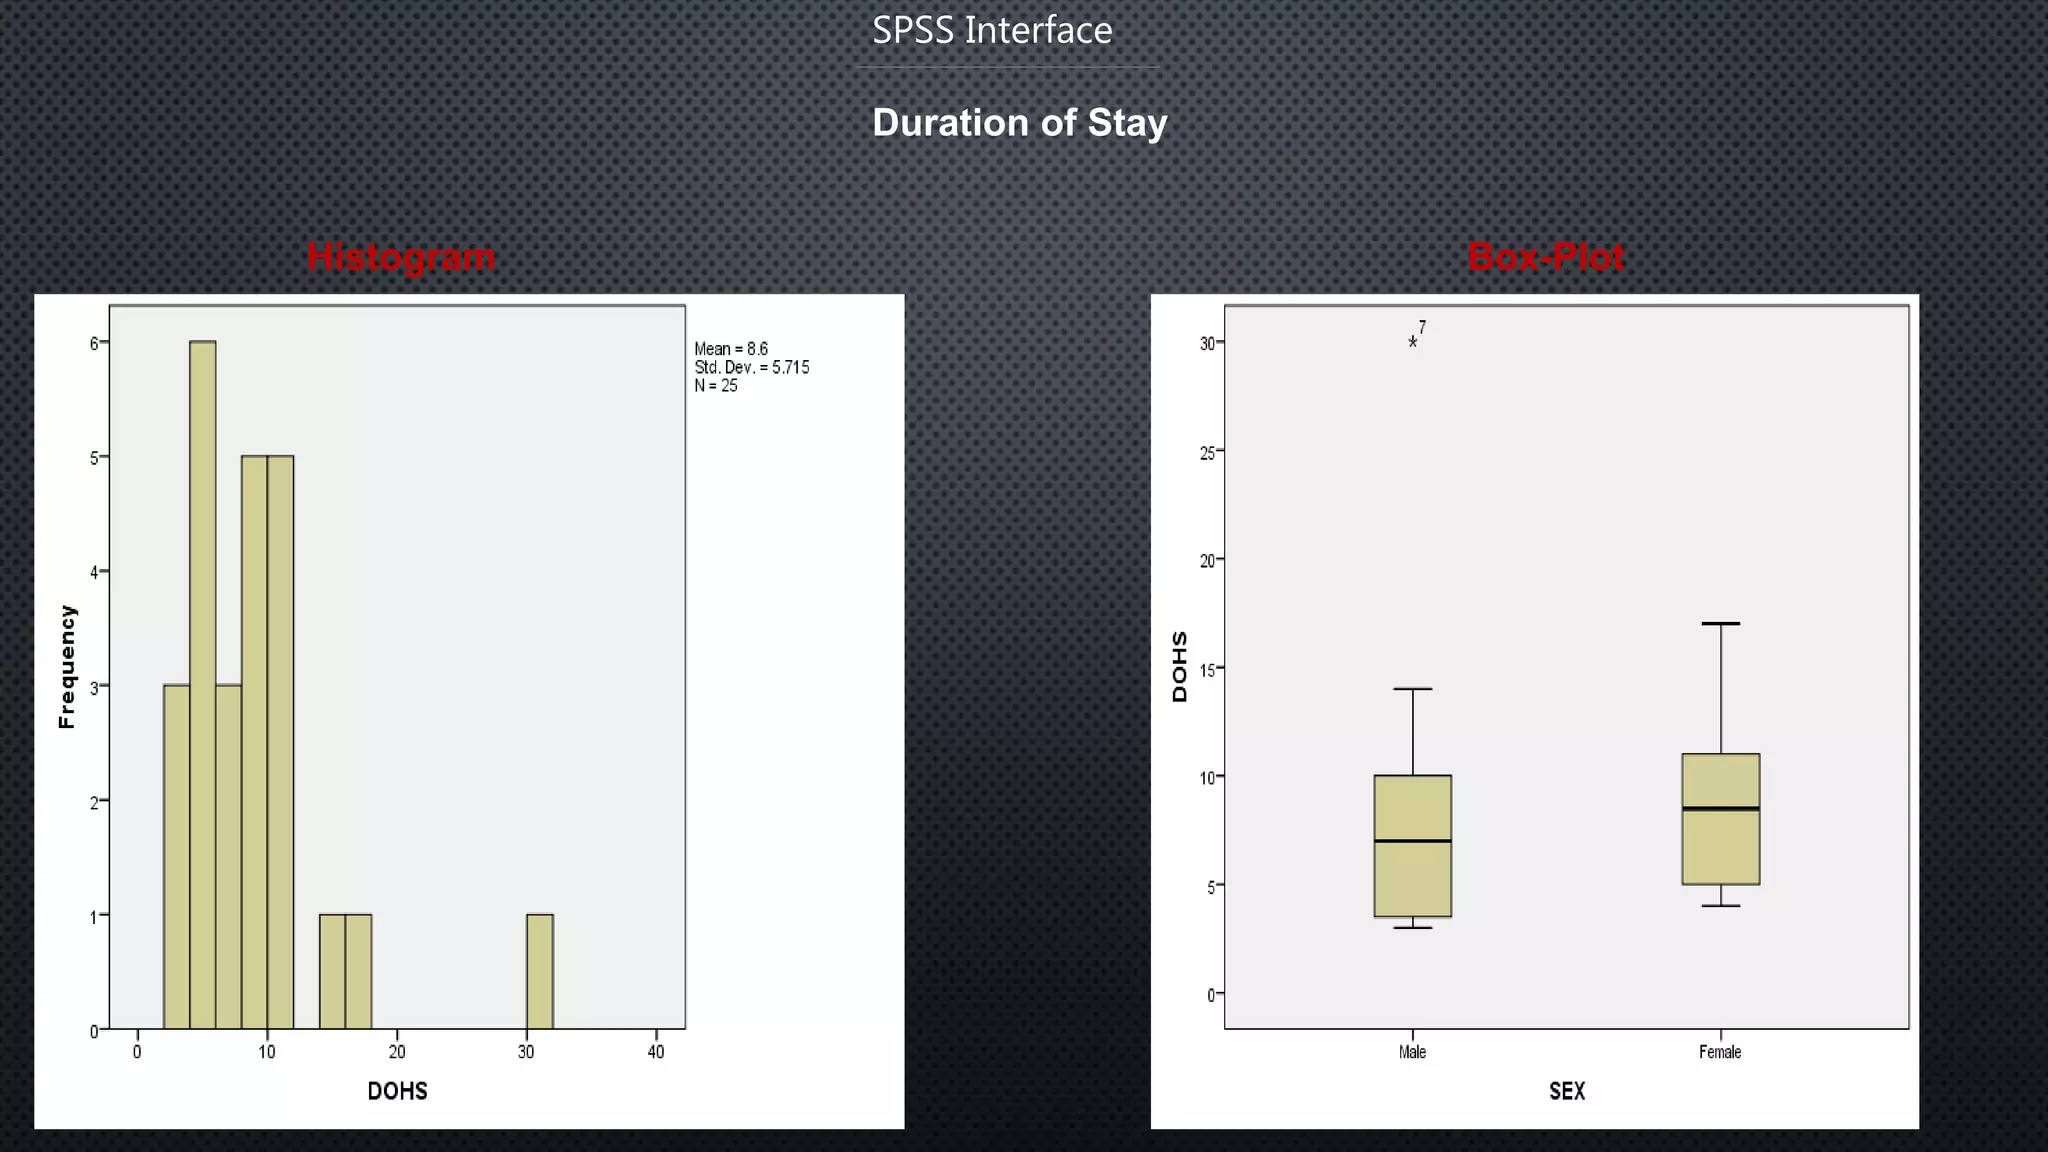
DATA PROCESSING AND ANALYSIS :
SPSS AN OVERVIEW
Athul Ravi
CB.SC.D*CHE20002-FT
Research Scholar
Department of sciences
School of Engineering
Amrita Vishwa Vidyapeetham University
Coimbatore Campus
Contents
 Data and Data analysis
 Steps & Types of Data processing
 Introduction to SPSS
 Basic Steps in Data analysis using SPSS
 SPSS interface
 Enter Data in SPSS
 Data edit and Deletion
Content
Data and Data analysis
• DATA is a collection of facts, such as numbers, words, measurements, observations or just descriptions of things.
• A DATA SET is a representation of data, defining a set of variables" that are measured on a set of cases.“
• A VARIABLE is any characteristic of an object that can be represented as a number. The values that the variable
takes will vary when measurements are made on different objects or at different times.
• INFORMATION is collection of data which conveys some meaningful idea is information. It may provide answers
to questions like who, which, when,why, what, and how.
• DATA PROCESSING is Any operation or set of operations performed upon data, whether or not by automatic
means, such as collection, recording, organization, storage,adaptation or alteration to convert it into useful
information.
Data Process Information
Data Processing
The processing of converting data into usefulinformation is called Data processing.
Processing
11102
8
Date
11/10/28
Time
11:10:28
Amount
111028€
Data
Information
Data Processing
There are 5 steps included in Data processing:
Editing : Editing of data is a process of examining the collected raw data to detect errors and
omission and to correct these when possible.
Coding : Coding refers to process of assigning numerals or other symbols to answers so that
responses can be put into a limited number of categories or classes.
Classification : Data having a common characteristics are placed in one class and in this way the
entire data get divided into a number of groups or classes.
Data Entry : After the data has been properly arranged and coded, it is entered into the software
that performs the eventual cross tabulation.
Validation : The process of thoroughly checking the collected data to ensure optimal quality levels.
Tabulation : Tabulation is the process of summarizing raw data and displaying the same in compact
form for further analysis.
 Once data is collected, it is processed to convert it into useful information. The data is
processed again and again until the accurate result is achieved. This is called
data processing cycle.
 The data processing is very important activity and involves very careful planning.
 Usually, data processing activity involves three basic activities.
1. Input
2. Processing
3. Output
Data Processing
Data Processing Cycle
Introduction to SPSS
SPSS?
SPSS - Statistical Package for Social Sciences
SPSS is a computer program used for survey authoring and
deployment, data mining, text analytics, statistical analysis,
and collaboration and deployment
Introduction to SPSS
• SPSS is short for Statistical Package for Social Sciences, and it is used by various kind of researchers for
complex statistical data analysis.
• SPSS is a comprehensive and flexible statistical analysis and data management solution.
• Its is developed by Norman H. Nie and C. Hadlai Hull of IBM Corporation in the year 1968. It is compatible with
Windows, Linux, UNIX & Mac operating systems. SPSS is among the most widely used programs for statistical
analysis in social science.
• It is easy to learn and use and it includes a full range of data. Management system and editing tools.
• It provides in-depth statistical capabilities and it offers complete plotting, reporting and presentation features.
Basic steps for Data analysis in SPSS
Getting data into SPSS
Creating new SPSS data files
Opening existing SPSS system files
Importing data from an ASCII file
Importing data from other file formats
DATA EDITOR
The data editor offers a simple and efficient spreadsheet like facility for entering data and
browsing the working data file.
This window displays the content of the data file.
One can create new data files or modify existing ones.
One can have only one data file open at a time.
Basic steps for Data analysis in SPSS
This editor provides two views of the data,
DATA VIEW
 Displays the actual data values or defined value labels.
VARIABLE VIEW
 Displays variable definition information, including defined variable and value labels, data type, etc..,
BASIC STEPS IN DATA ANALYSIS
Get Your Data Into SPSS: We can open a previously saved SPSS data file, read a spreadsheet, database ,or text
data file, or enter directly in the data editor.
Select a Procedure: Select a procedure from the menus to calculate statistics or to create a chart.
Select The Variable For The Analysis: Variables in the data file are displayed in a dialog box for the procedure.
Run The Procedure: Results are displayed in the viewer
SPSS Interface
Enter Data in SPSS directly
Example: Hospital-stay data
SPSS Interface
SPSS Interface
Columns:
variables
Rows:
cases
Under Data
View
Enter Variables
SPSS Interface
1. Click Variable View
2. Type variable name
under Name column (AGE).
NOTE: Variable name
can be 64 bytes long,
and the first
character must be a
letter or one of the
characters @, #, or $.
3. Type: Numeric,
string, etc.
4. Label: description of
variables.
2. Type
variable
name
1. Click this
Window
3. Type:
numeric or
string
4.
Description
of variable
SPSS Interface
Based on your code
book
SPSS Interface
Enter Cases
Import data from Excel
• Select File ----Open -- Data
• Choose Excel as file type
• Select the file you want to import
• Then click Open
SPSS Interface
Open Excel files in SPSS
SPSS Interface
Basic Statistical Analysis
• Descriptive statistics:
1. Find wrong entries
2. Have basic knowledge about the sample and targeted variables in a
Study
3. Summarize data.
Qualitative Variables
Analyze Descriptive statistics Frequency
SPSS Interface
SPSS Interface
SPSS Interface
AGE
Histogram Box-Plot
Duration of Stay
Histogram Box-Plot
SPSS Interface
Conclusion
Data processing is a series of actions or steps performed on
data for the formation of subsequent
useful information.
SPSS is a software package used for the logical batched and
non batched statistical analysis.
SPSS statistical programs provides a plethora of basic
statistical functions, some of which includes frequencies,
cross tabulations and bivariate statistics.
References
1. Statistical analysis using quick reference guidebook: with SPSS examples,AC Elliote,
WA Woodward, 2007
2. A handbook of Statistical analysis using SPSS,S. Landaue, J. Elder,G. Miner, 2009
3. IBM SPSS by examples: A practical guide to statistical data analysis.
4. YouTube
5. Google Scholar
6. Google Images
Data processing & Analysis: SPSS an overview

Data processing & Analysis: SPSS an overview

  • 1.
    DATA PROCESSING ANDANALYSIS : SPSS AN OVERVIEW Athul Ravi CB.SC.D*CHE20002-FT Research Scholar Department of sciences School of Engineering Amrita Vishwa Vidyapeetham University Coimbatore Campus
  • 2.
    Contents  Data andData analysis  Steps & Types of Data processing  Introduction to SPSS  Basic Steps in Data analysis using SPSS  SPSS interface  Enter Data in SPSS  Data edit and Deletion Content
  • 3.
    Data and Dataanalysis • DATA is a collection of facts, such as numbers, words, measurements, observations or just descriptions of things. • A DATA SET is a representation of data, defining a set of variables" that are measured on a set of cases.“ • A VARIABLE is any characteristic of an object that can be represented as a number. The values that the variable takes will vary when measurements are made on different objects or at different times. • INFORMATION is collection of data which conveys some meaningful idea is information. It may provide answers to questions like who, which, when,why, what, and how. • DATA PROCESSING is Any operation or set of operations performed upon data, whether or not by automatic means, such as collection, recording, organization, storage,adaptation or alteration to convert it into useful information. Data Process Information
  • 4.
    Data Processing The processingof converting data into usefulinformation is called Data processing. Processing 11102 8 Date 11/10/28 Time 11:10:28 Amount 111028€ Data Information
  • 5.
    Data Processing There are5 steps included in Data processing: Editing : Editing of data is a process of examining the collected raw data to detect errors and omission and to correct these when possible. Coding : Coding refers to process of assigning numerals or other symbols to answers so that responses can be put into a limited number of categories or classes. Classification : Data having a common characteristics are placed in one class and in this way the entire data get divided into a number of groups or classes. Data Entry : After the data has been properly arranged and coded, it is entered into the software that performs the eventual cross tabulation. Validation : The process of thoroughly checking the collected data to ensure optimal quality levels. Tabulation : Tabulation is the process of summarizing raw data and displaying the same in compact form for further analysis.
  • 6.
     Once datais collected, it is processed to convert it into useful information. The data is processed again and again until the accurate result is achieved. This is called data processing cycle.  The data processing is very important activity and involves very careful planning.  Usually, data processing activity involves three basic activities. 1. Input 2. Processing 3. Output Data Processing Data Processing Cycle
  • 7.
    Introduction to SPSS SPSS? SPSS- Statistical Package for Social Sciences SPSS is a computer program used for survey authoring and deployment, data mining, text analytics, statistical analysis, and collaboration and deployment
  • 8.
    Introduction to SPSS •SPSS is short for Statistical Package for Social Sciences, and it is used by various kind of researchers for complex statistical data analysis. • SPSS is a comprehensive and flexible statistical analysis and data management solution. • Its is developed by Norman H. Nie and C. Hadlai Hull of IBM Corporation in the year 1968. It is compatible with Windows, Linux, UNIX & Mac operating systems. SPSS is among the most widely used programs for statistical analysis in social science. • It is easy to learn and use and it includes a full range of data. Management system and editing tools. • It provides in-depth statistical capabilities and it offers complete plotting, reporting and presentation features.
  • 9.
    Basic steps forData analysis in SPSS Getting data into SPSS Creating new SPSS data files Opening existing SPSS system files Importing data from an ASCII file Importing data from other file formats DATA EDITOR The data editor offers a simple and efficient spreadsheet like facility for entering data and browsing the working data file. This window displays the content of the data file. One can create new data files or modify existing ones. One can have only one data file open at a time.
  • 10.
    Basic steps forData analysis in SPSS This editor provides two views of the data, DATA VIEW  Displays the actual data values or defined value labels. VARIABLE VIEW  Displays variable definition information, including defined variable and value labels, data type, etc.., BASIC STEPS IN DATA ANALYSIS Get Your Data Into SPSS: We can open a previously saved SPSS data file, read a spreadsheet, database ,or text data file, or enter directly in the data editor. Select a Procedure: Select a procedure from the menus to calculate statistics or to create a chart. Select The Variable For The Analysis: Variables in the data file are displayed in a dialog box for the procedure. Run The Procedure: Results are displayed in the viewer
  • 11.
    SPSS Interface Enter Datain SPSS directly
  • 12.
  • 13.
  • 14.
    Enter Variables SPSS Interface 1.Click Variable View 2. Type variable name under Name column (AGE). NOTE: Variable name can be 64 bytes long, and the first character must be a letter or one of the characters @, #, or $. 3. Type: Numeric, string, etc. 4. Label: description of variables. 2. Type variable name 1. Click this Window 3. Type: numeric or string 4. Description of variable
  • 15.
  • 16.
  • 17.
    Import data fromExcel • Select File ----Open -- Data • Choose Excel as file type • Select the file you want to import • Then click Open SPSS Interface
  • 18.
    Open Excel filesin SPSS SPSS Interface
  • 19.
    Basic Statistical Analysis •Descriptive statistics: 1. Find wrong entries 2. Have basic knowledge about the sample and targeted variables in a Study 3. Summarize data.
  • 20.
    Qualitative Variables Analyze Descriptivestatistics Frequency SPSS Interface
  • 21.
  • 22.
  • 23.
    Duration of Stay HistogramBox-Plot SPSS Interface
  • 24.
    Conclusion Data processing isa series of actions or steps performed on data for the formation of subsequent useful information. SPSS is a software package used for the logical batched and non batched statistical analysis. SPSS statistical programs provides a plethora of basic statistical functions, some of which includes frequencies, cross tabulations and bivariate statistics.
  • 25.
    References 1. Statistical analysisusing quick reference guidebook: with SPSS examples,AC Elliote, WA Woodward, 2007 2. A handbook of Statistical analysis using SPSS,S. Landaue, J. Elder,G. Miner, 2009 3. IBM SPSS by examples: A practical guide to statistical data analysis. 4. YouTube 5. Google Scholar 6. Google Images