Download to read offline

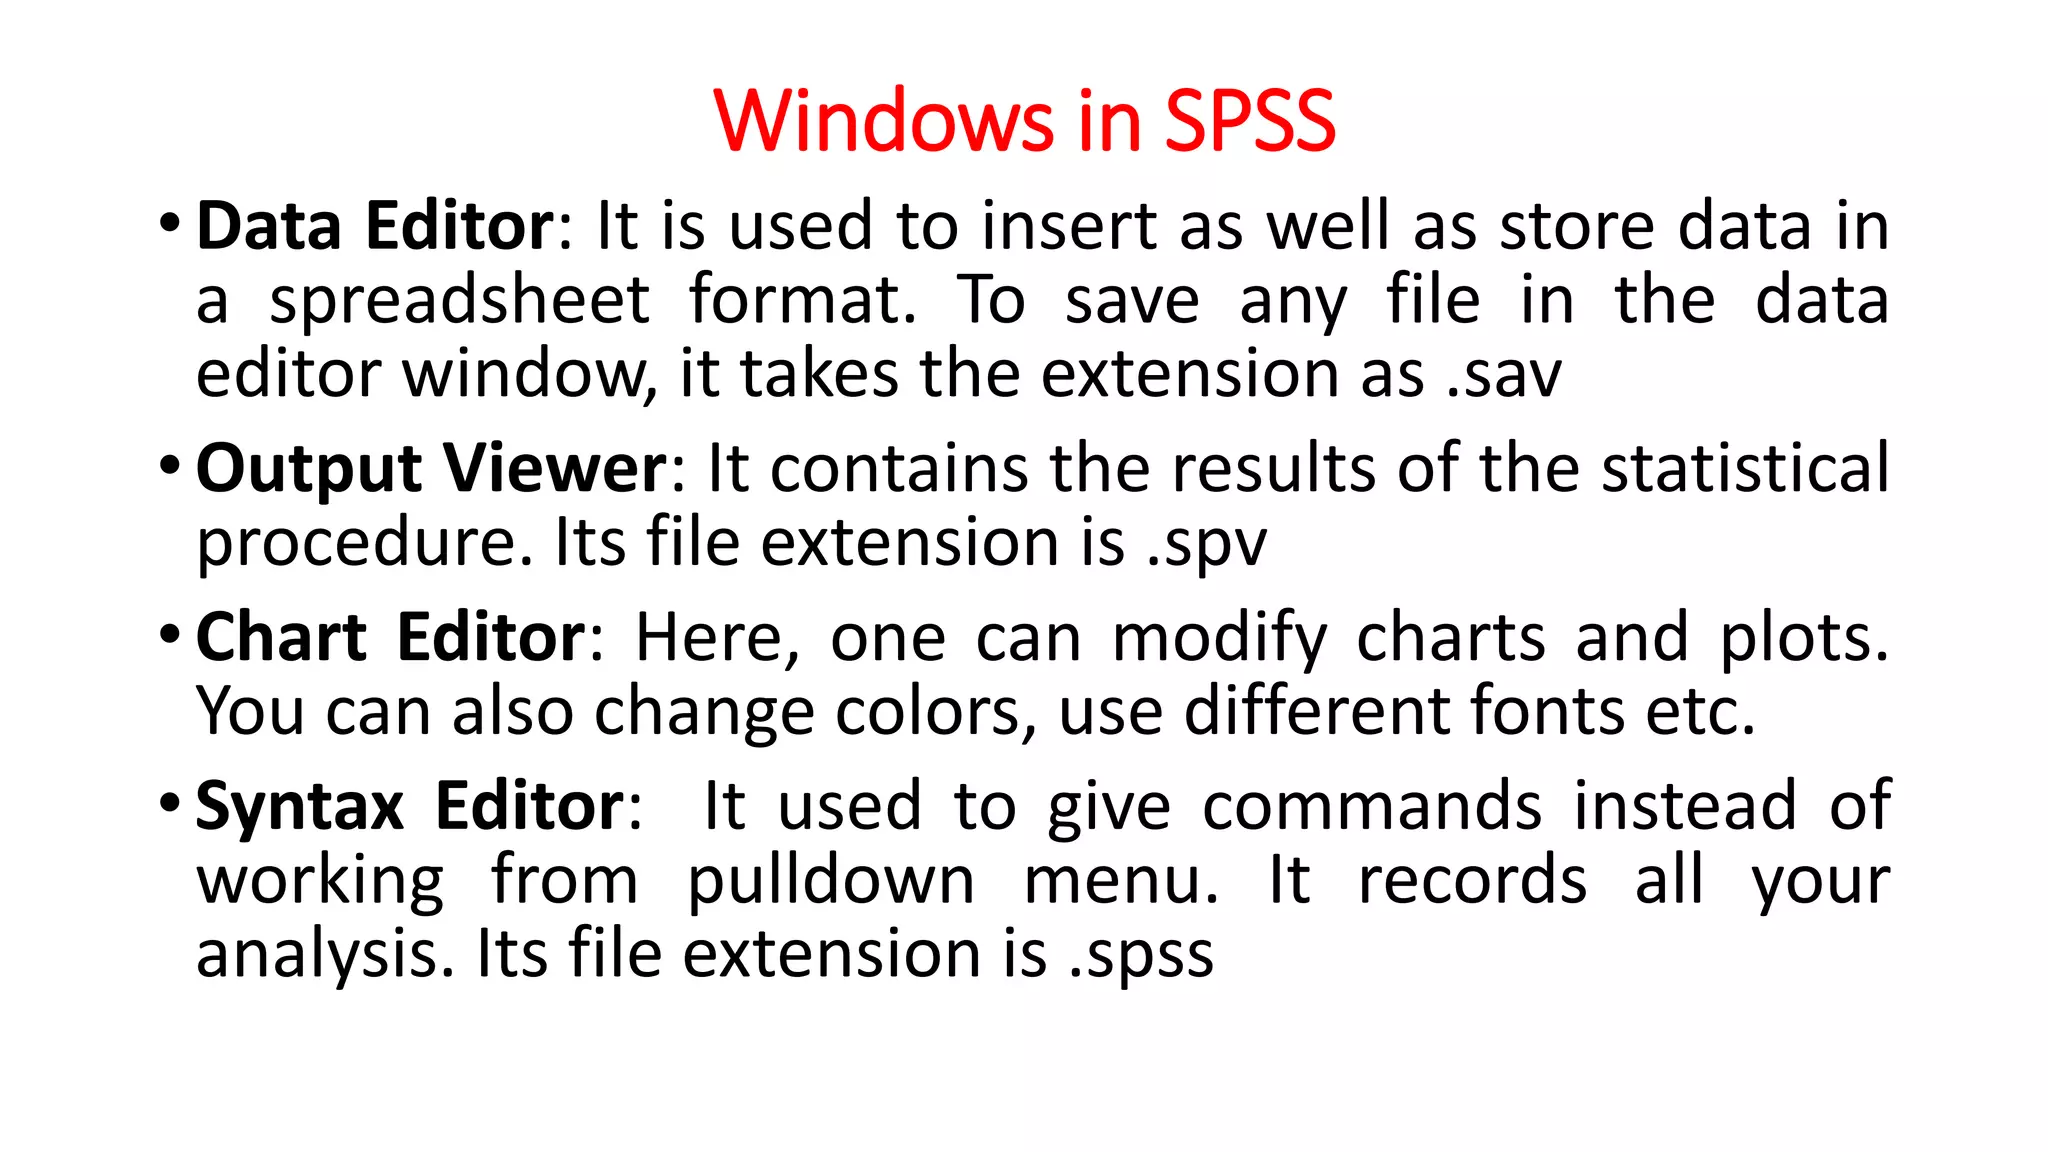
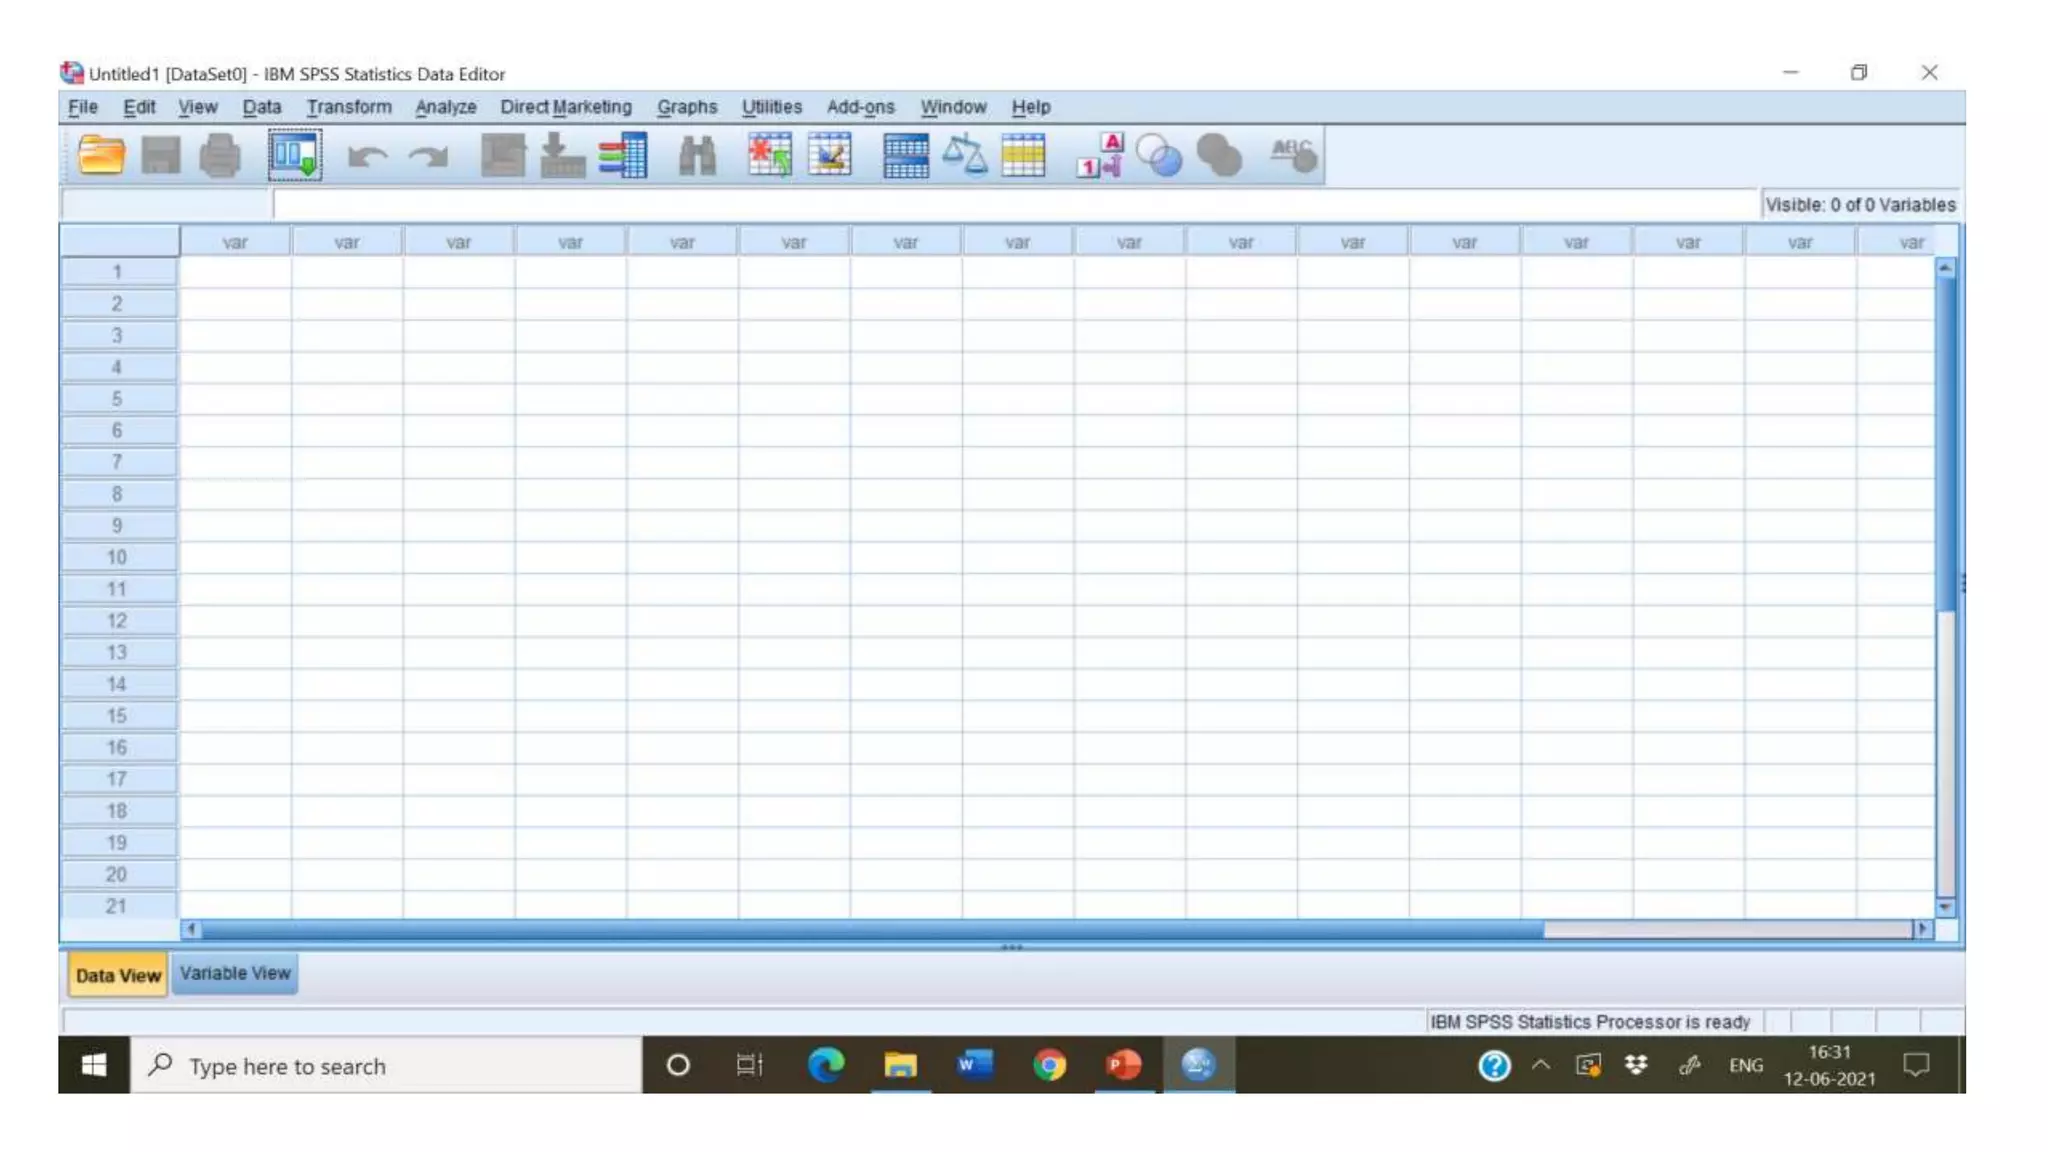
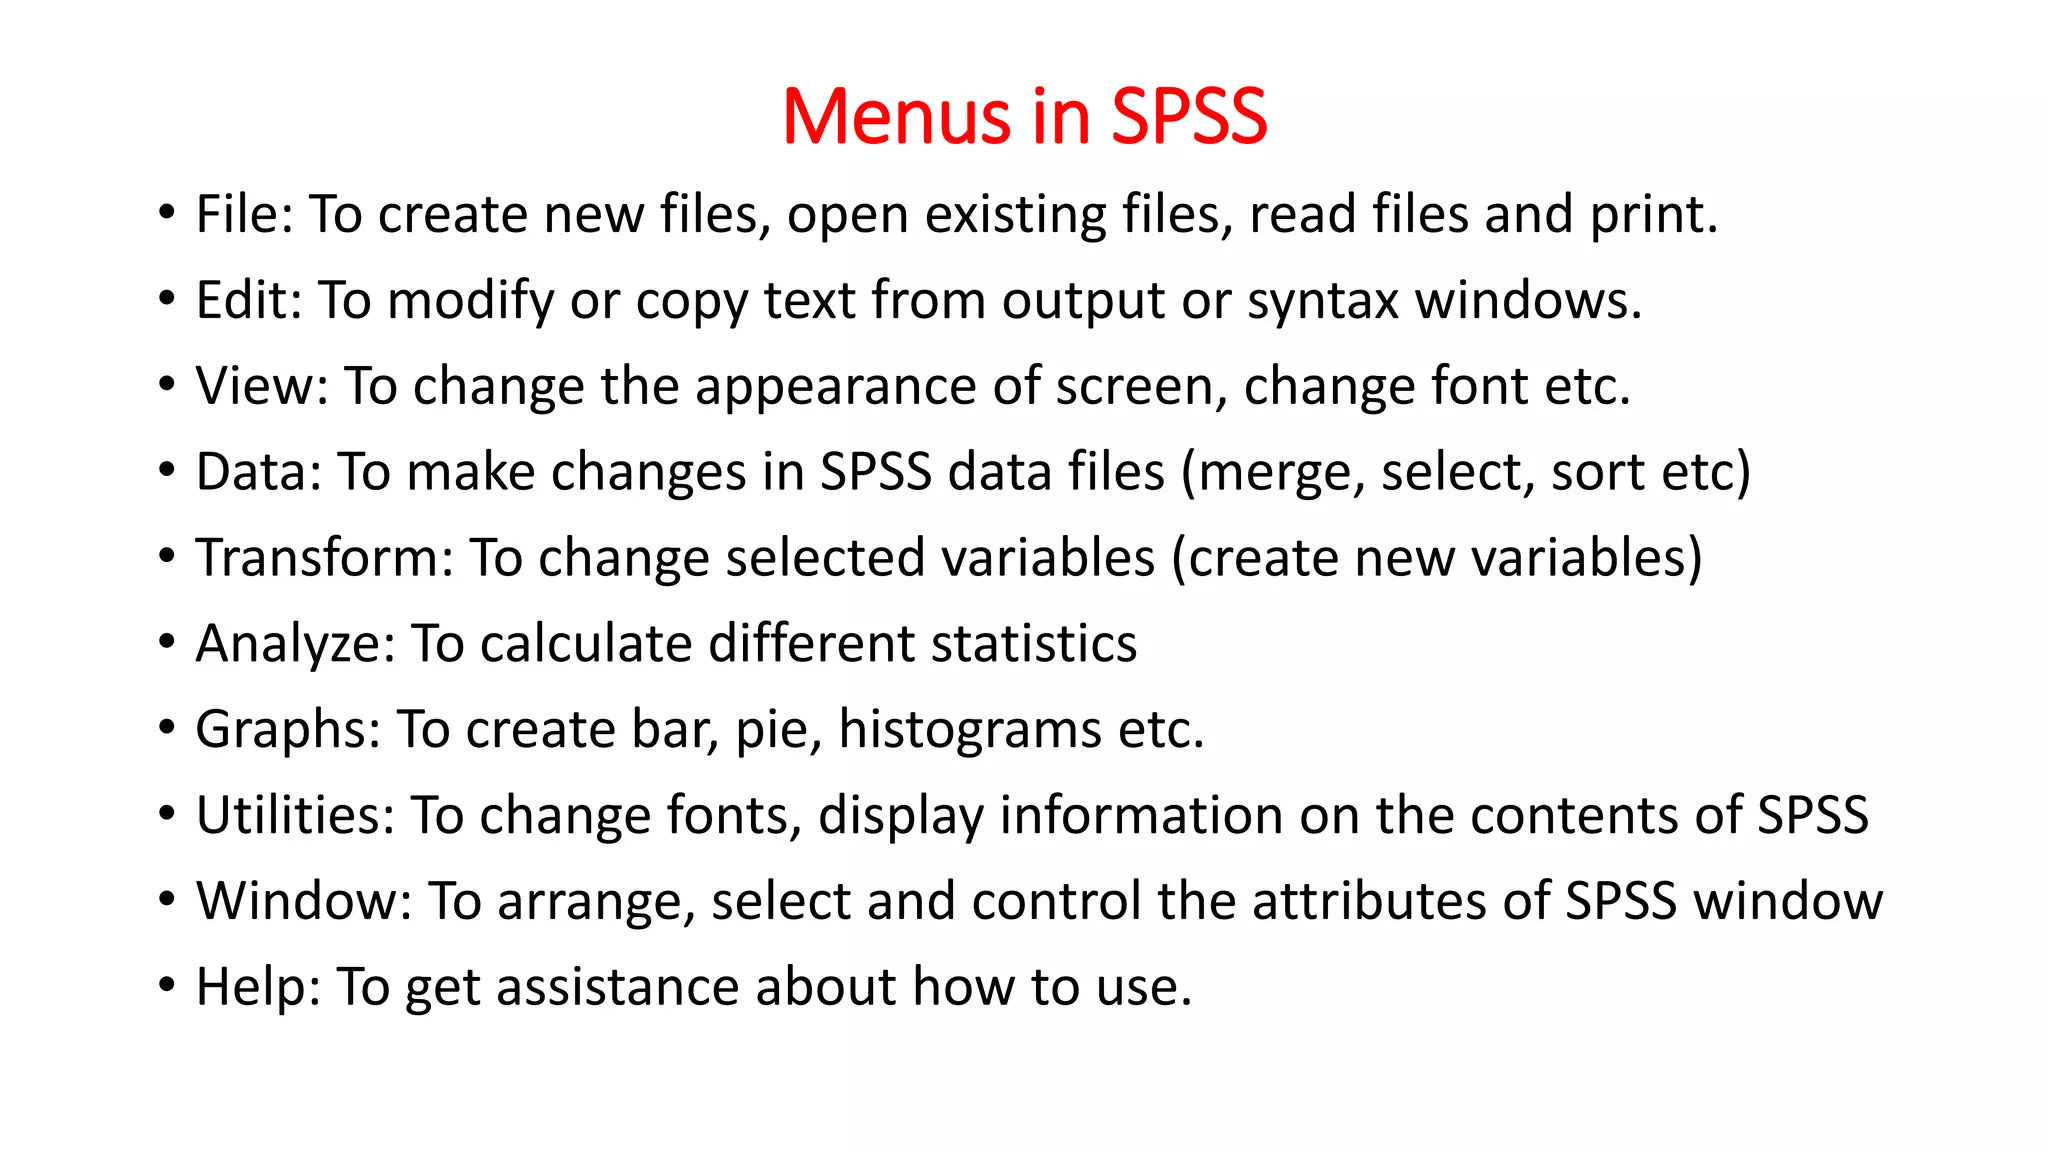
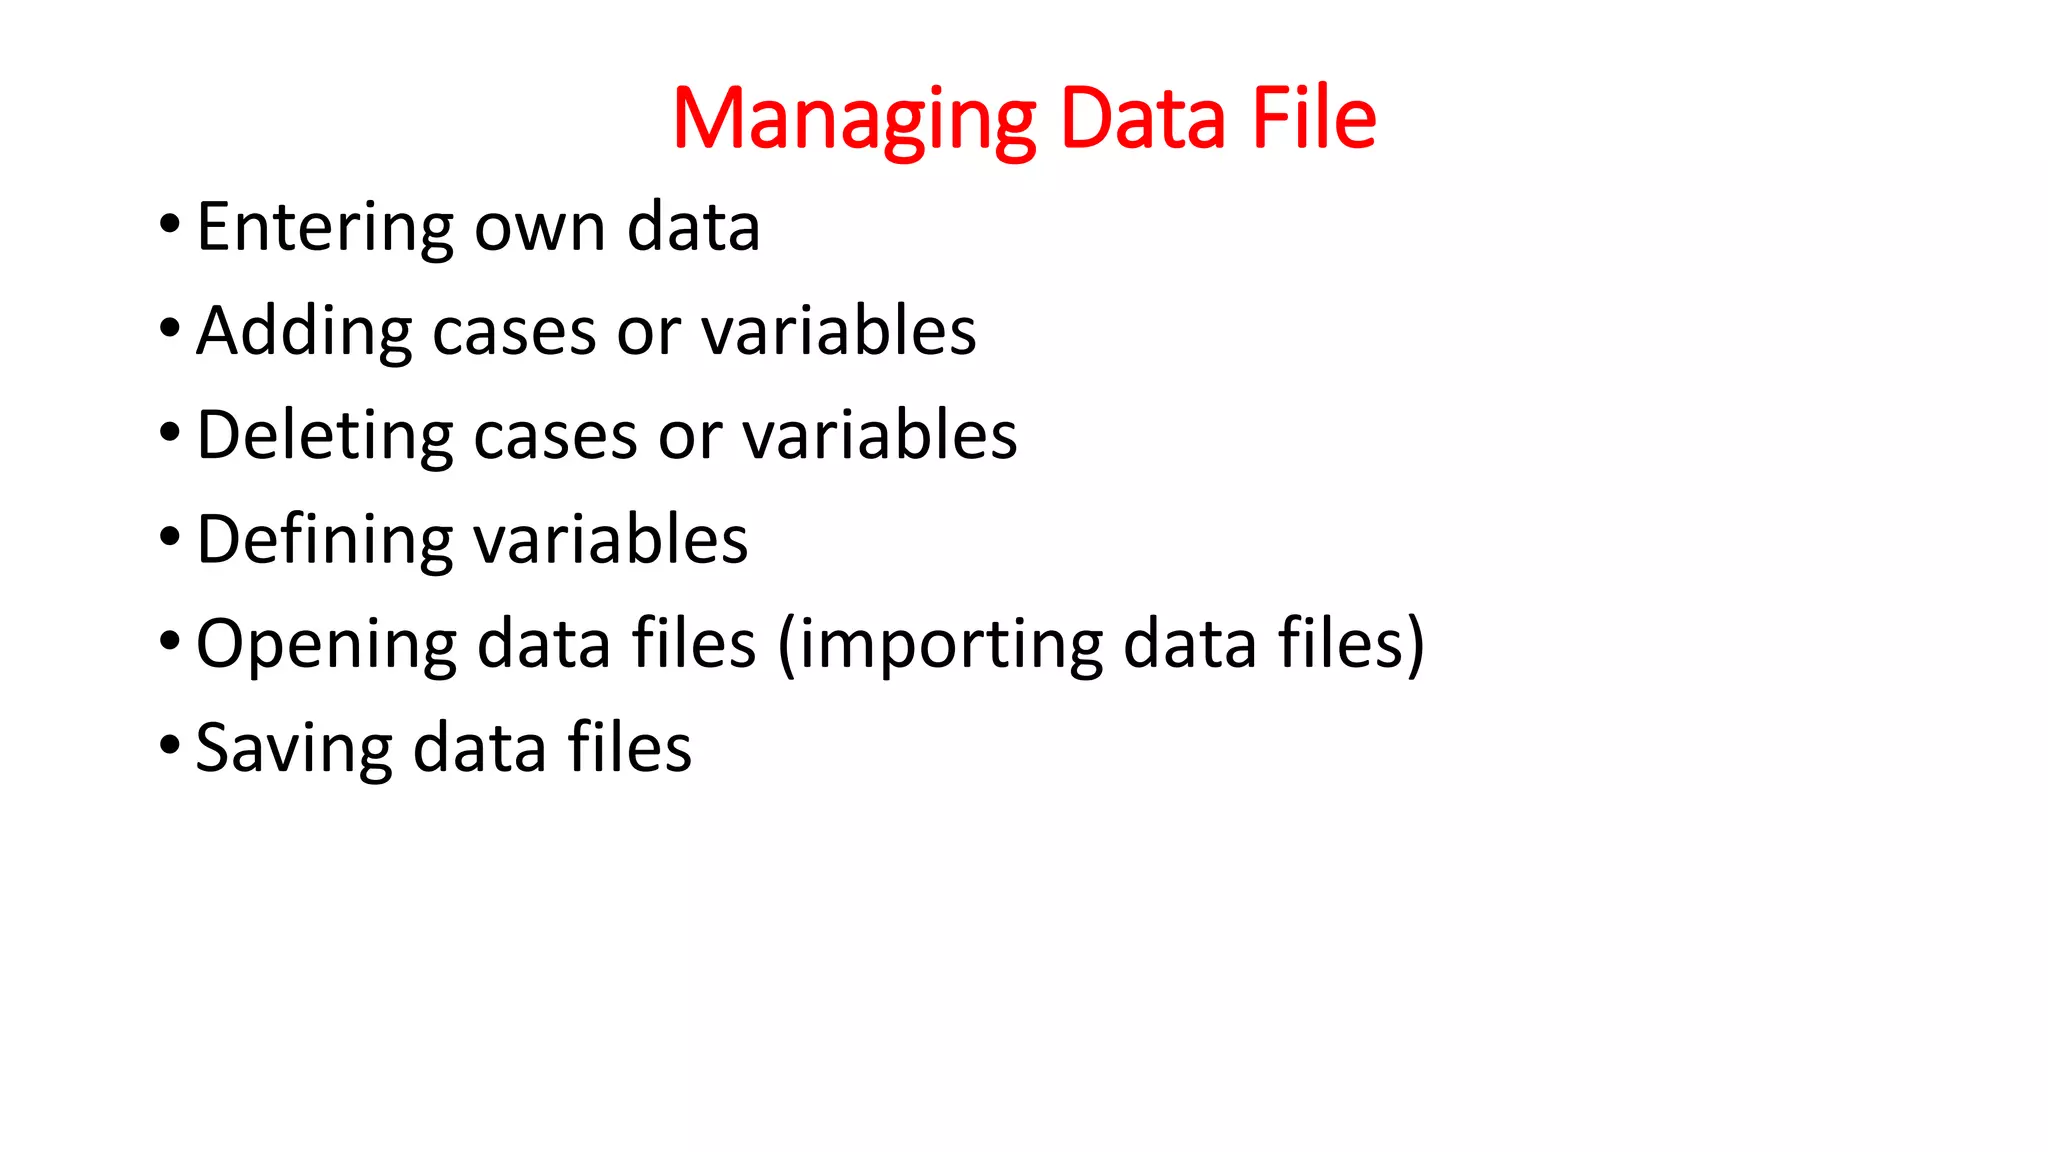
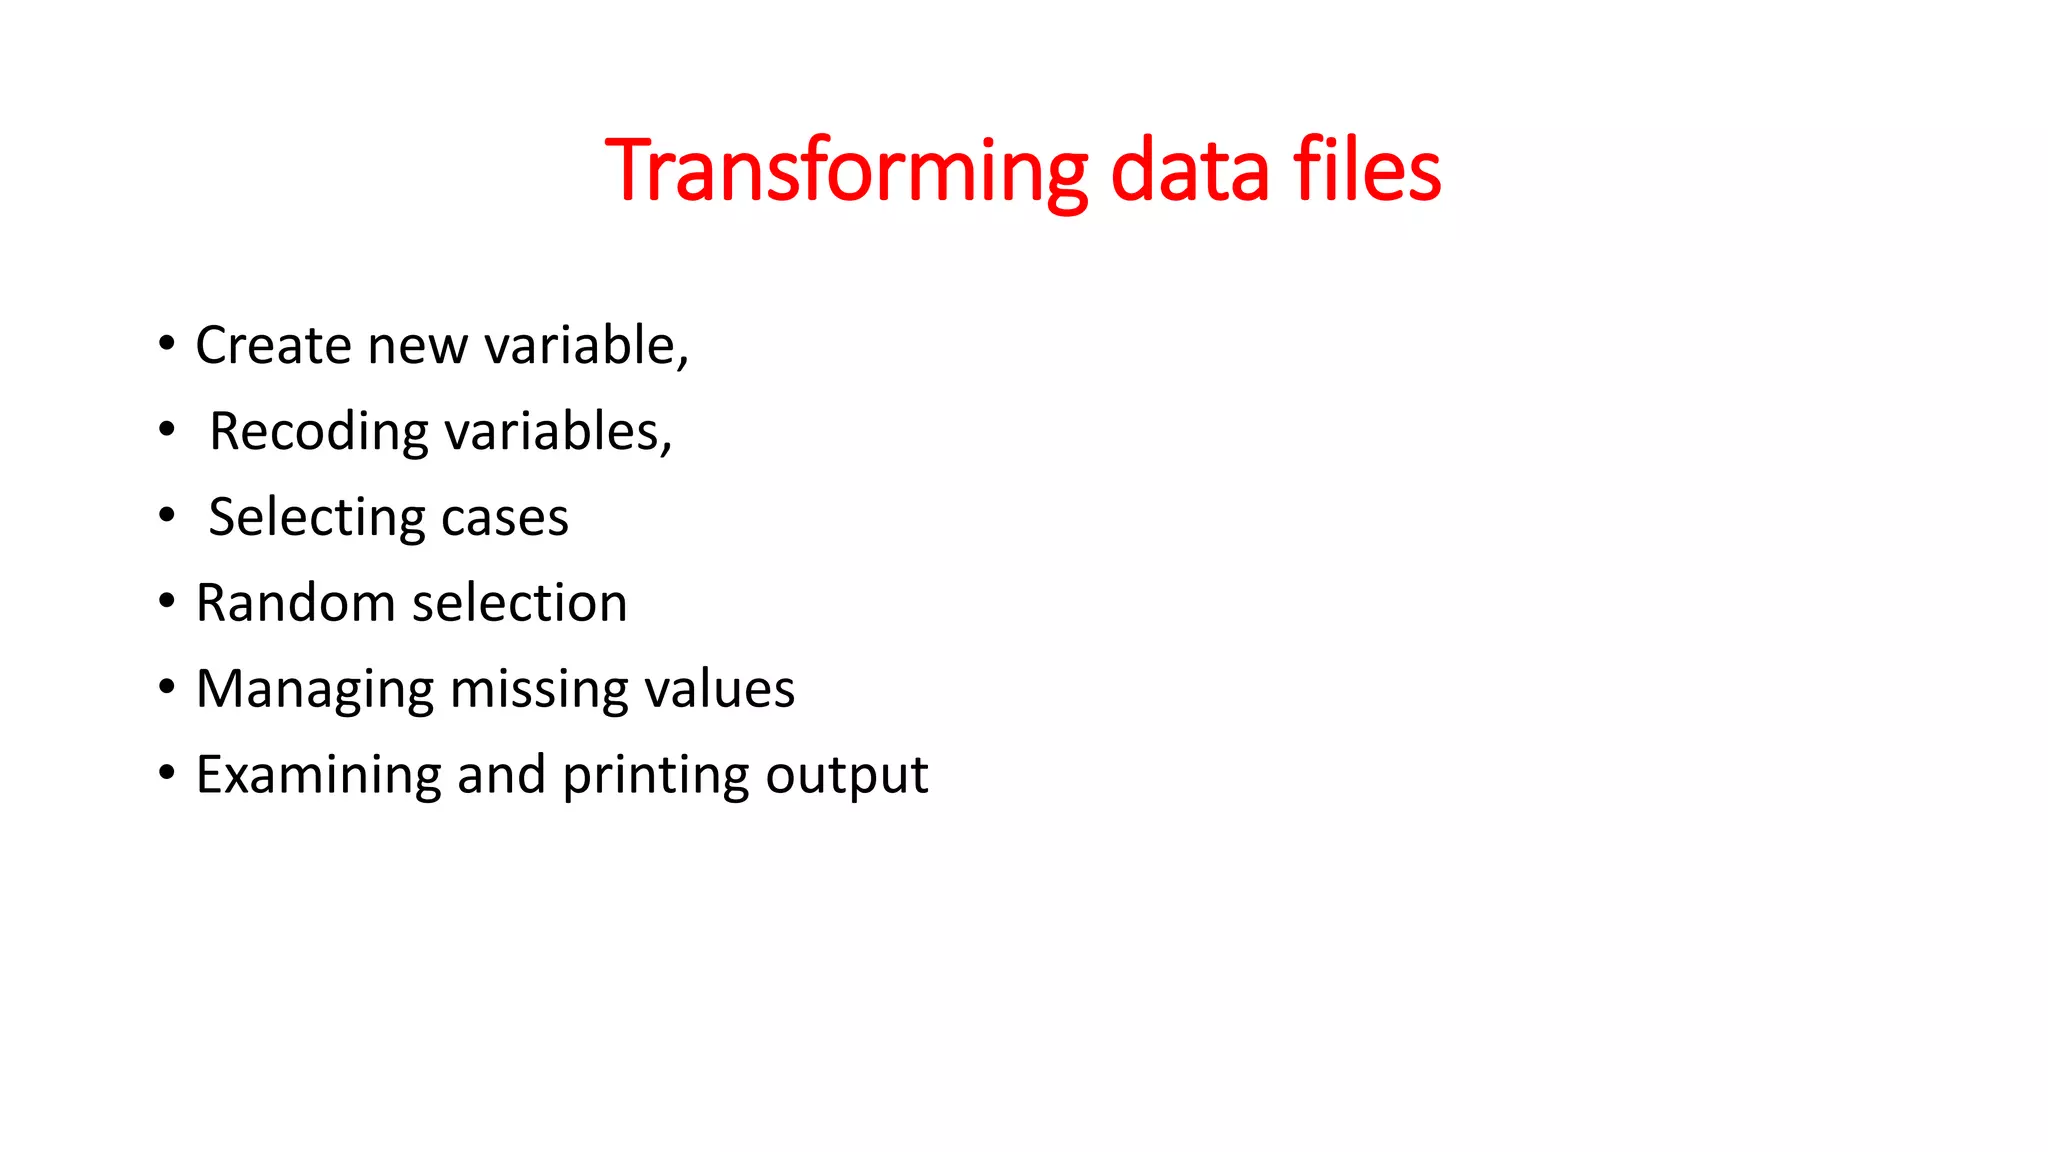
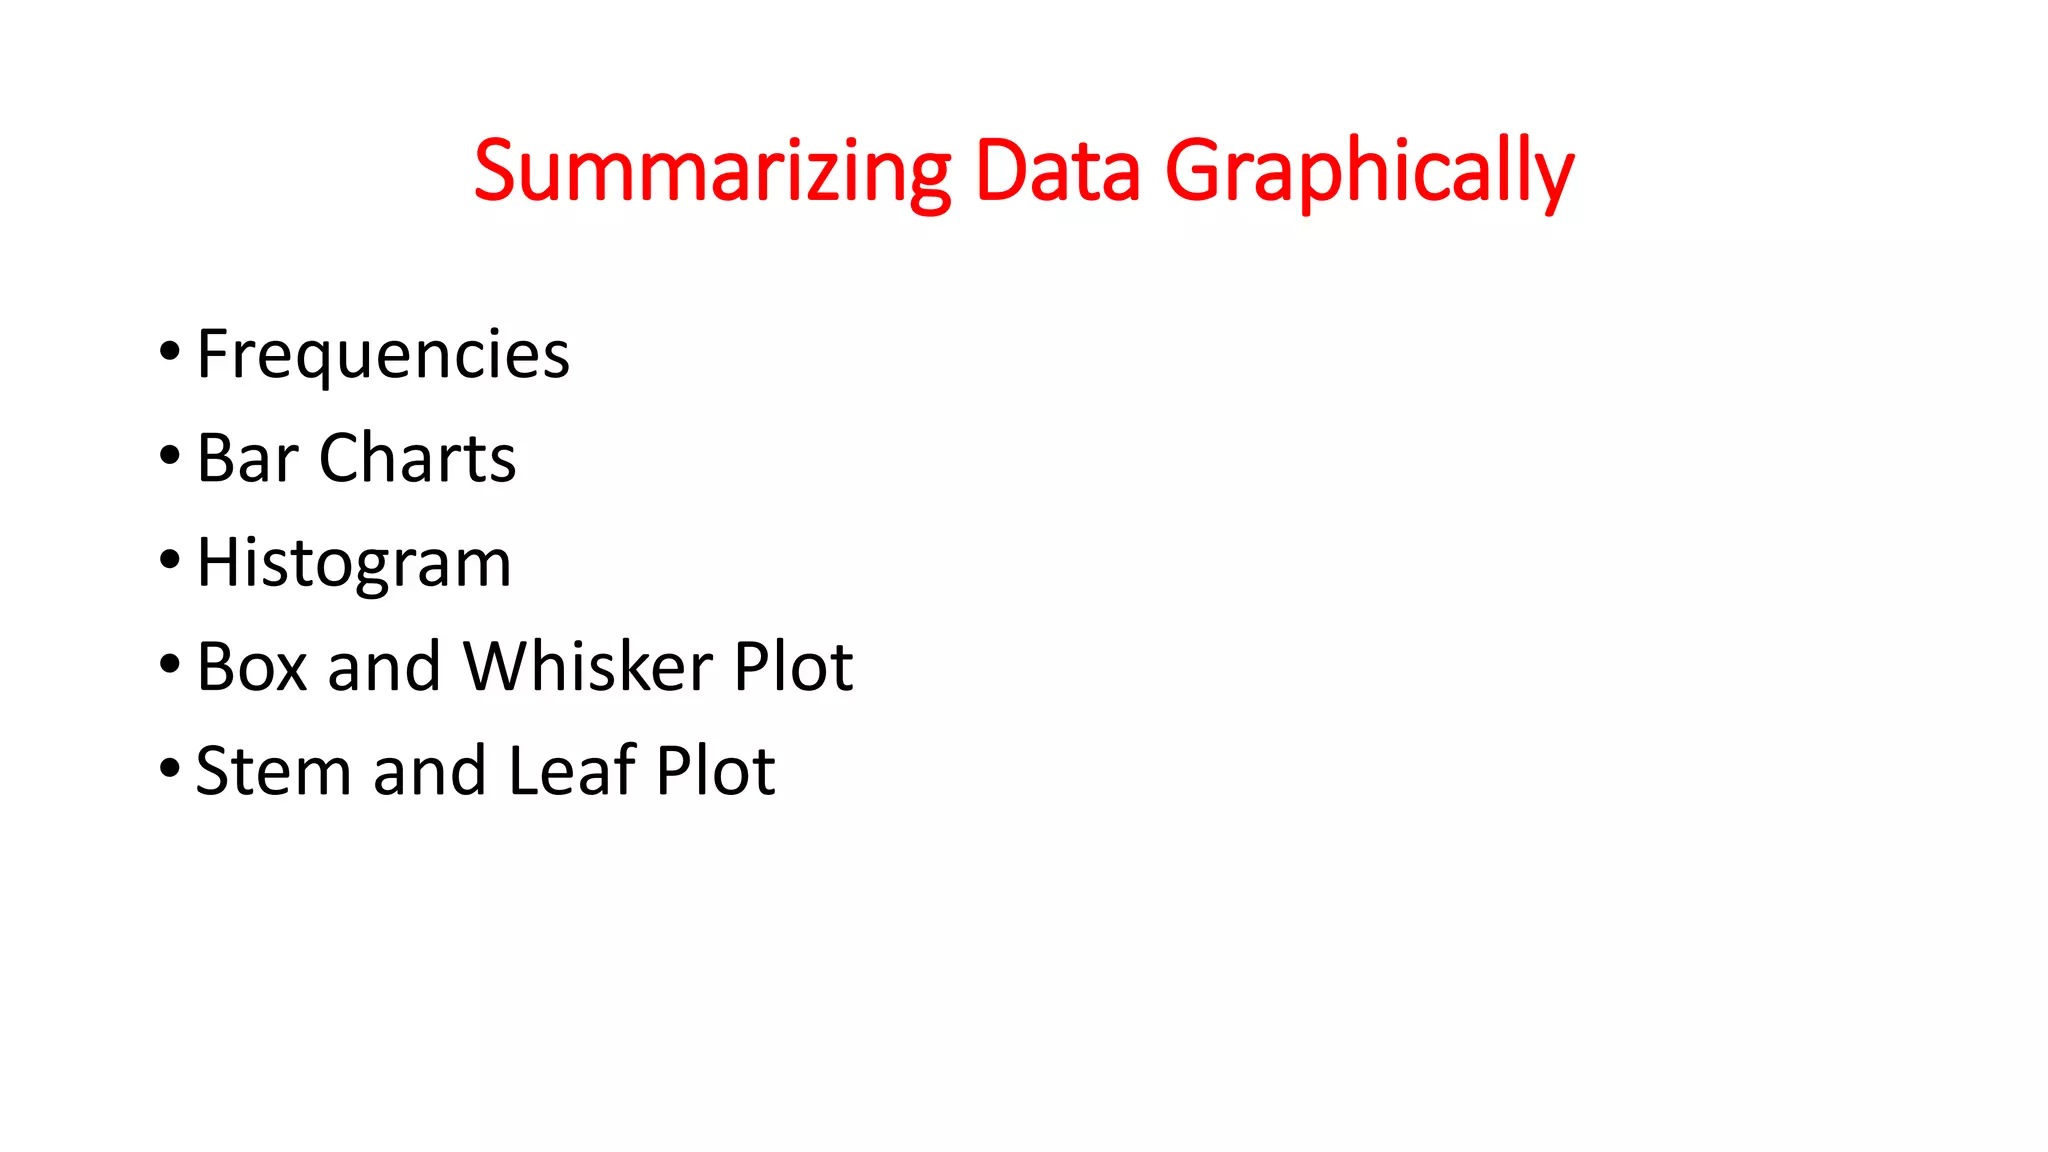

SPSS is a widely used statistical analysis program. It was originally developed in 1968 by Norman Nie and C. Hadlai Hull to analyze social science data. SPSS was later acquired by IBM in 2009. The main windows in SPSS are the Data Editor, Output Viewer, Chart Editor, and Syntax Editor. It has menus for File, Edit, View, Data, Transform, Analyze, Graphs, Utilities, and Help. SPSS allows users to manage data files, transform variables, summarize data graphically and numerically, and perform inferential statistics.