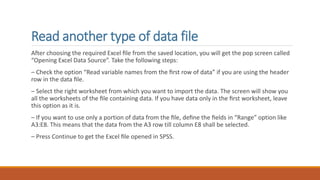
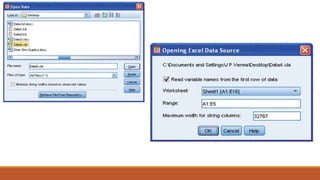
Introductionto SPSS
B Y: Vi n o d B a i t h a
CONTENT….
 What is SPSS
Steps in data analysis in SPSS
 Ways to analysis the data
Starting the SPSS
 Entering the data in SPSS :
- Defining the variable in SPSS
- Read another type of data file
What is SPSS?
 SPSS stands for Statistical package of sports sciences, it is a software package used for
statistical analysis of data in field of education, physical education, medical, market
etc. researches.
 Aside from statistical analysis the software also feature data management which
allow the user to create the variable, case selection, create a data drive and save it for
further analysis when needed.
 SPSS is beneficial for both qualitative and quantitative data equal importance has
been given to both data set, SPSS provide graphical representation and also an
appropriate result for data entered.
SPSS allow you to analysis the data using different kind of tests like t-test, z-test,
further you can use ANOVA, MANOVA etc. for further analysis of result.
Steps in Data Analysis in SPSS
I. Get your data into SPSS Statistics- SPSS can read data from a variety of
sources.
II. Prepare your data set for analysis- Set variable attributes, clean your
data and apply any needed transformations.
III. Select a procedure- Select a procedure from the menus to calculate
statistics or to create a chart.
IV. Select the variables for the analysis- The variables in the data file are
displayed in a dialog box for the procedure.
V. Run the procedure and look at the results- Results are displayed in the
Viewer.
WAYS TO ANALYSIS DATA
SPSS allow you to analysis the data in 3 ways:
1. Descriptive analysis: In SPSS we can use many descriptive statistics like mean,
median, mode, standard deviation etc. to describe the given data in form of
central tendency and range of variation.
2. Examine relationship between variable: SPSS allow the user to check the
relationship between 2 or more set of data by using correlation or regression
analysis.
3. Compare group of data: In SPSS we can compare the groups of data to
determine weather there is/are significant difference between those groups
by using parametric and non-parametric tests.
STARTING THE SPSS
After installing the SPSS successfully and running the program we introduce our self with data
editor window of SPSS, it has 2 mode namely data view and variable view:
Entering the data in SPSS
1. Open a previously saved statistical data file.
2. Enter your data directly. For entering the data directly in SPSS
We need to follow 2 steps: a) defining the variable
b) entering the data
3. Read another type of data file like spreadsheet, database,
Text data file or excel file.
Defining the Variable
In SPSS, before entering data, all the variables need to be defined in the Variable
View. Once Type in data option is selected, click the Variable View. This will allow
you to define all the variables in the SPSS.
For defining each variable we have to describe 10 characteristic of the variable
in different column provided in the variable view, each column have its own
characteristic and its limitations as described below:
- Column 1: In first column, short name of the variables are defined. The variable
name should essentially start with an alphabet and may use underscore and
numerals in between, without any gap. There should be no space between any
two characters of the variable name. Further, variable name should not be
started with numerals or any special character.
- Column 2: Under the column heading “Type,” format of the variable (numeric or nonnumeric)
and the number of digits before and after decimal are defined. This can be done by double-
clicking the concerned cell.
-Column 3: Under the column heading “Width,” number of digits a variable can have may be
altered.
-Column 4: In this column, number of decimal a variable can have may be altered.
-Column 5: Under the column heading “Label,” full name of the variable can be defined. The
user can take advantage of this facility to write the expanded name of the variable the way
one feels like.
- Column 6: Under the column heading “Values,” the coding of the variable may be defined by double
clicking the cell. Sometimes, the variable is of classificatory in nature. For example, if there is a choice of
choosing any one of the following four departments for training
(a) Production, (b) Marketing, (c) Human resource, (d) Public relation
then these departments can be coded as 1= production, 2= marketing, 3= human resource, and 4=public
relation. While entering data into the computer, these codes are entered, as per the response of a
particular subject. SPSS window showing the option for entering code has been shown here:
Column 7: In survey study, it is quite likely that for certain questions the respondent does not
reply, which creates the problem of missing value. Such missing value can be defined under
column heading “Missing.”
Column 8: Under the heading “Columns,” width of the column space where data is typed in Data
View is defined.
Column 9: Under the column heading “Align,” the alignment of data while feeding may be defined
as left, right, or center.
Column 10: Under the column heading “Measure,” the variable type may be defined as scale,
ordinal, or nominal.
Read another type of data file
After choosing the required Excel file from the saved location, you will get the pop screen called
“Opening Excel Data Source”. Take the following steps:
– Check the option “Read variable names from the first row of data” if you are using the header
row in the data file.
– Select the right worksheet from which you want to import the data. The screen will show you
all the worksheets of the file containing data. If you have data only in the first worksheet, leave
this option as it is.
– If you want to use only a portion of data from the file, define the fields in “Range” option like
A3:E8. This means that the data from the A3 row till column E8 shall be selected.
– Press Continue to get the Excel file opened in SPSS.
NOTE: TRY TO MAKE A DATA FILE FROM A DATA OF QUESTIONAIRE.

SPSS software

  • 1.
    Introductionto SPSS B Y:Vi n o d B a i t h a
  • 2.
    CONTENT….  What isSPSS Steps in data analysis in SPSS  Ways to analysis the data Starting the SPSS  Entering the data in SPSS : - Defining the variable in SPSS - Read another type of data file
  • 3.
    What is SPSS? SPSS stands for Statistical package of sports sciences, it is a software package used for statistical analysis of data in field of education, physical education, medical, market etc. researches.  Aside from statistical analysis the software also feature data management which allow the user to create the variable, case selection, create a data drive and save it for further analysis when needed.  SPSS is beneficial for both qualitative and quantitative data equal importance has been given to both data set, SPSS provide graphical representation and also an appropriate result for data entered. SPSS allow you to analysis the data using different kind of tests like t-test, z-test, further you can use ANOVA, MANOVA etc. for further analysis of result.
  • 4.
    Steps in DataAnalysis in SPSS I. Get your data into SPSS Statistics- SPSS can read data from a variety of sources. II. Prepare your data set for analysis- Set variable attributes, clean your data and apply any needed transformations. III. Select a procedure- Select a procedure from the menus to calculate statistics or to create a chart. IV. Select the variables for the analysis- The variables in the data file are displayed in a dialog box for the procedure. V. Run the procedure and look at the results- Results are displayed in the Viewer.
  • 5.
    WAYS TO ANALYSISDATA SPSS allow you to analysis the data in 3 ways: 1. Descriptive analysis: In SPSS we can use many descriptive statistics like mean, median, mode, standard deviation etc. to describe the given data in form of central tendency and range of variation. 2. Examine relationship between variable: SPSS allow the user to check the relationship between 2 or more set of data by using correlation or regression analysis. 3. Compare group of data: In SPSS we can compare the groups of data to determine weather there is/are significant difference between those groups by using parametric and non-parametric tests.
  • 6.
    STARTING THE SPSS Afterinstalling the SPSS successfully and running the program we introduce our self with data editor window of SPSS, it has 2 mode namely data view and variable view:
  • 8.
    Entering the datain SPSS 1. Open a previously saved statistical data file. 2. Enter your data directly. For entering the data directly in SPSS We need to follow 2 steps: a) defining the variable b) entering the data 3. Read another type of data file like spreadsheet, database, Text data file or excel file.
  • 9.
    Defining the Variable InSPSS, before entering data, all the variables need to be defined in the Variable View. Once Type in data option is selected, click the Variable View. This will allow you to define all the variables in the SPSS. For defining each variable we have to describe 10 characteristic of the variable in different column provided in the variable view, each column have its own characteristic and its limitations as described below: - Column 1: In first column, short name of the variables are defined. The variable name should essentially start with an alphabet and may use underscore and numerals in between, without any gap. There should be no space between any two characters of the variable name. Further, variable name should not be started with numerals or any special character.
  • 10.
    - Column 2:Under the column heading “Type,” format of the variable (numeric or nonnumeric) and the number of digits before and after decimal are defined. This can be done by double- clicking the concerned cell. -Column 3: Under the column heading “Width,” number of digits a variable can have may be altered. -Column 4: In this column, number of decimal a variable can have may be altered. -Column 5: Under the column heading “Label,” full name of the variable can be defined. The user can take advantage of this facility to write the expanded name of the variable the way one feels like.
  • 11.
    - Column 6:Under the column heading “Values,” the coding of the variable may be defined by double clicking the cell. Sometimes, the variable is of classificatory in nature. For example, if there is a choice of choosing any one of the following four departments for training (a) Production, (b) Marketing, (c) Human resource, (d) Public relation then these departments can be coded as 1= production, 2= marketing, 3= human resource, and 4=public relation. While entering data into the computer, these codes are entered, as per the response of a particular subject. SPSS window showing the option for entering code has been shown here:
  • 12.
    Column 7: Insurvey study, it is quite likely that for certain questions the respondent does not reply, which creates the problem of missing value. Such missing value can be defined under column heading “Missing.” Column 8: Under the heading “Columns,” width of the column space where data is typed in Data View is defined. Column 9: Under the column heading “Align,” the alignment of data while feeding may be defined as left, right, or center. Column 10: Under the column heading “Measure,” the variable type may be defined as scale, ordinal, or nominal.
  • 13.
    Read another typeof data file After choosing the required Excel file from the saved location, you will get the pop screen called “Opening Excel Data Source”. Take the following steps: – Check the option “Read variable names from the first row of data” if you are using the header row in the data file. – Select the right worksheet from which you want to import the data. The screen will show you all the worksheets of the file containing data. If you have data only in the first worksheet, leave this option as it is. – If you want to use only a portion of data from the file, define the fields in “Range” option like A3:E8. This means that the data from the A3 row till column E8 shall be selected. – Press Continue to get the Excel file opened in SPSS.
  • 15.
    NOTE: TRY TOMAKE A DATA FILE FROM A DATA OF QUESTIONAIRE.