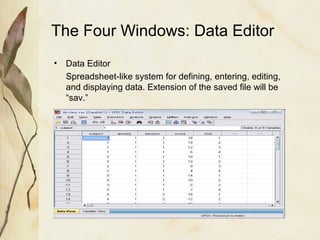
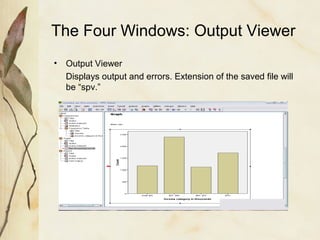
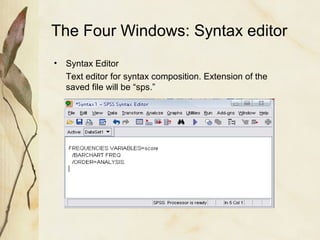
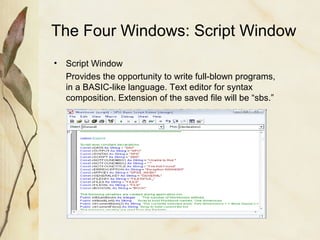
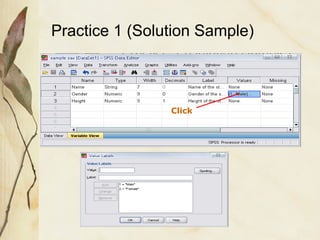
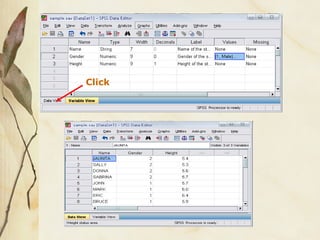
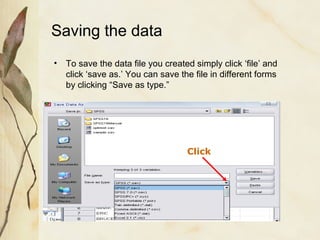
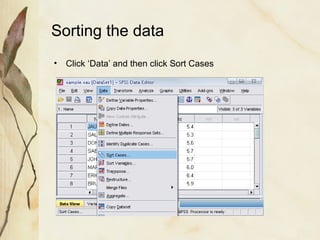
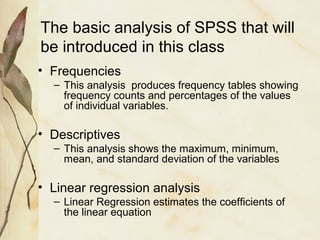
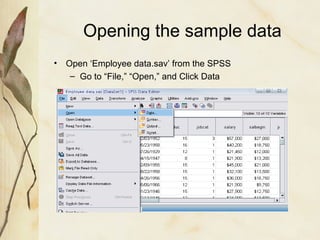
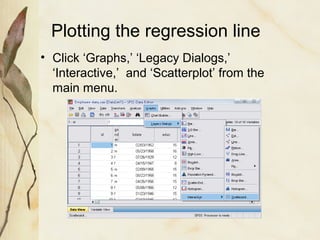
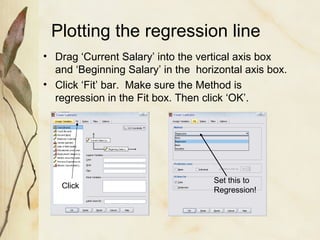
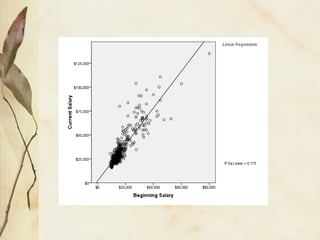
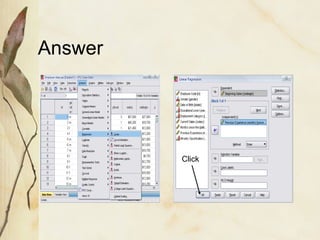
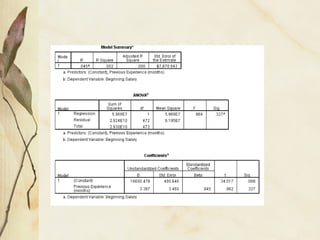
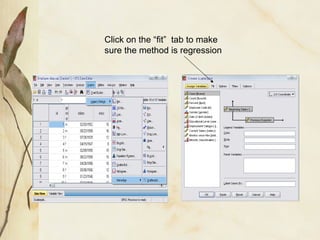
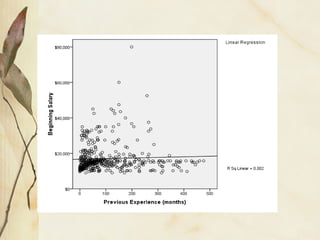
SlideShare a Scribd company logo
USES OF SPSS 
PACKAGE FOR DATA 
ANALYSIS 
PRESENTED BY 
MD.SHAHADAT HOSSEN 
BANGLADESH
Object of the Course 
• About the four-windows in SPSS 
• The basics of managing data files 
• The basic analysis in SPSS
Introduction: What is SPSS? 
• Originally it is an acronym of Statistical 
Package for the Social Science but now it 
stands for Statistical Product and Service 
Solutions 
• One of the most popular statistical 
packages which can perform highly 
complex data manipulation and analysis 
with simple instructions
The Four Windows: 
Data editor 
Output viewer 
Syntax editor 
Script window
The Four Windows: Data Editor 
• Data Editor 
Spreadsheet-like system for defining, entering, editing, 
and displaying data. Extension of the saved file will be 
“sav.”
The Four Windows: Output Viewer 
• Output Viewer 
Displays output and errors. Extension of the saved file will 
be “spv.”
The Four Windows: Syntax editor 
• Syntax Editor 
Text editor for syntax composition. Extension of the 
saved file will be “sps.”
The Four Windows: Script Window 
• Script Window 
Provides the opportunity to write full-blown programs, 
in a BASIC-like language. Text editor for syntax 
composition. Extension of the saved file will be “sbs.”
The basics of managing 
data files
Opening SPSS 
• Start → All Programs → SPSS Inc→ SPSS 16.0 → 
SPSS 16.0
Opening SPSS 
• The default window will have the data editor 
• There are two sheets in the window: 
1. Data view 2. Variable view
Data View window 
• The Data View window 
This sheet is visible when you first open the Data Editor 
and this sheet contains the data 
• Click on the tab labeled Variable View 
Click
Variable View window 
• This sheet contains information about the data set that is stored 
with the dataset 
• Name 
– The first character of the variable name must be alphabetic 
– Variable names must be unique, and have to be less than 64 
characters. 
– Spaces are NOT allowed.
Variable View window: Type 
• Type 
– Click on the ‘type’ box. The two basic types of variables 
that you will use are numeric and string. This column 
enables you to specify the type of variable.
Variable View window: Width 
• Width 
– Width allows you to determine the number of 
characters SPSS will allow to be entered for the 
variable
Variable View window: Decimals 
• Decimals 
– Number of decimals 
– It has to be less than or equal to 16 
3.14159265
Variable View window: Label 
• Label 
– You can specify the details of the variable 
– You can write characters with spaces up to 256 
characters
Variable View window: Values 
• Values 
– This is used and to suggest which 
numbers represent which categories when 
the variable represents a category
Defining the value labels 
• Click the cell in the values column as shown below 
• For the value, and the label, you can put up to 60 
characters. 
• After defining the values click add and then click OK. 
Click
Practice 1 
• How would you put the following information into 
SPSS? 
Name Gender Height 
JAUNITA 2 5.4 
SALLY 2 5.3 
DONNA 2 5.6 
SABRINA 2 5.7 
JOHN 1 5.7 
MARK 1 6 
ERIC 1 6.4 
BRUCE 1 5.9 
Value = 1 represents Male and Value = 2 represents Female
Practice 1 (Solution Sample) 
Click
Click
Saving the data 
• To save the data file you created simply click ‘file’ and 
click ‘save as.’ You can save the file in different forms 
by clicking “Save as type.” 
Click
Sorting the data 
• Click ‘Data’ and then click Sort Cases
Sorting the data (cont’d) 
• Double Click ‘Name of the students.’ Then click 
ok. 
Click 
Click
Practice 2 
• How would you sort the data by the 
‘Height’ of students in descending order? 
• Answer 
– Click data, sort cases, double click ‘height of 
students,’ click ‘descending,’ and finally click 
ok.
Transforming data 
• Click ‘Transform’ and then click ‘Compute Variable…’
Transforming data (cont’d) 
• Example: Adding a new variable named ‘lnheight’ which is 
the natural log of height 
– Type in lnheight in the ‘Target Variable’ box. Then type in 
‘ln(height)’ in the ‘Numeric Expression’ box. Click OK 
Click
Transforming data (cont’d) 
• A new variable ‘lnheight’ is added to the table
Practice 3 
• Create a new variable named “sqrtheight” 
which is the square root of height. 
• Answer
The basic analysis
The basic analysis of SPSS that will 
be introduced in this class 
• Frequencies 
– This analysis produces frequency tables showing 
frequency counts and percentages of the values 
of individual variables. 
• Descriptives 
– This analysis shows the maximum, minimum, 
mean, and standard deviation of the variables 
• Linear regression analysis 
– Linear Regression estimates the coefficients of 
the linear equation
Opening the sample data 
• Open ‘Employee data.sav’ from the SPSS 
– Go to “File,” “Open,” and Click Data
Opening the sample data 
• Go to Program Files,” “SPSSInc,” “SPSS16,” and 
“Samples” folder. 
• Open “Employee Data.sav” file
Frequencies 
• Click ‘Analyze,’ ‘Descriptive statistics,’ then 
click ‘Frequencies’
Frequencies 
• Click gender and put it into the variable box. 
• Click ‘Charts.’ 
• Then click ‘Bar charts’ and click ‘Continue.’ 
Click Click
Frequencies 
• Finally Click OK in the Frequencies box. 
Click
Using the Syntax editor 
• Click ‘Analyze,’ ‘Descriptive statistics,’ then 
click ‘Frequencies.’ 
• Put ‘Gender’ in the Variable(s) box. 
• Then click ‘Charts,’ ‘Bar charts,’ and click 
‘Continue.’ 
• Click ‘Paste.’ 
Click
Using the Syntax editor 
• Highlight the commands in the Syntax editor 
and then click the run icon. 
• You can do the same thing by right clicking the 
highlighted area and then by clicking ‘Run 
Current’ 
Click 
Right 
Click!
Practice 4 
• Do a frequency analysis on the 
variable “minority” 
• Create pie charts for it 
• Do the same analysis using the 
syntax editor
Answer 
Click
Descriptives 
• Click ‘Analyze,’ ‘Descriptive statistics,’ then 
click ‘Descriptives…’ 
• Click ‘Educational level’ and ‘Beginning 
Salary,’ and put it into the variable box. 
• Click Options 
Click
Descriptives 
• The options allows you to analyze other 
descriptive statistics besides the mean and Std. 
• Click ‘variance’ and ‘kurtosis’ 
• Finally click ‘Continue’ 
Click 
Click
Descriptives 
• Finally Click OK in the Descriptives box. You will 
be able to see the result of the analysis.
Regression Analysis 
• Click ‘Analyze,’ ‘Regression,’ then click 
‘Linear’ from the main menu.
Regression Analysis 
salbegin =b +b edu +e 0 1 
• For example let’s analyze the model 
• Put ‘Beginning Salary’ as Dependent and ‘Educational Level’ as 
Independent. 
Click Click
Regression Analysis 
• Clicking OK gives the result
Plotting the regression line 
• Click ‘Graphs,’ ‘Legacy Dialogs,’ 
‘Interactive,’ and ‘Scatterplot’ from the 
main menu.
Plotting the regression line 
• Drag ‘Current Salary’ into the vertical axis box 
and ‘Beginning Salary’ in the horizontal axis box. 
• Click ‘Fit’ bar. Make sure the Method is 
regression in the Fit box. Then click ‘OK’. 
Click Set this to 
Regression!
Practice 5 
• Find out whether or not the previous 
experience of workers has any affect 
on their beginning salary? 
– Take the variable “salbegin,” and 
“prevexp” as dependent and independent 
variables respectively. 
• Plot the regression line for the above 
analysis using the “scatter plot” menu.
Answer 
Click
Click on the “fit” tab to make 
sure the method is regression
CONCLUSION 
• SPSS for windows is a computer package 
that will perform a wide variety of 
statistical procedures. 
• Data management and analysis can be 
handled well with SPSS. 
• Using SPSS we can manipulate data, make 
graphs and perform statistical techniques 
varying from means to regression.
REFERENCES 
. http://en.allexperts.com/q/Management-Consulting-2802 
http://www.icmrindia.org 
Harvard Business Review - April 2009 
www.coolavenue.com 
www2.advisorworks.com. February 28, 2000. 
Baylogic. "Net History and Statistics." www.baylogic.com. February 28, 
2000. 
Berners-Lee, Tim. (1996) "Passing up Fortune-Building 'To Do the 
Revolution Right'." Investor's Business Daily 13(43)(June 7):1-2. 
Reidelbach, Dorothy. (1996 Planning for Higher Education24 (Spring):1- 
6. 
Ricart, Glenn. (2000). "Unofficial Technology Marvel of the 
Millennium." Educause ReviewJanuary/February: 38-59.
THANK YOU

More Related Content

What's hot

Statistical Package for Social Science (SPSS)
Statistical Package for Social Science (SPSS)Statistical Package for Social Science (SPSS)
Statistical Package for Social Science (SPSS)
sspink
 
Introduction to spss 2
Introduction to spss 2Introduction to spss 2
Introduction to spss 2
Michael Taiwo
 
Spss
SpssSpss
Spss
Tech_MX
 
Introduction To SPSS
Introduction To SPSSIntroduction To SPSS
Introduction To SPSS
ThankGod Damion Okpe
 
An introduction to spss
An introduction to spssAn introduction to spss
An introduction to spss
zeeshanwrch
 
Presentation on spss
Presentation on spssPresentation on spss
Presentation on spss
alfiyajamalcj
 
Spss guidelines
Spss guidelinesSpss guidelines
Spss guidelines
APPOLINAIRE BIZIMANA
 
SPSS
SPSSSPSS
Spss
SpssSpss
اىفناىنمفبانفيا
اىفناىنمفبانفيااىفناىنمفبانفيا
اىفناىنمفبانفيا
Bisan Rjoub
 
RSS 2012 Data Entry SPSS
RSS 2012 Data Entry SPSSRSS 2012 Data Entry SPSS
RSS 2012 Data Entry SPSS
Wesam Abuznadah
 
Spss lecture notes
Spss lecture notesSpss lecture notes
Spss lecture notes
David mbwiga
 
Spss tutorial 1
Spss tutorial 1Spss tutorial 1
Spss tutorial 1
kunkumabala
 
Data analysis using spss
Data analysis using spssData analysis using spss
Data analysis using spss
Syed Faisal
 
SPSS introduction Presentation
SPSS introduction Presentation SPSS introduction Presentation
SPSS introduction Presentation
befikra
 
Measurement of scales
Measurement of scalesMeasurement of scales
Measurement of scales
AkifIshaque
 
Introduction To Spss - Opening Data File and Descriptive Analysis
Introduction To Spss - Opening Data File and Descriptive AnalysisIntroduction To Spss - Opening Data File and Descriptive Analysis
Introduction To Spss - Opening Data File and Descriptive Analysis
Dr Ali Yusob Md Zain
 
Spss
SpssSpss
SPSS-SYNTAX
SPSS-SYNTAXSPSS-SYNTAX
SPSS-SYNTAX
D Dutta Roy
 
Basic guide to SPSS
Basic guide to SPSSBasic guide to SPSS
Basic guide to SPSS
paul_gorman
 

What's hot (20)

Statistical Package for Social Science (SPSS)
Statistical Package for Social Science (SPSS)Statistical Package for Social Science (SPSS)
Statistical Package for Social Science (SPSS)
 
Introduction to spss 2
Introduction to spss 2Introduction to spss 2
Introduction to spss 2
 
Spss
SpssSpss
Spss
 
Introduction To SPSS
Introduction To SPSSIntroduction To SPSS
Introduction To SPSS
 
An introduction to spss
An introduction to spssAn introduction to spss
An introduction to spss
 
Presentation on spss
Presentation on spssPresentation on spss
Presentation on spss
 
Spss guidelines
Spss guidelinesSpss guidelines
Spss guidelines
 
SPSS
SPSSSPSS
SPSS
 
Spss
SpssSpss
Spss
 
اىفناىنمفبانفيا
اىفناىنمفبانفيااىفناىنمفبانفيا
اىفناىنمفبانفيا
 
RSS 2012 Data Entry SPSS
RSS 2012 Data Entry SPSSRSS 2012 Data Entry SPSS
RSS 2012 Data Entry SPSS
 
Spss lecture notes
Spss lecture notesSpss lecture notes
Spss lecture notes
 
Spss tutorial 1
Spss tutorial 1Spss tutorial 1
Spss tutorial 1
 
Data analysis using spss
Data analysis using spssData analysis using spss
Data analysis using spss
 
SPSS introduction Presentation
SPSS introduction Presentation SPSS introduction Presentation
SPSS introduction Presentation
 
Measurement of scales
Measurement of scalesMeasurement of scales
Measurement of scales
 
Introduction To Spss - Opening Data File and Descriptive Analysis
Introduction To Spss - Opening Data File and Descriptive AnalysisIntroduction To Spss - Opening Data File and Descriptive Analysis
Introduction To Spss - Opening Data File and Descriptive Analysis
 
Spss
SpssSpss
Spss
 
SPSS-SYNTAX
SPSS-SYNTAXSPSS-SYNTAX
SPSS-SYNTAX
 
Basic guide to SPSS
Basic guide to SPSSBasic guide to SPSS
Basic guide to SPSS
 

Similar to Spss (1)

spss intro.ppt
spss intro.pptspss intro.ppt
spss intro.ppt
KENNEDY GITHAIGA
 
An introduction to spss
An introduction to spssAn introduction to spss
An introduction to spss
Shahbaz Alam
 
Spss intro for engineering
Spss intro for engineeringSpss intro for engineering
Spss intro for engineering
Mahendra Poudel
 
Beginners SPSS.ppt
Beginners SPSS.pptBeginners SPSS.ppt
Beginners SPSS.ppt
sayahuwaina
 
Introduction to the Research Method and SPSS
Introduction to the Research Method and SPSS Introduction to the Research Method and SPSS
Introduction to the Research Method and SPSS
emuptv
 
data analysis techniques and statistical softwares
data analysis techniques and statistical softwaresdata analysis techniques and statistical softwares
data analysis techniques and statistical softwares
Dr.ammara khakwani
 
Spss by vijay ambast
Spss by vijay ambastSpss by vijay ambast
Spss by vijay ambast
Vijay Ambast
 
Introduction to spss 1
Introduction to spss 1Introduction to spss 1
Introduction to spss 1
Michael Taiwo
 
SPSS: Quick Look
SPSS: Quick LookSPSS: Quick Look
SPSS: Quick Look
DataminingTools Inc
 
4 Statistical Software.pptx
4 Statistical Software.pptx4 Statistical Software.pptx
4 Statistical Software.pptx
kaleabtegegne
 
Introduction - Using Stata
Introduction - Using StataIntroduction - Using Stata
Introduction - Using Stata
Ryan Herzog
 
SPSS :Introduction for beginners
SPSS :Introduction for beginners SPSS :Introduction for beginners
SPSS :Introduction for beginners
PRAKASAM C P
 
SPSS.pptx(unit 4).pptx
SPSS.pptx(unit 4).pptxSPSS.pptx(unit 4).pptx
SPSS.pptx(unit 4).pptx
JOSEPHINELENTAF
 
Introduction to spss
Introduction to spssIntroduction to spss
Introduction to spss
Subodh Khanal
 
BAEB601 Chapter 4: Findings, Analysis, and SPSS
BAEB601 Chapter 4: Findings, Analysis, and SPSSBAEB601 Chapter 4: Findings, Analysis, and SPSS
BAEB601 Chapter 4: Findings, Analysis, and SPSS
Dr Nur Suhaili Ramli
 
L9 using datawarrior for scientific data visualization
L9 using datawarrior for scientific data visualizationL9 using datawarrior for scientific data visualization
L9 using datawarrior for scientific data visualization
Seppo Karrila
 
Minitab Seminar1.pptx
Minitab Seminar1.pptxMinitab Seminar1.pptx
Minitab Seminar1.pptx
DrMohammedFKadhim
 
Spss basic Dr Marwa Zalat
Spss basic Dr Marwa ZalatSpss basic Dr Marwa Zalat
Spss basic Dr Marwa Zalat
Marwa Zalat
 
Data Coding and Data Management using SPSS
Data Coding and Data Management using SPSSData Coding and Data Management using SPSS
Data Coding and Data Management using SPSS
Melba Shaya Sweety
 
5116427.ppt
5116427.ppt5116427.ppt
5116427.ppt
BAGARAGAZAROMUALD2
 

Similar to Spss (1) (20)

spss intro.ppt
spss intro.pptspss intro.ppt
spss intro.ppt
 
An introduction to spss
An introduction to spssAn introduction to spss
An introduction to spss
 
Spss intro for engineering
Spss intro for engineeringSpss intro for engineering
Spss intro for engineering
 
Beginners SPSS.ppt
Beginners SPSS.pptBeginners SPSS.ppt
Beginners SPSS.ppt
 
Introduction to the Research Method and SPSS
Introduction to the Research Method and SPSS Introduction to the Research Method and SPSS
Introduction to the Research Method and SPSS
 
data analysis techniques and statistical softwares
data analysis techniques and statistical softwaresdata analysis techniques and statistical softwares
data analysis techniques and statistical softwares
 
Spss by vijay ambast
Spss by vijay ambastSpss by vijay ambast
Spss by vijay ambast
 
Introduction to spss 1
Introduction to spss 1Introduction to spss 1
Introduction to spss 1
 
SPSS: Quick Look
SPSS: Quick LookSPSS: Quick Look
SPSS: Quick Look
 
4 Statistical Software.pptx
4 Statistical Software.pptx4 Statistical Software.pptx
4 Statistical Software.pptx
 
Introduction - Using Stata
Introduction - Using StataIntroduction - Using Stata
Introduction - Using Stata
 
SPSS :Introduction for beginners
SPSS :Introduction for beginners SPSS :Introduction for beginners
SPSS :Introduction for beginners
 
SPSS.pptx(unit 4).pptx
SPSS.pptx(unit 4).pptxSPSS.pptx(unit 4).pptx
SPSS.pptx(unit 4).pptx
 
Introduction to spss
Introduction to spssIntroduction to spss
Introduction to spss
 
BAEB601 Chapter 4: Findings, Analysis, and SPSS
BAEB601 Chapter 4: Findings, Analysis, and SPSSBAEB601 Chapter 4: Findings, Analysis, and SPSS
BAEB601 Chapter 4: Findings, Analysis, and SPSS
 
L9 using datawarrior for scientific data visualization
L9 using datawarrior for scientific data visualizationL9 using datawarrior for scientific data visualization
L9 using datawarrior for scientific data visualization
 
Minitab Seminar1.pptx
Minitab Seminar1.pptxMinitab Seminar1.pptx
Minitab Seminar1.pptx
 
Spss basic Dr Marwa Zalat
Spss basic Dr Marwa ZalatSpss basic Dr Marwa Zalat
Spss basic Dr Marwa Zalat
 
Data Coding and Data Management using SPSS
Data Coding and Data Management using SPSSData Coding and Data Management using SPSS
Data Coding and Data Management using SPSS
 
5116427.ppt
5116427.ppt5116427.ppt
5116427.ppt
 

Recently uploaded

Role of Information Technology in Revenue - Prof Oyedokun.pptx
Role of Information Technology in Revenue  - Prof Oyedokun.pptxRole of Information Technology in Revenue  - Prof Oyedokun.pptx
Role of Information Technology in Revenue - Prof Oyedokun.pptx
Godwin Emmanuel Oyedokun MBA MSc PhD FCA FCTI FCNA CFE FFAR
 
Eco-Innovations and Firm Heterogeneity. Evidence from Italian Family and Nonf...
Eco-Innovations and Firm Heterogeneity.Evidence from Italian Family and Nonf...Eco-Innovations and Firm Heterogeneity.Evidence from Italian Family and Nonf...
Eco-Innovations and Firm Heterogeneity. Evidence from Italian Family and Nonf...
University of Calabria
 
SWAIAP Fraud Risk Mitigation Prof Oyedokun.pptx
SWAIAP Fraud Risk Mitigation   Prof Oyedokun.pptxSWAIAP Fraud Risk Mitigation   Prof Oyedokun.pptx
SWAIAP Fraud Risk Mitigation Prof Oyedokun.pptx
Godwin Emmanuel Oyedokun MBA MSc PhD FCA FCTI FCNA CFE FFAR
 
Bridging the gap: Online job postings, survey data and the assessment of job ...
Bridging the gap: Online job postings, survey data and the assessment of job ...Bridging the gap: Online job postings, survey data and the assessment of job ...
Bridging the gap: Online job postings, survey data and the assessment of job ...
Labour Market Information Council | Conseil de l’information sur le marché du travail
 
What's a worker’s market? Job quality and labour market tightness
What's a worker’s market? Job quality and labour market tightnessWhat's a worker’s market? Job quality and labour market tightness
What's a worker’s market? Job quality and labour market tightness
Labour Market Information Council | Conseil de l’information sur le marché du travail
 
Instant Issue Debit Cards - School Designs
Instant Issue Debit Cards - School DesignsInstant Issue Debit Cards - School Designs
Instant Issue Debit Cards - School Designs
egoetzinger
 
Donald Trump Presentation and his life.pptx
Donald Trump Presentation and his life.pptxDonald Trump Presentation and his life.pptx
Donald Trump Presentation and his life.pptx
SerdarHudaykuliyew
 
Instant Issue Debit Cards
Instant Issue Debit CardsInstant Issue Debit Cards
Instant Issue Debit Cards
egoetzinger
 
Introduction to Value Added Tax System.ppt
Introduction to Value Added Tax System.pptIntroduction to Value Added Tax System.ppt
Introduction to Value Added Tax System.ppt
VishnuVenugopal84
 
DEMAND AND SUPPLY.docx Notes for Economics
DEMAND AND SUPPLY.docx Notes for EconomicsDEMAND AND SUPPLY.docx Notes for Economics
DEMAND AND SUPPLY.docx Notes for Economics
Opanga1
 
在线办理(GU毕业证书)美国贡萨加大学毕业证学历证书一模一样
在线办理(GU毕业证书)美国贡萨加大学毕业证学历证书一模一样在线办理(GU毕业证书)美国贡萨加大学毕业证学历证书一模一样
在线办理(GU毕业证书)美国贡萨加大学毕业证学历证书一模一样
5spllj1l
 
G20 summit held in India. Proper presentation for G20 summit
G20 summit held in India. Proper presentation for G20 summitG20 summit held in India. Proper presentation for G20 summit
G20 summit held in India. Proper presentation for G20 summit
rohitsaxena882511
 
Abhay Bhutada Leads Poonawalla Fincorp To Record Low NPA And Unprecedented Gr...
Abhay Bhutada Leads Poonawalla Fincorp To Record Low NPA And Unprecedented Gr...Abhay Bhutada Leads Poonawalla Fincorp To Record Low NPA And Unprecedented Gr...
Abhay Bhutada Leads Poonawalla Fincorp To Record Low NPA And Unprecedented Gr...
Vighnesh Shashtri
 
Applying the Global Internal Audit Standards_AIS.pdf
Applying the Global Internal Audit Standards_AIS.pdfApplying the Global Internal Audit Standards_AIS.pdf
Applying the Global Internal Audit Standards_AIS.pdf
alexiusbrian1
 
Independent Study - College of Wooster Research (2023-2024) FDI, Culture, Glo...
Independent Study - College of Wooster Research (2023-2024) FDI, Culture, Glo...Independent Study - College of Wooster Research (2023-2024) FDI, Culture, Glo...
Independent Study - College of Wooster Research (2023-2024) FDI, Culture, Glo...
AntoniaOwensDetwiler
 
BONKMILLON Unleashes Its Bonkers Potential on Solana.pdf
BONKMILLON Unleashes Its Bonkers Potential on Solana.pdfBONKMILLON Unleashes Its Bonkers Potential on Solana.pdf
BONKMILLON Unleashes Its Bonkers Potential on Solana.pdf
coingabbar
 
An Overview of the Prosocial dHEDGE Vault works
An Overview of the Prosocial dHEDGE Vault worksAn Overview of the Prosocial dHEDGE Vault works
An Overview of the Prosocial dHEDGE Vault works
Colin R. Turner
 
falcon-invoice-discounting-a-strategic-approach-to-optimize-investments
falcon-invoice-discounting-a-strategic-approach-to-optimize-investmentsfalcon-invoice-discounting-a-strategic-approach-to-optimize-investments
falcon-invoice-discounting-a-strategic-approach-to-optimize-investments
Falcon Invoice Discounting
 
Sources of Revenue for State Government - Prof Oyedokun.pptx
Sources of Revenue for State Government - Prof Oyedokun.pptxSources of Revenue for State Government - Prof Oyedokun.pptx
Sources of Revenue for State Government - Prof Oyedokun.pptx
Godwin Emmanuel Oyedokun MBA MSc PhD FCA FCTI FCNA CFE FFAR
 
2. Elemental Economics - Mineral demand.pdf
2. Elemental Economics - Mineral demand.pdf2. Elemental Economics - Mineral demand.pdf
2. Elemental Economics - Mineral demand.pdf
Neal Brewster
 

Recently uploaded (20)

Role of Information Technology in Revenue - Prof Oyedokun.pptx
Role of Information Technology in Revenue  - Prof Oyedokun.pptxRole of Information Technology in Revenue  - Prof Oyedokun.pptx
Role of Information Technology in Revenue - Prof Oyedokun.pptx
 
Eco-Innovations and Firm Heterogeneity. Evidence from Italian Family and Nonf...
Eco-Innovations and Firm Heterogeneity.Evidence from Italian Family and Nonf...Eco-Innovations and Firm Heterogeneity.Evidence from Italian Family and Nonf...
Eco-Innovations and Firm Heterogeneity. Evidence from Italian Family and Nonf...
 
SWAIAP Fraud Risk Mitigation Prof Oyedokun.pptx
SWAIAP Fraud Risk Mitigation   Prof Oyedokun.pptxSWAIAP Fraud Risk Mitigation   Prof Oyedokun.pptx
SWAIAP Fraud Risk Mitigation Prof Oyedokun.pptx
 
Bridging the gap: Online job postings, survey data and the assessment of job ...
Bridging the gap: Online job postings, survey data and the assessment of job ...Bridging the gap: Online job postings, survey data and the assessment of job ...
Bridging the gap: Online job postings, survey data and the assessment of job ...
 
What's a worker’s market? Job quality and labour market tightness
What's a worker’s market? Job quality and labour market tightnessWhat's a worker’s market? Job quality and labour market tightness
What's a worker’s market? Job quality and labour market tightness
 
Instant Issue Debit Cards - School Designs
Instant Issue Debit Cards - School DesignsInstant Issue Debit Cards - School Designs
Instant Issue Debit Cards - School Designs
 
Donald Trump Presentation and his life.pptx
Donald Trump Presentation and his life.pptxDonald Trump Presentation and his life.pptx
Donald Trump Presentation and his life.pptx
 
Instant Issue Debit Cards
Instant Issue Debit CardsInstant Issue Debit Cards
Instant Issue Debit Cards
 
Introduction to Value Added Tax System.ppt
Introduction to Value Added Tax System.pptIntroduction to Value Added Tax System.ppt
Introduction to Value Added Tax System.ppt
 
DEMAND AND SUPPLY.docx Notes for Economics
DEMAND AND SUPPLY.docx Notes for EconomicsDEMAND AND SUPPLY.docx Notes for Economics
DEMAND AND SUPPLY.docx Notes for Economics
 
在线办理(GU毕业证书)美国贡萨加大学毕业证学历证书一模一样
在线办理(GU毕业证书)美国贡萨加大学毕业证学历证书一模一样在线办理(GU毕业证书)美国贡萨加大学毕业证学历证书一模一样
在线办理(GU毕业证书)美国贡萨加大学毕业证学历证书一模一样
 
G20 summit held in India. Proper presentation for G20 summit
G20 summit held in India. Proper presentation for G20 summitG20 summit held in India. Proper presentation for G20 summit
G20 summit held in India. Proper presentation for G20 summit
 
Abhay Bhutada Leads Poonawalla Fincorp To Record Low NPA And Unprecedented Gr...
Abhay Bhutada Leads Poonawalla Fincorp To Record Low NPA And Unprecedented Gr...Abhay Bhutada Leads Poonawalla Fincorp To Record Low NPA And Unprecedented Gr...
Abhay Bhutada Leads Poonawalla Fincorp To Record Low NPA And Unprecedented Gr...
 
Applying the Global Internal Audit Standards_AIS.pdf
Applying the Global Internal Audit Standards_AIS.pdfApplying the Global Internal Audit Standards_AIS.pdf
Applying the Global Internal Audit Standards_AIS.pdf
 
Independent Study - College of Wooster Research (2023-2024) FDI, Culture, Glo...
Independent Study - College of Wooster Research (2023-2024) FDI, Culture, Glo...Independent Study - College of Wooster Research (2023-2024) FDI, Culture, Glo...
Independent Study - College of Wooster Research (2023-2024) FDI, Culture, Glo...
 
BONKMILLON Unleashes Its Bonkers Potential on Solana.pdf
BONKMILLON Unleashes Its Bonkers Potential on Solana.pdfBONKMILLON Unleashes Its Bonkers Potential on Solana.pdf
BONKMILLON Unleashes Its Bonkers Potential on Solana.pdf
 
An Overview of the Prosocial dHEDGE Vault works
An Overview of the Prosocial dHEDGE Vault worksAn Overview of the Prosocial dHEDGE Vault works
An Overview of the Prosocial dHEDGE Vault works
 
falcon-invoice-discounting-a-strategic-approach-to-optimize-investments
falcon-invoice-discounting-a-strategic-approach-to-optimize-investmentsfalcon-invoice-discounting-a-strategic-approach-to-optimize-investments
falcon-invoice-discounting-a-strategic-approach-to-optimize-investments
 
Sources of Revenue for State Government - Prof Oyedokun.pptx
Sources of Revenue for State Government - Prof Oyedokun.pptxSources of Revenue for State Government - Prof Oyedokun.pptx
Sources of Revenue for State Government - Prof Oyedokun.pptx
 
2. Elemental Economics - Mineral demand.pdf
2. Elemental Economics - Mineral demand.pdf2. Elemental Economics - Mineral demand.pdf
2. Elemental Economics - Mineral demand.pdf
 

Spss (1)

  • 1. USES OF SPSS PACKAGE FOR DATA ANALYSIS PRESENTED BY MD.SHAHADAT HOSSEN BANGLADESH
  • 2. Object of the Course • About the four-windows in SPSS • The basics of managing data files • The basic analysis in SPSS
  • 3. Introduction: What is SPSS? • Originally it is an acronym of Statistical Package for the Social Science but now it stands for Statistical Product and Service Solutions • One of the most popular statistical packages which can perform highly complex data manipulation and analysis with simple instructions
  • 4. The Four Windows: Data editor Output viewer Syntax editor Script window
  • 5. The Four Windows: Data Editor • Data Editor Spreadsheet-like system for defining, entering, editing, and displaying data. Extension of the saved file will be “sav.”
  • 6. The Four Windows: Output Viewer • Output Viewer Displays output and errors. Extension of the saved file will be “spv.”
  • 7. The Four Windows: Syntax editor • Syntax Editor Text editor for syntax composition. Extension of the saved file will be “sps.”
  • 8. The Four Windows: Script Window • Script Window Provides the opportunity to write full-blown programs, in a BASIC-like language. Text editor for syntax composition. Extension of the saved file will be “sbs.”
  • 9. The basics of managing data files
  • 10. Opening SPSS • Start → All Programs → SPSS Inc→ SPSS 16.0 → SPSS 16.0
  • 11. Opening SPSS • The default window will have the data editor • There are two sheets in the window: 1. Data view 2. Variable view
  • 12. Data View window • The Data View window This sheet is visible when you first open the Data Editor and this sheet contains the data • Click on the tab labeled Variable View Click
  • 13. Variable View window • This sheet contains information about the data set that is stored with the dataset • Name – The first character of the variable name must be alphabetic – Variable names must be unique, and have to be less than 64 characters. – Spaces are NOT allowed.
  • 14. Variable View window: Type • Type – Click on the ‘type’ box. The two basic types of variables that you will use are numeric and string. This column enables you to specify the type of variable.
  • 15. Variable View window: Width • Width – Width allows you to determine the number of characters SPSS will allow to be entered for the variable
  • 16. Variable View window: Decimals • Decimals – Number of decimals – It has to be less than or equal to 16 3.14159265
  • 17. Variable View window: Label • Label – You can specify the details of the variable – You can write characters with spaces up to 256 characters
  • 18. Variable View window: Values • Values – This is used and to suggest which numbers represent which categories when the variable represents a category
  • 19. Defining the value labels • Click the cell in the values column as shown below • For the value, and the label, you can put up to 60 characters. • After defining the values click add and then click OK. Click
  • 20. Practice 1 • How would you put the following information into SPSS? Name Gender Height JAUNITA 2 5.4 SALLY 2 5.3 DONNA 2 5.6 SABRINA 2 5.7 JOHN 1 5.7 MARK 1 6 ERIC 1 6.4 BRUCE 1 5.9 Value = 1 represents Male and Value = 2 represents Female
  • 21. Practice 1 (Solution Sample) Click
  • 22. Click
  • 23. Saving the data • To save the data file you created simply click ‘file’ and click ‘save as.’ You can save the file in different forms by clicking “Save as type.” Click
  • 24. Sorting the data • Click ‘Data’ and then click Sort Cases
  • 25. Sorting the data (cont’d) • Double Click ‘Name of the students.’ Then click ok. Click Click
  • 26. Practice 2 • How would you sort the data by the ‘Height’ of students in descending order? • Answer – Click data, sort cases, double click ‘height of students,’ click ‘descending,’ and finally click ok.
  • 27. Transforming data • Click ‘Transform’ and then click ‘Compute Variable…’
  • 28. Transforming data (cont’d) • Example: Adding a new variable named ‘lnheight’ which is the natural log of height – Type in lnheight in the ‘Target Variable’ box. Then type in ‘ln(height)’ in the ‘Numeric Expression’ box. Click OK Click
  • 29. Transforming data (cont’d) • A new variable ‘lnheight’ is added to the table
  • 30. Practice 3 • Create a new variable named “sqrtheight” which is the square root of height. • Answer
  • 32. The basic analysis of SPSS that will be introduced in this class • Frequencies – This analysis produces frequency tables showing frequency counts and percentages of the values of individual variables. • Descriptives – This analysis shows the maximum, minimum, mean, and standard deviation of the variables • Linear regression analysis – Linear Regression estimates the coefficients of the linear equation
  • 33. Opening the sample data • Open ‘Employee data.sav’ from the SPSS – Go to “File,” “Open,” and Click Data
  • 34. Opening the sample data • Go to Program Files,” “SPSSInc,” “SPSS16,” and “Samples” folder. • Open “Employee Data.sav” file
  • 35. Frequencies • Click ‘Analyze,’ ‘Descriptive statistics,’ then click ‘Frequencies’
  • 36. Frequencies • Click gender and put it into the variable box. • Click ‘Charts.’ • Then click ‘Bar charts’ and click ‘Continue.’ Click Click
  • 37. Frequencies • Finally Click OK in the Frequencies box. Click
  • 38.
  • 39. Using the Syntax editor • Click ‘Analyze,’ ‘Descriptive statistics,’ then click ‘Frequencies.’ • Put ‘Gender’ in the Variable(s) box. • Then click ‘Charts,’ ‘Bar charts,’ and click ‘Continue.’ • Click ‘Paste.’ Click
  • 40. Using the Syntax editor • Highlight the commands in the Syntax editor and then click the run icon. • You can do the same thing by right clicking the highlighted area and then by clicking ‘Run Current’ Click Right Click!
  • 41. Practice 4 • Do a frequency analysis on the variable “minority” • Create pie charts for it • Do the same analysis using the syntax editor
  • 42.
  • 44. Descriptives • Click ‘Analyze,’ ‘Descriptive statistics,’ then click ‘Descriptives…’ • Click ‘Educational level’ and ‘Beginning Salary,’ and put it into the variable box. • Click Options Click
  • 45. Descriptives • The options allows you to analyze other descriptive statistics besides the mean and Std. • Click ‘variance’ and ‘kurtosis’ • Finally click ‘Continue’ Click Click
  • 46. Descriptives • Finally Click OK in the Descriptives box. You will be able to see the result of the analysis.
  • 47. Regression Analysis • Click ‘Analyze,’ ‘Regression,’ then click ‘Linear’ from the main menu.
  • 48. Regression Analysis salbegin =b +b edu +e 0 1 • For example let’s analyze the model • Put ‘Beginning Salary’ as Dependent and ‘Educational Level’ as Independent. Click Click
  • 49. Regression Analysis • Clicking OK gives the result
  • 50. Plotting the regression line • Click ‘Graphs,’ ‘Legacy Dialogs,’ ‘Interactive,’ and ‘Scatterplot’ from the main menu.
  • 51. Plotting the regression line • Drag ‘Current Salary’ into the vertical axis box and ‘Beginning Salary’ in the horizontal axis box. • Click ‘Fit’ bar. Make sure the Method is regression in the Fit box. Then click ‘OK’. Click Set this to Regression!
  • 52.
  • 53. Practice 5 • Find out whether or not the previous experience of workers has any affect on their beginning salary? – Take the variable “salbegin,” and “prevexp” as dependent and independent variables respectively. • Plot the regression line for the above analysis using the “scatter plot” menu.
  • 55.
  • 56. Click on the “fit” tab to make sure the method is regression
  • 57.
  • 58. CONCLUSION • SPSS for windows is a computer package that will perform a wide variety of statistical procedures. • Data management and analysis can be handled well with SPSS. • Using SPSS we can manipulate data, make graphs and perform statistical techniques varying from means to regression.
  • 59. REFERENCES . http://en.allexperts.com/q/Management-Consulting-2802 http://www.icmrindia.org Harvard Business Review - April 2009 www.coolavenue.com www2.advisorworks.com. February 28, 2000. Baylogic. "Net History and Statistics." www.baylogic.com. February 28, 2000. Berners-Lee, Tim. (1996) "Passing up Fortune-Building 'To Do the Revolution Right'." Investor's Business Daily 13(43)(June 7):1-2. Reidelbach, Dorothy. (1996 Planning for Higher Education24 (Spring):1- 6. Ricart, Glenn. (2000). "Unofficial Technology Marvel of the Millennium." Educause ReviewJanuary/February: 38-59.

Editor's Notes

  1. The graph shows that more people who receives wireless service tends to own PDA compared to people who doesn’t receive wireless service.
  2. This window shows the actual data values and the name of the variables.