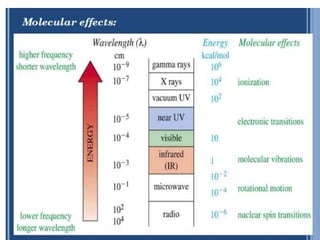
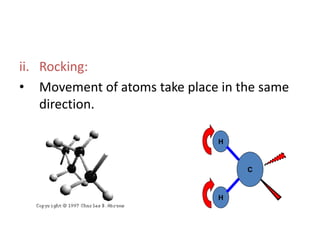
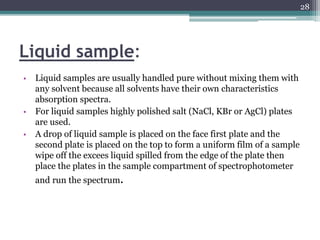
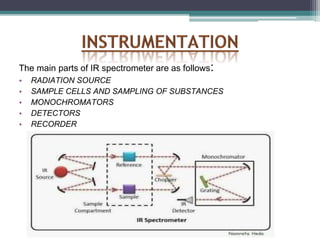
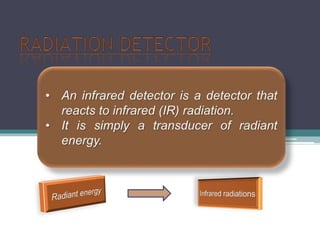
IR SPECTROSCOPY
Mr. Shinde GANESH SHASHIKANT
PRAVARA RURAL COLLEGE OF PHARMACY, PRAVARANAGAR
Department of Pharmaceutical Chemistry
Spectroscopy
• Method of “Seeing the unseeable”
• using electromagnetic radiation to obtain
information about atoms and molecules that are
too small to see.
Atoms
Molecules
Spectroscopy is an instrumentally aided study of
the interactions between matter (sample being
analyzed) and energy (any portion of the
electromagnetic spectrum)
EMR ANALYTE SPECTROPHOTOGRAPH
1.UV-Visible radiations--------excitation of electrons---------UV-visible spectrum
2.IR-radiations------------------vibration changes in electrons--------IR spectrum
3.Radio frequency---------------spin rotational changes-------------N.M.R spectrum
Conc. should be lower
IR spectrophotometry
Energy of molecule = Electronic energy+ Vibrational
energy + Rotational energy
• IR spectroscopy is concerned with the study of
absorption of infrared radiation, which causes
vibrational transition in the molecule.
Hence, IR spectroscopy also known as Vibrational
spectroscopy.
• IR spectra mainly used in structure elucidation to
determine the functional groups.
• IR region:
Most of the analytical applications are confined to the
middle IR region because absorption of organic
molecules are high in this region.
Sub divided into
Near infrared region 0.8-2.5 µ(12,500-4000 cm-1)
Main infrared region 2.5-15 µ(4000-667cm-1)
Far infrared region 15-200 µ(667-50 cm-1)
Principle of IR spectroscopy
• Molecules are made up of atoms linked by chemical
bonds. The movement of atoms and the chemical
bonds like like spring and balls (vibration)
• This characteristic vibration are called Natural
frequency of vibration.
• When energy in the form of infrared radiation is
applied then it causes the vibration between the
atoms of the molecules and when,
Applied infrared frequency = Natural frequency of
vibration
Then, Absorption of IR radiation takes place and a
peak is observed.
Different functional groups absorb characteristic
frequencies of IR radiation. Hence gives the
characteristic peak value.
Therefore, IR spectrum of a chemical substance is a
finger print of a molecule for its identification.
Criteria for a compound to absorb
IR radiation
1. Correct wavelength of radiation
2. Change in dipole moment
1. Correct wavelength of radiation:
A molecule to absorb IR radiation, the natural
frequency of vibrations of some part of a
molecule is the same as the frequency of
incident radiation.
2. Change in dipole moment
• A molecule can only absorb IR radiation when
its absorption cause a change in its electric
dipole
• A molecule is said to have an electric dipole
when there is a slight positive and a slight
negative charge on its component of atoms.
Molecular vibrations
There are 2 types of vibrations:
1. Stretching vibrations
2. Bending vibrations
1. Stretching vibrations:
 Vibration or oscillation along the line of bond
 Change in bond length
 Occurs at higher energy: 4000-1500 cm-1 (1250 cm-1 )
 2 types:
a) Symmetrical stretching
b) Asymmetrical stretching
a) Symmetrical stretching:
2 bonds increase or decrease in length
simultaneously.
H
H
C
b) Asymmetrical stretching
• In Asymmetrical Stretching , one bond length is
increased and other is decreased.
H
H
C
2. Bending vibrations
• Vibration or oscillation not along the line of
bond
• These are also called as deformations
• In this, bond angle is altered
• Occurs at low energy: 1400-666 cm-1
• 2 types:
a) In plane bending: scissoring, rocking
b) Out plane bending: wagging, twisting
a) In plane bending
i. Scissoring:
• This is an in plane blending
• 2 atoms approach each other
• Bond angles are decrease
H
H
CC
ii. Rocking:
• Movement of atoms take place in the same
direction.
H
H
CC
b) Out plane bending
i. Wagging:
• 2 atoms move to one side of the plane. They move
up and down the plane.
ii. Twisting:
• One atom moves above the plane and another
atom moves below the plane.
H
H
CC
H
H
CC
• Types of Molecular Vibrations
• Stretching Vibrations: in which bond length changes
that require more energy.
• Bending Vibrations: in which bond angle changes
that require less energy.
Asymmetrical stretchingSymmetrical stretching
Rocking ScissoringTwisting Wagging
IR spectra
Sampling techniques
21
Sampling techniques
• Sample preparation is the most important part
in IR spectral analysis, Sample should be
transparent to IR radiations so it allows the
radiations to pass through them
• Hence the salts like KBr, NaCl, AgCl are used
for mixing of sample in order to obtain the
accurate IR spectrum of a sample with good
intensity, sharp peaks and high resolution.
1) Solid samples:
• Mull technique
• Pressed pellet technique
• Solids run in solutions
• Solid film
2) Liquid samples
3) Gaseous sample
23
Sampling techniques
Mull technique
• Grinding 2-5mg of sample in smooth agitate
mortar.
• Powdered sample + Nujol oil (mineral oil) paste
• Paste between the two plates of salt.
• The oil has few absorption bands at 2857, 1449
and 1389 cm-1
• The particle size must 1 -2 micron.
• Nujol agent (mineral oil) used in this techniques are : High boiling
petroleum, Halocarbon oil, perfluorokerosene
24
Pressed pellet technique:
• In this technique, a small amount of finely
ground solid sample is mixed with 100 times its
weight of potassium bromide and compressed
into a thin transparent pellet using a hydraulic
press. These pellets are transparent to IR
radiation and it is used for analysis.
• 1mg Sample+ 100mg KBr powder
25
Solids films:
• Amorphous solid samples melted between salt
plates allowed to form solid film.
• For qualitative purpose.
Solids run in solution
• Solid + suitable solvent 🡪 solution
• Kept in cells for liquids
• Solvents- non associated
solvents- CS2, CCl4,
26
Liquid sample:
27
Liquid sample:
• Liquid samples are usually handled pure without mixing them with
any solvent because all solvents have their own characteristics
absorption spectra.
• For liquid samples highly polished salt (NaCl, KBr or AgCl) plates
are used.
• A drop of liquid sample is placed on the face first plate and the
second plate is placed on the top to form a uniform film of a sample
wipe off the excees liquid spilled from the edge of the plate then
place the plates in the sample compartment of spectrophotometer
and run the spectrum.
28
Gaseous sample:
• Vapors in specially designed cells.
• End walls made up of Sodium chloride.
• A special sample cell is used for the
gaseous sample made up of NaCl, KBr
with long path length i.e 5 to 10 cm
• The vapors of gas are placed into the cell
and directly place in the path of Infrared
radiation
29
Instrumentation
30
The main parts of IR spectrometer are as follows:
• RADIATION SOURCE
• SAMPLE CELLS AND SAMPLING OF SUBSTANCES
• MONOCHROMATORS
• DETECTORS
• RECORDER
IR instruments require a source of radiant energy
which emit IR radiation which must be:
Sufficient
intensity
Continuous Stable
Globar source
• Rod of sintered silicon carbide. (5cm x 5mm).
• Positive coefficient of resistance.
• Self starting and electrically heated
• Enclosed in water cooled brass tube
• Less intense.
• Emit Radiation at 5200 cm-1
33
Nernst glower
• Composed of rare earth oxides- zirconium, yttrium and thorium
• Hollow tube (2-5cm x 1-3mm)
• Platinum leads at one end
• Large negative temp. coefficient.
• Emit radiation 7100 cm-1 over wide range and remains steady over a
long period.
Disadvantages:
• Fragile
• Auxiliary heater
• Over heating
34
Incandescent wire loop
• Tightly wound spiral of Nichrome wire.
• No water cooling
• Less maintenance
• Less intense than other sources.
Tungsten filament lamp
• Tightly wound spiral of tungsten wire.
• For near IR
• Emit radiation 667-4000 cm-1
35
Mercury arc
• For far IR region
• High pressure Hg arc, enclosed in quartz
jacketed tube, at 1 atm
• Passage of electricity through vapor 🡪 internal
plasma sourc IR radiation
• Emit radiation less than 667 cm-1
36
• SAMPLE CELL & SAMPLING OF
SUBSTANCE
Sample holders
• Constructed of rock salt.
• Path length is adjusted with Teflon.
• Filled and emptied with hypodermic needles.
• Foggy due to moisture.
Care:
▫ Moisture free samples
▫ Fingers should not be come in contact
▫ Prevent contamination with silicones
38
Sample holders
39
Monochromator
• To select desired frequency from radiation source.
▫ Prism monochromator
▫ Grating monochromator
• Material used: Halogen salt
40
Detector
Thermal Non-thermal
Bolometer is derived from a Greek word
(bolometron)
Bolo = for something thrown
Metron = measure
It was invented in 1878 by the American
astronomer Samuel Pierpont Langley
Construction
• A bolometer consists of an absorptive element,
such as a thin layer of metal or thermister .
• Most bolometers use semiconductor or
superconductor absorptive elements rather than
metals.
Working
Thin layer of
metal
connected to a
reservoir
Any radiation on the
absorptive element
raises its
temperature above
that of the reservoir.
The temperature
change can be
measured directly
with an attached
thermometer.
Temperature changes Potential difference
changes
Thermocouples consist of a pair of junctions of different metals; for
example, two pieces of bismuth fused to either end of a piece of
antimony.
Thermopile detectors are voltage-generating
devices, which can be thought of as
miniature arrays of thermocouple junctions.
Cold junction(t2)is kept const. temp and not
exposed IR but other junction hot when
exposed IR cause increase temp of junction
and generatre P.D due to incident IR
radiation fall on hot junction .
PYRO ELECTRIC DETECTOR
Construction:
• Single crystalline
wafer of a pyro electric
material, such as
triglycerine sulphate.
• Pyro electric Infrared
Detectors (PIR)
convert the changes in
incoming infrared light
to electric signals.
Below curie temperature
Pyro electric materials exhibit electrical polarization.
Temperature is altered, the polarization changes.
Observed as an electrical signal
(if electrodes are placed on opposite faces of a thin slice of the
material to form a capacitor)
Construction:
• Small metal cylinder
• Flexible silvered diaphragm
• Whole chamber is filled with xenon gas.
I.R radiations
Metal cylinder and flexible diaphragm
Temperature increases
Gas is expended and diaphragm deforms
detect as a signal
Infrared radiations
Photovoltaic detector(PbS)
Generates a small voltage and
increase conductance
Detected as a signal
WORKING OF IR
55
FT-IR
57
INTRODUCTION
• Absorption of IR radiation by sample, result in
vibration transition.
• Infrared radiation lies between the tfisible and
microwave portions of the electromagnetic
spectrum.
• Infrared waves have wavelengths longer than
visible and shorter than microwave and have
frequencies which arelower than visible and higher
than microwaves.
• IR spectra aremainly used in structure elucidation
to determine the groups.
PRINCIPLE
TheBeamSplitter Divides the beamandtransmits half of the incomingradiation
to the fixed mirrorandthe otherhalf to the movablemirror .
• Upon reflectionfromthe fixed andthe movablemirrorthe light is
recombinedat the beamsplitter.
• Therecombinationof the radiationis then directthroughthe sampleand focused
onthe detectoronthe detector(Pyroelectric detector).
• When the path differenceis ZERO, allthe spectralcomponentsarein phase
andthe output is at a MAXIMUM.
FT-IR Spectrometer
Components
• Source
• An optical System which uses interferometer
• Beam Splitter
• Stationary mirror
• Moving mirror
• Sample
• Detector
• Sources:Nernst Glower, GlobalSource,Tungsten Lamp, Mercuryarc.
• BeamSplitter: It ismadeupof materialwhichismadeupof refractiveindex
1. ForFarInfrared: Mylar film sandwichedbetween halideplateof low
refractiveindexsolid used.
2. FormiddleIR :Thin film of germaniumorsilicondepositedonCsIorCsBror
KClor NaCl.
3. ForNearIR: Thin film of ferricoxidedepositedoncalciumchloride
• Detector:PyroelectricDetectoris used
• It consist of two perpendicularmirrors,oneof which is
Stationary mirrorand the other is amovable mirror.
• ThePosition of movablemirror is controlledby HeNe Laser.
(632.8 nm)
• Between these two mirrors , set abeamsplitter at 45
degreefrom initial positon of the movable mirror.
• A parallelbeamof radiation fromIR sourceis passedon
the mirrorsthroughthe beam splitter
FTIR Animation video Demonstration
FTIR Animation Video
Application
• Foropaqueorcloudy samples
• Analysis of rawmaterialsorfinished products.
• Kinetics reactionsonthe microsecondtime-scale.
• Analysis of chromatographicandthermogravimetricsample
fractions.
• Micro-Samples. Tiny samples,Suchasin forensic analysis
• Identification of compounds.

Ir spectroscopy

  • 1.
    IR SPECTROSCOPY Mr. ShindeGANESH SHASHIKANT PRAVARA RURAL COLLEGE OF PHARMACY, PRAVARANAGAR Department of Pharmaceutical Chemistry
  • 2.
    Spectroscopy • Method of“Seeing the unseeable” • using electromagnetic radiation to obtain information about atoms and molecules that are too small to see. Atoms Molecules
  • 3.
    Spectroscopy is aninstrumentally aided study of the interactions between matter (sample being analyzed) and energy (any portion of the electromagnetic spectrum) EMR ANALYTE SPECTROPHOTOGRAPH 1.UV-Visible radiations--------excitation of electrons---------UV-visible spectrum 2.IR-radiations------------------vibration changes in electrons--------IR spectrum 3.Radio frequency---------------spin rotational changes-------------N.M.R spectrum Conc. should be lower
  • 4.
    IR spectrophotometry Energy ofmolecule = Electronic energy+ Vibrational energy + Rotational energy • IR spectroscopy is concerned with the study of absorption of infrared radiation, which causes vibrational transition in the molecule. Hence, IR spectroscopy also known as Vibrational spectroscopy. • IR spectra mainly used in structure elucidation to determine the functional groups.
  • 6.
    • IR region: Mostof the analytical applications are confined to the middle IR region because absorption of organic molecules are high in this region. Sub divided into Near infrared region 0.8-2.5 µ(12,500-4000 cm-1) Main infrared region 2.5-15 µ(4000-667cm-1) Far infrared region 15-200 µ(667-50 cm-1)
  • 7.
    Principle of IRspectroscopy • Molecules are made up of atoms linked by chemical bonds. The movement of atoms and the chemical bonds like like spring and balls (vibration) • This characteristic vibration are called Natural frequency of vibration.
  • 8.
    • When energyin the form of infrared radiation is applied then it causes the vibration between the atoms of the molecules and when, Applied infrared frequency = Natural frequency of vibration Then, Absorption of IR radiation takes place and a peak is observed. Different functional groups absorb characteristic frequencies of IR radiation. Hence gives the characteristic peak value. Therefore, IR spectrum of a chemical substance is a finger print of a molecule for its identification.
  • 9.
    Criteria for acompound to absorb IR radiation 1. Correct wavelength of radiation 2. Change in dipole moment 1. Correct wavelength of radiation: A molecule to absorb IR radiation, the natural frequency of vibrations of some part of a molecule is the same as the frequency of incident radiation.
  • 10.
    2. Change indipole moment • A molecule can only absorb IR radiation when its absorption cause a change in its electric dipole • A molecule is said to have an electric dipole when there is a slight positive and a slight negative charge on its component of atoms.
  • 11.
    Molecular vibrations There are2 types of vibrations: 1. Stretching vibrations 2. Bending vibrations 1. Stretching vibrations:  Vibration or oscillation along the line of bond  Change in bond length  Occurs at higher energy: 4000-1500 cm-1 (1250 cm-1 )  2 types: a) Symmetrical stretching b) Asymmetrical stretching
  • 12.
    a) Symmetrical stretching: 2bonds increase or decrease in length simultaneously. H H C
  • 13.
    b) Asymmetrical stretching •In Asymmetrical Stretching , one bond length is increased and other is decreased. H H C
  • 14.
    2. Bending vibrations •Vibration or oscillation not along the line of bond • These are also called as deformations • In this, bond angle is altered • Occurs at low energy: 1400-666 cm-1 • 2 types: a) In plane bending: scissoring, rocking b) Out plane bending: wagging, twisting
  • 15.
    a) In planebending i. Scissoring: • This is an in plane blending • 2 atoms approach each other • Bond angles are decrease H H CC
  • 16.
    ii. Rocking: • Movementof atoms take place in the same direction. H H CC
  • 17.
    b) Out planebending i. Wagging: • 2 atoms move to one side of the plane. They move up and down the plane. ii. Twisting: • One atom moves above the plane and another atom moves below the plane. H H CC H H CC
  • 18.
    • Types ofMolecular Vibrations • Stretching Vibrations: in which bond length changes that require more energy. • Bending Vibrations: in which bond angle changes that require less energy. Asymmetrical stretchingSymmetrical stretching Rocking ScissoringTwisting Wagging
  • 19.
  • 21.
  • 22.
    Sampling techniques • Samplepreparation is the most important part in IR spectral analysis, Sample should be transparent to IR radiations so it allows the radiations to pass through them • Hence the salts like KBr, NaCl, AgCl are used for mixing of sample in order to obtain the accurate IR spectrum of a sample with good intensity, sharp peaks and high resolution.
  • 23.
    1) Solid samples: •Mull technique • Pressed pellet technique • Solids run in solutions • Solid film 2) Liquid samples 3) Gaseous sample 23 Sampling techniques
  • 24.
    Mull technique • Grinding2-5mg of sample in smooth agitate mortar. • Powdered sample + Nujol oil (mineral oil) paste • Paste between the two plates of salt. • The oil has few absorption bands at 2857, 1449 and 1389 cm-1 • The particle size must 1 -2 micron. • Nujol agent (mineral oil) used in this techniques are : High boiling petroleum, Halocarbon oil, perfluorokerosene 24
  • 25.
    Pressed pellet technique: •In this technique, a small amount of finely ground solid sample is mixed with 100 times its weight of potassium bromide and compressed into a thin transparent pellet using a hydraulic press. These pellets are transparent to IR radiation and it is used for analysis. • 1mg Sample+ 100mg KBr powder 25
  • 26.
    Solids films: • Amorphoussolid samples melted between salt plates allowed to form solid film. • For qualitative purpose. Solids run in solution • Solid + suitable solvent 🡪 solution • Kept in cells for liquids • Solvents- non associated solvents- CS2, CCl4, 26
  • 27.
  • 28.
    Liquid sample: • Liquidsamples are usually handled pure without mixing them with any solvent because all solvents have their own characteristics absorption spectra. • For liquid samples highly polished salt (NaCl, KBr or AgCl) plates are used. • A drop of liquid sample is placed on the face first plate and the second plate is placed on the top to form a uniform film of a sample wipe off the excees liquid spilled from the edge of the plate then place the plates in the sample compartment of spectrophotometer and run the spectrum. 28
  • 29.
    Gaseous sample: • Vaporsin specially designed cells. • End walls made up of Sodium chloride. • A special sample cell is used for the gaseous sample made up of NaCl, KBr with long path length i.e 5 to 10 cm • The vapors of gas are placed into the cell and directly place in the path of Infrared radiation 29
  • 30.
  • 31.
    The main partsof IR spectrometer are as follows: • RADIATION SOURCE • SAMPLE CELLS AND SAMPLING OF SUBSTANCES • MONOCHROMATORS • DETECTORS • RECORDER
  • 32.
    IR instruments requirea source of radiant energy which emit IR radiation which must be: Sufficient intensity Continuous Stable
  • 33.
    Globar source • Rodof sintered silicon carbide. (5cm x 5mm). • Positive coefficient of resistance. • Self starting and electrically heated • Enclosed in water cooled brass tube • Less intense. • Emit Radiation at 5200 cm-1 33
  • 34.
    Nernst glower • Composedof rare earth oxides- zirconium, yttrium and thorium • Hollow tube (2-5cm x 1-3mm) • Platinum leads at one end • Large negative temp. coefficient. • Emit radiation 7100 cm-1 over wide range and remains steady over a long period. Disadvantages: • Fragile • Auxiliary heater • Over heating 34
  • 35.
    Incandescent wire loop •Tightly wound spiral of Nichrome wire. • No water cooling • Less maintenance • Less intense than other sources. Tungsten filament lamp • Tightly wound spiral of tungsten wire. • For near IR • Emit radiation 667-4000 cm-1 35
  • 36.
    Mercury arc • Forfar IR region • High pressure Hg arc, enclosed in quartz jacketed tube, at 1 atm • Passage of electricity through vapor 🡪 internal plasma sourc IR radiation • Emit radiation less than 667 cm-1 36
  • 37.
    • SAMPLE CELL& SAMPLING OF SUBSTANCE
  • 38.
    Sample holders • Constructedof rock salt. • Path length is adjusted with Teflon. • Filled and emptied with hypodermic needles. • Foggy due to moisture. Care: ▫ Moisture free samples ▫ Fingers should not be come in contact ▫ Prevent contamination with silicones 38
  • 39.
  • 40.
    Monochromator • To selectdesired frequency from radiation source. ▫ Prism monochromator ▫ Grating monochromator • Material used: Halogen salt 40
  • 42.
  • 44.
    Bolometer is derivedfrom a Greek word (bolometron) Bolo = for something thrown Metron = measure It was invented in 1878 by the American astronomer Samuel Pierpont Langley
  • 45.
    Construction • A bolometerconsists of an absorptive element, such as a thin layer of metal or thermister . • Most bolometers use semiconductor or superconductor absorptive elements rather than metals.
  • 46.
    Working Thin layer of metal connectedto a reservoir Any radiation on the absorptive element raises its temperature above that of the reservoir. The temperature change can be measured directly with an attached thermometer.
  • 47.
    Temperature changes Potentialdifference changes Thermocouples consist of a pair of junctions of different metals; for example, two pieces of bismuth fused to either end of a piece of antimony.
  • 48.
    Thermopile detectors arevoltage-generating devices, which can be thought of as miniature arrays of thermocouple junctions. Cold junction(t2)is kept const. temp and not exposed IR but other junction hot when exposed IR cause increase temp of junction and generatre P.D due to incident IR radiation fall on hot junction .
  • 49.
    PYRO ELECTRIC DETECTOR Construction: •Single crystalline wafer of a pyro electric material, such as triglycerine sulphate. • Pyro electric Infrared Detectors (PIR) convert the changes in incoming infrared light to electric signals.
  • 50.
    Below curie temperature Pyroelectric materials exhibit electrical polarization. Temperature is altered, the polarization changes. Observed as an electrical signal (if electrodes are placed on opposite faces of a thin slice of the material to form a capacitor)
  • 51.
    Construction: • Small metalcylinder • Flexible silvered diaphragm • Whole chamber is filled with xenon gas.
  • 52.
    I.R radiations Metal cylinderand flexible diaphragm Temperature increases Gas is expended and diaphragm deforms detect as a signal
  • 54.
    Infrared radiations Photovoltaic detector(PbS) Generatesa small voltage and increase conductance Detected as a signal
  • 55.
  • 56.
  • 57.
    57 INTRODUCTION • Absorption ofIR radiation by sample, result in vibration transition. • Infrared radiation lies between the tfisible and microwave portions of the electromagnetic spectrum. • Infrared waves have wavelengths longer than visible and shorter than microwave and have frequencies which arelower than visible and higher than microwaves. • IR spectra aremainly used in structure elucidation to determine the groups.
  • 58.
    PRINCIPLE TheBeamSplitter Divides thebeamandtransmits half of the incomingradiation to the fixed mirrorandthe otherhalf to the movablemirror . • Upon reflectionfromthe fixed andthe movablemirrorthe light is recombinedat the beamsplitter. • Therecombinationof the radiationis then directthroughthe sampleand focused onthe detectoronthe detector(Pyroelectric detector). • When the path differenceis ZERO, allthe spectralcomponentsarein phase andthe output is at a MAXIMUM.
  • 59.
    FT-IR Spectrometer Components • Source •An optical System which uses interferometer • Beam Splitter • Stationary mirror • Moving mirror • Sample • Detector
  • 60.
    • Sources:Nernst Glower,GlobalSource,Tungsten Lamp, Mercuryarc. • BeamSplitter: It ismadeupof materialwhichismadeupof refractiveindex 1. ForFarInfrared: Mylar film sandwichedbetween halideplateof low refractiveindexsolid used. 2. FormiddleIR :Thin film of germaniumorsilicondepositedonCsIorCsBror KClor NaCl. 3. ForNearIR: Thin film of ferricoxidedepositedoncalciumchloride • Detector:PyroelectricDetectoris used
  • 61.
    • It consistof two perpendicularmirrors,oneof which is Stationary mirrorand the other is amovable mirror. • ThePosition of movablemirror is controlledby HeNe Laser. (632.8 nm) • Between these two mirrors , set abeamsplitter at 45 degreefrom initial positon of the movable mirror. • A parallelbeamof radiation fromIR sourceis passedon the mirrorsthroughthe beam splitter
  • 62.
    FTIR Animation videoDemonstration
  • 63.
  • 64.
    Application • Foropaqueorcloudy samples •Analysis of rawmaterialsorfinished products. • Kinetics reactionsonthe microsecondtime-scale. • Analysis of chromatographicandthermogravimetricsample fractions. • Micro-Samples. Tiny samples,Suchasin forensic analysis • Identification of compounds.