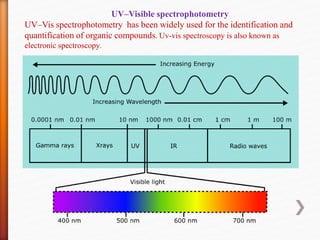
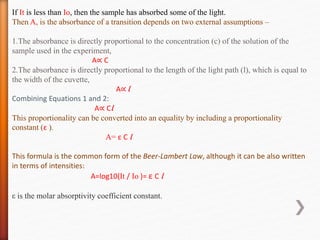
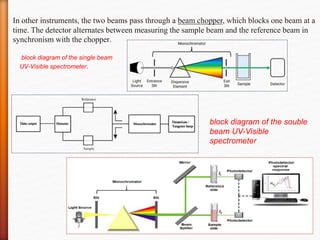
SlideShare a Scribd company logo
UV–Visible spectrophotometry
Prepared by
Yogita Chunchuwar - Mandlik
M-Pharm ( Pharmaceutics) sem I
Priyadarshini J.L.College of pharmacy, Nagpur.
It is the branch of science that deals with the study of interaction of matter with light. OR •
It is the branch of science that deals with the study of interaction of electromagnetic
radiation with matter.
In simple words, it is a method to measure how much light is absorbed by a chemical
substance and at what intensity of light passes through it. As per analytical science, every
element or compound has a unique characteristic spectrum.
Spectroscopy is used in physical and analytical chemistry to detect, determine, or
quantify the molecular and/or structural composition of a sample.
Different Types of Spectroscopy
Infrared (IR) Spectroscopy.
Ultraviolet-Visible (UV/Vis) Spectroscopy.
Nuclear Magnetic Resonance (NMR) Spectroscopy.
X-Ray Spectroscopy.
Spectroscopy
UV–Visible spectrophotometry
UV–Vis spectrophotometry has been widely used for the identification and
quantification of organic compounds. Uv-vis spectroscopy is also known as
electronic spectroscopy.
In spectroscopic analysis, when radiations interact with a chemical species, they can cause
transition at different energy levels. The type of transition depends upon the energy of the
radiation and the detection mode.
The transition of electrons always occurs from the ground state of low energy HOMO
(highest occupied molecular orbital) to a higher energy excited state LUMO (lowest
unoccupied molecular orbital). The overlap of atomic orbitals forms three types of molecular
orbitals. This whole concept arises from molecular orbital theory (MOT).
Bonding molecular orbitals of lower energy.
Non-bonding molecular orbitals of intermediate energy.
Anti bonding molecular orbitals are of higher energy.
Principle of UV-Visible Spectroscopy
The Principle of UV-Visible Spectroscopy is based on the absorption of ultraviolet
light or visible light by chemical compounds, which results in the production of
distinct spectra.
When matter absorbs ultraviolet radiation, the electrons present in it undergo
excitation. This causes them to jump from a ground state (an energy state with a
relatively small amount of energy associated with it) to an excited state (an energy
state with a relatively large amount of energy associated with it). It is important to
note that the difference in the energies of the ground state and the excited state of
the electron is always equal to the amount of ultraviolet radiation or visible
radiation absorbed by it.
Ultraviolet/Visible area (UV-Vis) measurements span wavelengths from around
200 nm to 800 nm. {UV (180–390 nm) or visible (390–780 nm) }
The Beer-Lambert Law
What is Beer’s Law?
Beer law states that concentration and absorbance are directly proportional to each other
and it was stated by August Beer.
What is Lambert Law?
Lambert law states that absorbance and path length are directly proportional ,and it was
stated by Johann Heinrich Lambert.The statement of the Beer-Lambert law can be written
as follows:
When a beam of monochromatic light is made incident on a solution that contains a
substance that absorbs the monochromatic light, the rate at which the intensity of the
beam decreases along the thickness of the solution is directly proportional to the
concentration of the absorbing substance in the solution and is also directly proportional
to the intensity of the incident monochromatic radiation. Or
According to Beer-Lambert Law, the amount of light absorbed is directly proportional to
the concentration of the sample and the distance the light travels through the sample; the
pathlength.
As per the Beer-Lambert law, the greater the number of absorbing molecules (that have
the ability to absorb light of a specific wavelength), the greater the extent of absorption of
the radiation.
The Beer-Lambert Law
The Absorbance of a Solution
For each wavelength of light passing through the spectrometer, the intensity of the light
passing through the reference cell is measured. This is usually referred to as -Io( Io for
Intensity.)
Light absorbed by sample in a cuvette
The intensity of the light passing through the sample cell is also measured for that
wavelength , reffered as –It
1.The absorbance is directly proportional to the concentration (c) of the solution of the
sample used in the experiment, A∝ C
2.The absorbance is directly proportional to the length of the light path (l), which is equal
to the width of the cuvette, A∝ l
Combining Equations 1 and 2:
A∝ Cl
This proportionality can be converted into an equality by including a proportionality
constant (ε ).
A= ε Cl
This formula is the common form of the Beer-Lambert Law, although it can be also
written in terms of intensities:
A=log10(It / Io )= ε lc
If It is less than Io, then the sample has absorbed some of the light.
Then A, is the absorbance of a transition depends on two external assumptions –
1.The absorbance is directly proportional to the concentration (c) of the solution of the
sample used in the experiment,
A∝ C
2.The absorbance is directly proportional to the length of the light path (l), which is equal to
the width of the cuvette,
A∝ l
Combining Equations 1 and 2:
A∝ Cl
This proportionality can be converted into an equality by including a proportionality
constant (ε ).
A= ε C l
This formula is the common form of the Beer-Lambert Law, although it can be also written
in terms of intensities:
A=log10(It / Io )= ε C l
ε is the molar absorptivity coefficient constant.
Limitations of lambert beer law
 The light source used must be monochromatic.
 This is not suitable for concentrated solutions i.e. It can only be applicable to dilute
solutions.
 With an increase in dilution, the dissociation of weak acids occurs. The weak acids reach
equilibrium with their conjugate base. The acid (HA) and conjugate base (A–) cannot
have the same absorbance. Hence this law is not completely applicable to weak acidic
solutions.
Ultraviolet–visible spectrophotometer instrumentation -
The instrument used in ultraviolet–visible spectroscopy is called a
UV/Visible spectrophotometer. It measures the intensity of light after passing through a
sample It, and compares it to the intensity of light before it passes through the sample Io The
ratio It /Io is called the transmittance, and is usually expressed as a percentage (%T).
The UV–visible spectrophotometer can also be configured to measure reflectance. In this
case, the spectrophotometer measures the intensity of light reflected from a sample Io, and
compares it to the intensity of light reflected from a reference material Ir. The ratio Ir  Io is
called the reflectance, and is usually expressed as a percentage (%R).
The basic parts of a spectrophotometer are a light source, a holder for the sample,
a diffraction grating in a monochromator or a prism to separate the different wavelengths of
light, and a detector.
A spectrophotometer can be either single beam or double beam. In a single beam instrument
(such as the Spectronic 20 ), all of the light passes through the sample cell. Io must be
measured by removing the sample.
In a double-beam instrument, the light is split into two beams before it reaches the
sample.One beam is used as the reference; the other beam passes through the sample. The
reference beam intensity is taken as 100% Transmission (or 0 Absorbance), and the
measurement displayed is the ratio of the two beam intensities. Some double-beam
instruments have two detectors (photodiodes), and the sample and reference beam are
measured at the same time.
In other instruments, the two beams pass through a beam chopper, which blocks one beam at a
time. The detector alternates between measuring the sample beam and the reference beam in
synchronism with the chopper.
block diagram of the single beam
UV-Visible spectrometer.
block diagram of the souble
beam UV-Visible
spectrometer
Instrumentation of UV-visible spectroscopy
The basic instrumentation of the UV-vis spectrometer comprises of
1. Light source
2. Diffraction grating
3. Wavelength selector
4. Sample container or cuvette
5. Detector
1. Light Source
Light sources that lie in the ultraviolet and visible region are used as UV-visible
spectrometer sources.
1. Hydrogen & deuterium lamps range 160-380nm
2. Xenon arc lamps range 250-600nm
3. Tungsten halogen lamps range 240-2500nm
4. more recently, light emitting diodes (LED)
Types of the wavelength selectors
1. Filters 2. Monochromators
Filters
Filters are used to permit a certain band of wavelength. The simplest type of filter is the
absorption filter. Most commonly colored glass filters are used. They absorb a broad portion of
the spectrum (complementary colors) and transmit other portions (its own color).
Advantages
• The filters are inexpensive. . They possess technical simplicity.
Disadvantages
• The filters are restricted to the visible region only.
• They are not very good wavelength selectors.
• Not useful for research purposes as they allow broad bandwidth. So there are more chances o
deviation from Lambert beer’s law.
Monochromators
A monochromator is an optical device that is used to select a narrow band of a wavelength of
light. It may be a quartz prism or grating.
Uses of monochromators
Monochromators are used for spectral scanning i.e. varying wavelength of radiation over a
range. They can be used for the UV-visible region.
Components of a monochromator
All monochromators are similar in mechanical construction. The essential components of a
monochromator are:
1.Slit 2.Mirror 3.Lense 4.Grating/prism
3. Sample container/cells or cuvettes
Sample containers or cuvettes may be made up of
• Quartz
• Borosilicate
• Plastic
Only quartz is transparent in both UV & visible regions (200-700nm range).
Glass & plastic are suitable for the visible region only.
Glass is not suitable for the UV region because it absorbs UV radiation i.e. it is not
transparent in the UV region.
Plastic cells are not used for organic solvents.
Cuvette size
The most common cuvette size is 1 cm, although it can vary from 0.1-10 cm.
4. Detectors
A detector is an important instrument in the UV-Vis spectrophotometer, used in the
conversion of light into proportional electrical signals, which provides the response of a
spectrophotometer.
Nowadays, detectors used in UV-Visible spectroscopy are classified into -
• Photomultiplier tube
• Phototube
• Diode array detector
• Charge coupled device
Phototube - A phototube comprises of a light-sensitive cathode and an
anode inside an evacuated quartz envelope. A potential difference of
approximately 100 V is applied between the two electrodes. A photon
entering the tube strikes the cathode and results in ejection of an electron
which strikes the anode and results in flow of current. The current is
generally of low intensity and needs to be amplified. The response of the
phototube is dependent on wavelength of incident light.
Photomultiplier Tube -
It comprises of a photosensitive cathode, anode and several dynodes.
Photons entering the tube strike the cathode resulting in emission of electrons. The electrons
are accelerated towards the first dynode which is 90 V more positive than the cathode.The
electrons striking the first dynode resulted in several electrons for each incident electron. The
process repeats itself from one dynode to next and after about 10 dynodes each photon results
in production of 106 to 107 electrons. The resulting current often needs to be amplified.
Photomultipliers have high sensitivity for UV and visible radiation and have fast response
times. However, they are susceptible to damage when exposed to high intensity light.
Photomultiplier tube is inherently more sensitive than the photo tube.
charge-coupled device (CCD)
is a light-sensitive integrated circuit that captures images by converting photons to
electrons. A CCD sensor breaks the image elements into pixels. Each pixel is
converted into an electrical charge whose intensity is related to the intensity of light
captured by that pixel.
• Diode array detector
Factor affecting absorbance & intensity
Conjugation Absorption shift towards longer wavelength, if double bonds (chromophore)
present in the molecule are in conjugation. For example,
UV-VISIBLE SPECTROSCOPY SOLVENT
Solvent must be transparent with in the wavelength range being examined.
It should not itself absorb radiation in the region under investigation
It should be less polar, to minimum interaction with solute molecule.
The most commonly used solvent is 95% ethanol. It Is a cheap , Good dissolving power.
Benzene, chloroform, carbon tetrachloride can not be used. Because they absorb in the range
of about 240 - 280nm.
The solvent exerts a profound influence on the quality and shape of spectrum. The absorption
spectrum of pharmaceutical substance depends practically upon the solvent that has been
employed to solubilize the substance. drug may absorb a maximum radiation energy at
particular wavelength in one solvent but shall absorb partially at the same wavelength in
another solvent. Eg: acetone in n-hexane λ max at 279nm. Acetone in water λ max at
264.5nm
Factor affecting absorbance & intensity
Conjugation Absorption shift towards longer wavelength, if double bonds (chromophore)
present in the molecule are in conjugation. For example,
Absorption, intensity shift & UV spectrum
a) Bathochromic shift: It is also known as Red shift, in this case absorption shift towards
longer wavelength (𝜆max).
b) Hypsochromic shift: It is also known as Blue shift, in this case absorption shift towards
shorter wavelength (𝜆max).
c) Hyperchromic shift: Intensity of absorption maximum (𝜀max) increases.
d) Hypochromic shift: Intensity of absorption maximum (𝜀max) decrease
Chromophores & Auxochromes
a) Chromophores: A chromophore is that part of a molecule that absorbs UV or
visible light.Chromophore is a covalently unsaturated group absorbed
electromagnetic radiation in UV-visible region and impart color to the compound.
For example, C=C, C≡C, benzene, NO2 etc.
b) Auxochromes: Auxochrome is a saturated group (containing lone pair of
electron), when auxochrome attach to the Chromophore absorption shift towards
longer wavelength. For example, -OH, -SH, -NH etc
Applications:
1. Detection of Impurities - It is one of the best methods for determination of impurities in
organic molecules. Additional peaks can be observed due to impurities in the sample and
it can be compared with that of standard raw material..
2. Structure elucidation of organic compounds - It is useful in the structure elucidation of
organic molecules, such as in detecting the presence or absence of unsaturation, the
presence of hetero atoms
3. UV absorption spectroscopy can be used for the quantitative determination of
compounds that absorb UV radiation.
4. 4. UV radiation thus used in qualitative determination of compounds. Identification is
done by comparing the absorption spectrum with the spectra of known compounds.
5. This technique is used to detect the presence or absence of functional group in the
compound. Absence of a band at particular wavelength regarded as an evidence for
absence of particular group
6. Kinetics of reaction can also be studied using UV spectroscopy
7. Many drugs are either in the form of raw material or in the form of formulation. They
can be assayed by making a suitable solution of the drug in a solvent and measuring the
absorbance at specific wavelength. 8
8. Molecular weights of compounds can be measured spectrophotometrically by preparing
the suitable derivatives of these compounds.
9. UV spectrophotometer may be used as a detector for HPLC.

More Related Content

What's hot

Spectroflourimetry
SpectroflourimetrySpectroflourimetry
Spectroflourimetry
XenChisti
 
UV visible Specrosopy and applications
UV visible Specrosopy and applicationsUV visible Specrosopy and applications
UV visible Specrosopy and applications
NAFIHHASSANMEHABANI
 
Infrared spectroscopy
Infrared spectroscopyInfrared spectroscopy
Infrared spectroscopy
Shabnamkhan113
 
Monochromators
MonochromatorsMonochromators
Monochromators
vijaya lakshmi kodali
 
IR spectroscopy
IR spectroscopyIR spectroscopy
Quadrupole and Time of Flight Mass analysers.
 Quadrupole and Time of Flight Mass analysers. Quadrupole and Time of Flight Mass analysers.
Quadrupole and Time of Flight Mass analysers.
Gagangowda58
 
UV- Visible Spectroscopy
UV- Visible SpectroscopyUV- Visible Spectroscopy
UV- Visible Spectroscopy
ROHIT
 
UV-Visible Spectroscopy
UV-Visible SpectroscopyUV-Visible Spectroscopy
UV-Visible SpectroscopySudha Reddy
 
Interference In Atomic Absorption Spectroscopy.
Interference In Atomic Absorption Spectroscopy.Interference In Atomic Absorption Spectroscopy.
Interference In Atomic Absorption Spectroscopy.
Raghavendra institute of pharmaceutical education and research .
 
Uv-visible spectroscopy
Uv-visible spectroscopyUv-visible spectroscopy
Uv-visible spectroscopy
Mzgin Mohammed
 
SlideShare Presentation on Mass spectrophotometer
SlideShare Presentation on Mass spectrophotometerSlideShare Presentation on Mass spectrophotometer
SlideShare Presentation on Mass spectrophotometer
Naveen K L
 
Basics of Infrared Spectroscopy : Theory, principles and applications
Basics of Infrared Spectroscopy : Theory, principles and applicationsBasics of Infrared Spectroscopy : Theory, principles and applications
Basics of Infrared Spectroscopy : Theory, principles and applications
Hemant Khandoliya
 
Mass spectrometry i
Mass spectrometry iMass spectrometry i
Mass spectrometry i
DrBasavarajaiahSm
 
INTRODUCTION TO UV-VISIBLE SPECTROSCOPY
INTRODUCTION TO UV-VISIBLE SPECTROSCOPYINTRODUCTION TO UV-VISIBLE SPECTROSCOPY
INTRODUCTION TO UV-VISIBLE SPECTROSCOPY
Junaid Khan
 
UV VISIBLE Spectroscopy
UV VISIBLE SpectroscopyUV VISIBLE Spectroscopy
UV VISIBLE Spectroscopy
Mash'hood Mahmood Khan Shahid
 
Nmr instrumentation Naveen Balaji
Nmr instrumentation Naveen BalajiNmr instrumentation Naveen Balaji
Nmr instrumentation Naveen Balaji
Naveen Balaji
 
Infrared spectroscopy
Infrared spectroscopyInfrared spectroscopy
Infrared spectroscopy
Asma Ashraf
 
NMR SPECTROSCOPY
NMR SPECTROSCOPYNMR SPECTROSCOPY
NMR SPECTROSCOPY
sharmeenkhan15
 
Solvents and solvent effect in UV - Vis Spectroscopy, By Dr. Umesh Kumar sh...
Solvents and  solvent effect in UV -  Vis Spectroscopy, By Dr. Umesh Kumar sh...Solvents and  solvent effect in UV -  Vis Spectroscopy, By Dr. Umesh Kumar sh...
Solvents and solvent effect in UV - Vis Spectroscopy, By Dr. Umesh Kumar sh...
Dr. UMESH KUMAR SHARMA
 
PRINCIPLES of FT-NMR & 13C NMR
PRINCIPLES of FT-NMR & 13C NMRPRINCIPLES of FT-NMR & 13C NMR
PRINCIPLES of FT-NMR & 13C NMR
Aditya Sharma
 

What's hot (20)

Spectroflourimetry
SpectroflourimetrySpectroflourimetry
Spectroflourimetry
 
UV visible Specrosopy and applications
UV visible Specrosopy and applicationsUV visible Specrosopy and applications
UV visible Specrosopy and applications
 
Infrared spectroscopy
Infrared spectroscopyInfrared spectroscopy
Infrared spectroscopy
 
Monochromators
MonochromatorsMonochromators
Monochromators
 
IR spectroscopy
IR spectroscopyIR spectroscopy
IR spectroscopy
 
Quadrupole and Time of Flight Mass analysers.
 Quadrupole and Time of Flight Mass analysers. Quadrupole and Time of Flight Mass analysers.
Quadrupole and Time of Flight Mass analysers.
 
UV- Visible Spectroscopy
UV- Visible SpectroscopyUV- Visible Spectroscopy
UV- Visible Spectroscopy
 
UV-Visible Spectroscopy
UV-Visible SpectroscopyUV-Visible Spectroscopy
UV-Visible Spectroscopy
 
Interference In Atomic Absorption Spectroscopy.
Interference In Atomic Absorption Spectroscopy.Interference In Atomic Absorption Spectroscopy.
Interference In Atomic Absorption Spectroscopy.
 
Uv-visible spectroscopy
Uv-visible spectroscopyUv-visible spectroscopy
Uv-visible spectroscopy
 
SlideShare Presentation on Mass spectrophotometer
SlideShare Presentation on Mass spectrophotometerSlideShare Presentation on Mass spectrophotometer
SlideShare Presentation on Mass spectrophotometer
 
Basics of Infrared Spectroscopy : Theory, principles and applications
Basics of Infrared Spectroscopy : Theory, principles and applicationsBasics of Infrared Spectroscopy : Theory, principles and applications
Basics of Infrared Spectroscopy : Theory, principles and applications
 
Mass spectrometry i
Mass spectrometry iMass spectrometry i
Mass spectrometry i
 
INTRODUCTION TO UV-VISIBLE SPECTROSCOPY
INTRODUCTION TO UV-VISIBLE SPECTROSCOPYINTRODUCTION TO UV-VISIBLE SPECTROSCOPY
INTRODUCTION TO UV-VISIBLE SPECTROSCOPY
 
UV VISIBLE Spectroscopy
UV VISIBLE SpectroscopyUV VISIBLE Spectroscopy
UV VISIBLE Spectroscopy
 
Nmr instrumentation Naveen Balaji
Nmr instrumentation Naveen BalajiNmr instrumentation Naveen Balaji
Nmr instrumentation Naveen Balaji
 
Infrared spectroscopy
Infrared spectroscopyInfrared spectroscopy
Infrared spectroscopy
 
NMR SPECTROSCOPY
NMR SPECTROSCOPYNMR SPECTROSCOPY
NMR SPECTROSCOPY
 
Solvents and solvent effect in UV - Vis Spectroscopy, By Dr. Umesh Kumar sh...
Solvents and  solvent effect in UV -  Vis Spectroscopy, By Dr. Umesh Kumar sh...Solvents and  solvent effect in UV -  Vis Spectroscopy, By Dr. Umesh Kumar sh...
Solvents and solvent effect in UV - Vis Spectroscopy, By Dr. Umesh Kumar sh...
 
PRINCIPLES of FT-NMR & 13C NMR
PRINCIPLES of FT-NMR & 13C NMRPRINCIPLES of FT-NMR & 13C NMR
PRINCIPLES of FT-NMR & 13C NMR
 

Similar to uv -visible spectroscopy

UV ray spectrophotometer
UV ray spectrophotometerUV ray spectrophotometer
UV ray spectrophotometer
Goa App
 
Uv/visible spectroscopy
Uv/visible spectroscopyUv/visible spectroscopy
Uv/visible spectroscopy
SavitaBhatt2
 
Uv
UvUv
Biomolecular andcellularresearchdevices fin
Biomolecular andcellularresearchdevices finBiomolecular andcellularresearchdevices fin
Biomolecular andcellularresearchdevices finMUBOSScz
 
UV rays
UV rays UV rays
UV rays
Goa App
 
U.V Spectroscopy
U.V SpectroscopyU.V Spectroscopy
U.V Spectroscopy
Shagufta Farooqui
 
Prabhakar singh ii sem-paper v-colorimeter & spectrophotometer
Prabhakar singh  ii sem-paper v-colorimeter & spectrophotometerPrabhakar singh  ii sem-paper v-colorimeter & spectrophotometer
Prabhakar singh ii sem-paper v-colorimeter & spectrophotometer
Department of Biochemistry, Veer Bahadur Singh Purvanchal Univarsity, Jaunpur
 
Spectropotometer.08.20 - Copy.ppt
Spectropotometer.08.20 - Copy.pptSpectropotometer.08.20 - Copy.ppt
Spectropotometer.08.20 - Copy.ppt
diptodas18
 
Uv visible spectroscopy
Uv visible spectroscopyUv visible spectroscopy
Uv visible spectroscopy
gracepaulraj
 
Ultraviolet and visible spectroscopy
Ultraviolet and visible  spectroscopyUltraviolet and visible  spectroscopy
Ultraviolet and visible spectroscopy
GeetaraniLoushigam
 
UV SPECTROSCOPY ppt.pptx
UV SPECTROSCOPY ppt.pptxUV SPECTROSCOPY ppt.pptx
UV SPECTROSCOPY ppt.pptx
Ashish Hingnekar
 
UV SPECTROSCOPY ppt.pptx
UV SPECTROSCOPY ppt.pptxUV SPECTROSCOPY ppt.pptx
UV SPECTROSCOPY ppt.pptx
AshishHingnekar1
 
UV-Visible spectroscopy
UV-Visible spectroscopyUV-Visible spectroscopy
UV-Visible Spectroscopy
UV-Visible SpectroscopyUV-Visible Spectroscopy
UV-Visible Spectroscopy
Ashish Roge
 
biophysics 1 spectroscopy
biophysics 1 spectroscopy biophysics 1 spectroscopy
biophysics 1 spectroscopy
MSCW Mysore
 
UV-VIS molecular spectroscopy.202004201521035685ranvijay_engg_UV_and_VISIBLE_...
UV-VIS molecular spectroscopy.202004201521035685ranvijay_engg_UV_and_VISIBLE_...UV-VIS molecular spectroscopy.202004201521035685ranvijay_engg_UV_and_VISIBLE_...
UV-VIS molecular spectroscopy.202004201521035685ranvijay_engg_UV_and_VISIBLE_...
abusunabakali
 
uv spectroscopy by HARVINDAR SINGH .M.PHARM PHARMACEUTICS
 uv spectroscopy by HARVINDAR SINGH .M.PHARM PHARMACEUTICS uv spectroscopy by HARVINDAR SINGH .M.PHARM PHARMACEUTICS
uv spectroscopy by HARVINDAR SINGH .M.PHARM PHARMACEUTICS
Harevindarsingh
 
Uv visible spectroscopy
Uv visible spectroscopyUv visible spectroscopy
Uv visible spectroscopy
Bashant Kumar sah
 

Similar to uv -visible spectroscopy (20)

UV ray spectrophotometer
UV ray spectrophotometerUV ray spectrophotometer
UV ray spectrophotometer
 
Uv/visible spectroscopy
Uv/visible spectroscopyUv/visible spectroscopy
Uv/visible spectroscopy
 
Uv
UvUv
Uv
 
Biomolecular andcellularresearchdevices fin
Biomolecular andcellularresearchdevices finBiomolecular andcellularresearchdevices fin
Biomolecular andcellularresearchdevices fin
 
UV rays
UV rays UV rays
UV rays
 
U.V Spectroscopy
U.V SpectroscopyU.V Spectroscopy
U.V Spectroscopy
 
Prabhakar singh ii sem-paper v-colorimeter & spectrophotometer
Prabhakar singh  ii sem-paper v-colorimeter & spectrophotometerPrabhakar singh  ii sem-paper v-colorimeter & spectrophotometer
Prabhakar singh ii sem-paper v-colorimeter & spectrophotometer
 
Spectropotometer.08.20 - Copy.ppt
Spectropotometer.08.20 - Copy.pptSpectropotometer.08.20 - Copy.ppt
Spectropotometer.08.20 - Copy.ppt
 
Uv visible spectroscopy
Uv visible spectroscopyUv visible spectroscopy
Uv visible spectroscopy
 
Ultraviolet and visible spectroscopy
Ultraviolet and visible  spectroscopyUltraviolet and visible  spectroscopy
Ultraviolet and visible spectroscopy
 
UV SPECTROSCOPY ppt.pptx
UV SPECTROSCOPY ppt.pptxUV SPECTROSCOPY ppt.pptx
UV SPECTROSCOPY ppt.pptx
 
UV SPECTROSCOPY ppt.pptx
UV SPECTROSCOPY ppt.pptxUV SPECTROSCOPY ppt.pptx
UV SPECTROSCOPY ppt.pptx
 
UV-Visible spectroscopy
UV-Visible spectroscopyUV-Visible spectroscopy
UV-Visible spectroscopy
 
UV-Visible Spectroscopy
UV-Visible SpectroscopyUV-Visible Spectroscopy
UV-Visible Spectroscopy
 
biophysics 1 spectroscopy
biophysics 1 spectroscopy biophysics 1 spectroscopy
biophysics 1 spectroscopy
 
UV-VIS molecular spectroscopy.202004201521035685ranvijay_engg_UV_and_VISIBLE_...
UV-VIS molecular spectroscopy.202004201521035685ranvijay_engg_UV_and_VISIBLE_...UV-VIS molecular spectroscopy.202004201521035685ranvijay_engg_UV_and_VISIBLE_...
UV-VIS molecular spectroscopy.202004201521035685ranvijay_engg_UV_and_VISIBLE_...
 
Presentation2
Presentation2Presentation2
Presentation2
 
Uv visiblr spectroscopy
Uv visiblr spectroscopyUv visiblr spectroscopy
Uv visiblr spectroscopy
 
uv spectroscopy by HARVINDAR SINGH .M.PHARM PHARMACEUTICS
 uv spectroscopy by HARVINDAR SINGH .M.PHARM PHARMACEUTICS uv spectroscopy by HARVINDAR SINGH .M.PHARM PHARMACEUTICS
uv spectroscopy by HARVINDAR SINGH .M.PHARM PHARMACEUTICS
 
Uv visible spectroscopy
Uv visible spectroscopyUv visible spectroscopy
Uv visible spectroscopy
 

Recently uploaded

The Challenger.pdf DNHS Official Publication
The Challenger.pdf DNHS Official PublicationThe Challenger.pdf DNHS Official Publication
The Challenger.pdf DNHS Official Publication
Delapenabediema
 
The geography of Taylor Swift - some ideas
The geography of Taylor Swift - some ideasThe geography of Taylor Swift - some ideas
The geography of Taylor Swift - some ideas
GeoBlogs
 
Polish students' mobility in the Czech Republic
Polish students' mobility in the Czech RepublicPolish students' mobility in the Czech Republic
Polish students' mobility in the Czech Republic
Anna Sz.
 
The French Revolution Class 9 Study Material pdf free download
The French Revolution Class 9 Study Material pdf free downloadThe French Revolution Class 9 Study Material pdf free download
The French Revolution Class 9 Study Material pdf free download
Vivekanand Anglo Vedic Academy
 
Guidance_and_Counselling.pdf B.Ed. 4th Semester
Guidance_and_Counselling.pdf B.Ed. 4th SemesterGuidance_and_Counselling.pdf B.Ed. 4th Semester
Guidance_and_Counselling.pdf B.Ed. 4th Semester
Atul Kumar Singh
 
How to Make a Field invisible in Odoo 17
How to Make a Field invisible in Odoo 17How to Make a Field invisible in Odoo 17
How to Make a Field invisible in Odoo 17
Celine George
 
678020731-Sumas-y-Restas-Para-Colorear.pdf
678020731-Sumas-y-Restas-Para-Colorear.pdf678020731-Sumas-y-Restas-Para-Colorear.pdf
678020731-Sumas-y-Restas-Para-Colorear.pdf
CarlosHernanMontoyab2
 
CLASS 11 CBSE B.St Project AIDS TO TRADE - INSURANCE
CLASS 11 CBSE B.St Project AIDS TO TRADE - INSURANCECLASS 11 CBSE B.St Project AIDS TO TRADE - INSURANCE
CLASS 11 CBSE B.St Project AIDS TO TRADE - INSURANCE
BhavyaRajput3
 
Adversarial Attention Modeling for Multi-dimensional Emotion Regression.pdf
Adversarial Attention Modeling for Multi-dimensional Emotion Regression.pdfAdversarial Attention Modeling for Multi-dimensional Emotion Regression.pdf
Adversarial Attention Modeling for Multi-dimensional Emotion Regression.pdf
Po-Chuan Chen
 
"Protectable subject matters, Protection in biotechnology, Protection of othe...
"Protectable subject matters, Protection in biotechnology, Protection of othe..."Protectable subject matters, Protection in biotechnology, Protection of othe...
"Protectable subject matters, Protection in biotechnology, Protection of othe...
SACHIN R KONDAGURI
 
TESDA TM1 REVIEWER FOR NATIONAL ASSESSMENT WRITTEN AND ORAL QUESTIONS WITH A...
TESDA TM1 REVIEWER  FOR NATIONAL ASSESSMENT WRITTEN AND ORAL QUESTIONS WITH A...TESDA TM1 REVIEWER  FOR NATIONAL ASSESSMENT WRITTEN AND ORAL QUESTIONS WITH A...
TESDA TM1 REVIEWER FOR NATIONAL ASSESSMENT WRITTEN AND ORAL QUESTIONS WITH A...
EugeneSaldivar
 
Instructions for Submissions thorugh G- Classroom.pptx
Instructions for Submissions thorugh G- Classroom.pptxInstructions for Submissions thorugh G- Classroom.pptx
Instructions for Submissions thorugh G- Classroom.pptx
Jheel Barad
 
aaaaaaaaaaaaaaaaaaaaaaaaaaaaaaaaaaaaaaaaa
aaaaaaaaaaaaaaaaaaaaaaaaaaaaaaaaaaaaaaaaaaaaaaaaaaaaaaaaaaaaaaaaaaaaaaaaaaaaaaaaaa
aaaaaaaaaaaaaaaaaaaaaaaaaaaaaaaaaaaaaaaaa
siemaillard
 
BÀI TẬP BỔ TRỢ TIẾNG ANH GLOBAL SUCCESS LỚP 3 - CẢ NĂM (CÓ FILE NGHE VÀ ĐÁP Á...
BÀI TẬP BỔ TRỢ TIẾNG ANH GLOBAL SUCCESS LỚP 3 - CẢ NĂM (CÓ FILE NGHE VÀ ĐÁP Á...BÀI TẬP BỔ TRỢ TIẾNG ANH GLOBAL SUCCESS LỚP 3 - CẢ NĂM (CÓ FILE NGHE VÀ ĐÁP Á...
BÀI TẬP BỔ TRỢ TIẾNG ANH GLOBAL SUCCESS LỚP 3 - CẢ NĂM (CÓ FILE NGHE VÀ ĐÁP Á...
Nguyen Thanh Tu Collection
 
Honest Reviews of Tim Han LMA Course Program.pptx
Honest Reviews of Tim Han LMA Course Program.pptxHonest Reviews of Tim Han LMA Course Program.pptx
Honest Reviews of Tim Han LMA Course Program.pptx
timhan337
 
Lapbook sobre os Regimes Totalitários.pdf
Lapbook sobre os Regimes Totalitários.pdfLapbook sobre os Regimes Totalitários.pdf
Lapbook sobre os Regimes Totalitários.pdf
Jean Carlos Nunes Paixão
 
Digital Tools and AI for Teaching Learning and Research
Digital Tools and AI for Teaching Learning and ResearchDigital Tools and AI for Teaching Learning and Research
Digital Tools and AI for Teaching Learning and Research
Vikramjit Singh
 
Unit 2- Research Aptitude (UGC NET Paper I).pdf
Unit 2- Research Aptitude (UGC NET Paper I).pdfUnit 2- Research Aptitude (UGC NET Paper I).pdf
Unit 2- Research Aptitude (UGC NET Paper I).pdf
Thiyagu K
 
Home assignment II on Spectroscopy 2024 Answers.pdf
Home assignment II on Spectroscopy 2024 Answers.pdfHome assignment II on Spectroscopy 2024 Answers.pdf
Home assignment II on Spectroscopy 2024 Answers.pdf
Tamralipta Mahavidyalaya
 
Operation Blue Star - Saka Neela Tara
Operation Blue Star   -  Saka Neela TaraOperation Blue Star   -  Saka Neela Tara
Operation Blue Star - Saka Neela Tara
Balvir Singh
 

Recently uploaded (20)

The Challenger.pdf DNHS Official Publication
The Challenger.pdf DNHS Official PublicationThe Challenger.pdf DNHS Official Publication
The Challenger.pdf DNHS Official Publication
 
The geography of Taylor Swift - some ideas
The geography of Taylor Swift - some ideasThe geography of Taylor Swift - some ideas
The geography of Taylor Swift - some ideas
 
Polish students' mobility in the Czech Republic
Polish students' mobility in the Czech RepublicPolish students' mobility in the Czech Republic
Polish students' mobility in the Czech Republic
 
The French Revolution Class 9 Study Material pdf free download
The French Revolution Class 9 Study Material pdf free downloadThe French Revolution Class 9 Study Material pdf free download
The French Revolution Class 9 Study Material pdf free download
 
Guidance_and_Counselling.pdf B.Ed. 4th Semester
Guidance_and_Counselling.pdf B.Ed. 4th SemesterGuidance_and_Counselling.pdf B.Ed. 4th Semester
Guidance_and_Counselling.pdf B.Ed. 4th Semester
 
How to Make a Field invisible in Odoo 17
How to Make a Field invisible in Odoo 17How to Make a Field invisible in Odoo 17
How to Make a Field invisible in Odoo 17
 
678020731-Sumas-y-Restas-Para-Colorear.pdf
678020731-Sumas-y-Restas-Para-Colorear.pdf678020731-Sumas-y-Restas-Para-Colorear.pdf
678020731-Sumas-y-Restas-Para-Colorear.pdf
 
CLASS 11 CBSE B.St Project AIDS TO TRADE - INSURANCE
CLASS 11 CBSE B.St Project AIDS TO TRADE - INSURANCECLASS 11 CBSE B.St Project AIDS TO TRADE - INSURANCE
CLASS 11 CBSE B.St Project AIDS TO TRADE - INSURANCE
 
Adversarial Attention Modeling for Multi-dimensional Emotion Regression.pdf
Adversarial Attention Modeling for Multi-dimensional Emotion Regression.pdfAdversarial Attention Modeling for Multi-dimensional Emotion Regression.pdf
Adversarial Attention Modeling for Multi-dimensional Emotion Regression.pdf
 
"Protectable subject matters, Protection in biotechnology, Protection of othe...
"Protectable subject matters, Protection in biotechnology, Protection of othe..."Protectable subject matters, Protection in biotechnology, Protection of othe...
"Protectable subject matters, Protection in biotechnology, Protection of othe...
 
TESDA TM1 REVIEWER FOR NATIONAL ASSESSMENT WRITTEN AND ORAL QUESTIONS WITH A...
TESDA TM1 REVIEWER  FOR NATIONAL ASSESSMENT WRITTEN AND ORAL QUESTIONS WITH A...TESDA TM1 REVIEWER  FOR NATIONAL ASSESSMENT WRITTEN AND ORAL QUESTIONS WITH A...
TESDA TM1 REVIEWER FOR NATIONAL ASSESSMENT WRITTEN AND ORAL QUESTIONS WITH A...
 
Instructions for Submissions thorugh G- Classroom.pptx
Instructions for Submissions thorugh G- Classroom.pptxInstructions for Submissions thorugh G- Classroom.pptx
Instructions for Submissions thorugh G- Classroom.pptx
 
aaaaaaaaaaaaaaaaaaaaaaaaaaaaaaaaaaaaaaaaa
aaaaaaaaaaaaaaaaaaaaaaaaaaaaaaaaaaaaaaaaaaaaaaaaaaaaaaaaaaaaaaaaaaaaaaaaaaaaaaaaaa
aaaaaaaaaaaaaaaaaaaaaaaaaaaaaaaaaaaaaaaaa
 
BÀI TẬP BỔ TRỢ TIẾNG ANH GLOBAL SUCCESS LỚP 3 - CẢ NĂM (CÓ FILE NGHE VÀ ĐÁP Á...
BÀI TẬP BỔ TRỢ TIẾNG ANH GLOBAL SUCCESS LỚP 3 - CẢ NĂM (CÓ FILE NGHE VÀ ĐÁP Á...BÀI TẬP BỔ TRỢ TIẾNG ANH GLOBAL SUCCESS LỚP 3 - CẢ NĂM (CÓ FILE NGHE VÀ ĐÁP Á...
BÀI TẬP BỔ TRỢ TIẾNG ANH GLOBAL SUCCESS LỚP 3 - CẢ NĂM (CÓ FILE NGHE VÀ ĐÁP Á...
 
Honest Reviews of Tim Han LMA Course Program.pptx
Honest Reviews of Tim Han LMA Course Program.pptxHonest Reviews of Tim Han LMA Course Program.pptx
Honest Reviews of Tim Han LMA Course Program.pptx
 
Lapbook sobre os Regimes Totalitários.pdf
Lapbook sobre os Regimes Totalitários.pdfLapbook sobre os Regimes Totalitários.pdf
Lapbook sobre os Regimes Totalitários.pdf
 
Digital Tools and AI for Teaching Learning and Research
Digital Tools and AI for Teaching Learning and ResearchDigital Tools and AI for Teaching Learning and Research
Digital Tools and AI for Teaching Learning and Research
 
Unit 2- Research Aptitude (UGC NET Paper I).pdf
Unit 2- Research Aptitude (UGC NET Paper I).pdfUnit 2- Research Aptitude (UGC NET Paper I).pdf
Unit 2- Research Aptitude (UGC NET Paper I).pdf
 
Home assignment II on Spectroscopy 2024 Answers.pdf
Home assignment II on Spectroscopy 2024 Answers.pdfHome assignment II on Spectroscopy 2024 Answers.pdf
Home assignment II on Spectroscopy 2024 Answers.pdf
 
Operation Blue Star - Saka Neela Tara
Operation Blue Star   -  Saka Neela TaraOperation Blue Star   -  Saka Neela Tara
Operation Blue Star - Saka Neela Tara
 

uv -visible spectroscopy

  • 1. UV–Visible spectrophotometry Prepared by Yogita Chunchuwar - Mandlik M-Pharm ( Pharmaceutics) sem I Priyadarshini J.L.College of pharmacy, Nagpur.
  • 2. It is the branch of science that deals with the study of interaction of matter with light. OR • It is the branch of science that deals with the study of interaction of electromagnetic radiation with matter. In simple words, it is a method to measure how much light is absorbed by a chemical substance and at what intensity of light passes through it. As per analytical science, every element or compound has a unique characteristic spectrum. Spectroscopy is used in physical and analytical chemistry to detect, determine, or quantify the molecular and/or structural composition of a sample. Different Types of Spectroscopy Infrared (IR) Spectroscopy. Ultraviolet-Visible (UV/Vis) Spectroscopy. Nuclear Magnetic Resonance (NMR) Spectroscopy. X-Ray Spectroscopy. Spectroscopy
  • 3. UV–Visible spectrophotometry UV–Vis spectrophotometry has been widely used for the identification and quantification of organic compounds. Uv-vis spectroscopy is also known as electronic spectroscopy.
  • 4. In spectroscopic analysis, when radiations interact with a chemical species, they can cause transition at different energy levels. The type of transition depends upon the energy of the radiation and the detection mode. The transition of electrons always occurs from the ground state of low energy HOMO (highest occupied molecular orbital) to a higher energy excited state LUMO (lowest unoccupied molecular orbital). The overlap of atomic orbitals forms three types of molecular orbitals. This whole concept arises from molecular orbital theory (MOT). Bonding molecular orbitals of lower energy. Non-bonding molecular orbitals of intermediate energy. Anti bonding molecular orbitals are of higher energy.
  • 5. Principle of UV-Visible Spectroscopy The Principle of UV-Visible Spectroscopy is based on the absorption of ultraviolet light or visible light by chemical compounds, which results in the production of distinct spectra. When matter absorbs ultraviolet radiation, the electrons present in it undergo excitation. This causes them to jump from a ground state (an energy state with a relatively small amount of energy associated with it) to an excited state (an energy state with a relatively large amount of energy associated with it). It is important to note that the difference in the energies of the ground state and the excited state of the electron is always equal to the amount of ultraviolet radiation or visible radiation absorbed by it. Ultraviolet/Visible area (UV-Vis) measurements span wavelengths from around 200 nm to 800 nm. {UV (180–390 nm) or visible (390–780 nm) }
  • 6. The Beer-Lambert Law What is Beer’s Law? Beer law states that concentration and absorbance are directly proportional to each other and it was stated by August Beer. What is Lambert Law? Lambert law states that absorbance and path length are directly proportional ,and it was stated by Johann Heinrich Lambert.The statement of the Beer-Lambert law can be written as follows: When a beam of monochromatic light is made incident on a solution that contains a substance that absorbs the monochromatic light, the rate at which the intensity of the beam decreases along the thickness of the solution is directly proportional to the concentration of the absorbing substance in the solution and is also directly proportional to the intensity of the incident monochromatic radiation. Or According to Beer-Lambert Law, the amount of light absorbed is directly proportional to the concentration of the sample and the distance the light travels through the sample; the pathlength. As per the Beer-Lambert law, the greater the number of absorbing molecules (that have the ability to absorb light of a specific wavelength), the greater the extent of absorption of the radiation.
  • 7. The Beer-Lambert Law The Absorbance of a Solution For each wavelength of light passing through the spectrometer, the intensity of the light passing through the reference cell is measured. This is usually referred to as -Io( Io for Intensity.) Light absorbed by sample in a cuvette The intensity of the light passing through the sample cell is also measured for that wavelength , reffered as –It 1.The absorbance is directly proportional to the concentration (c) of the solution of the sample used in the experiment, A∝ C 2.The absorbance is directly proportional to the length of the light path (l), which is equal to the width of the cuvette, A∝ l Combining Equations 1 and 2: A∝ Cl This proportionality can be converted into an equality by including a proportionality constant (ε ). A= ε Cl This formula is the common form of the Beer-Lambert Law, although it can be also written in terms of intensities: A=log10(It / Io )= ε lc
  • 8. If It is less than Io, then the sample has absorbed some of the light. Then A, is the absorbance of a transition depends on two external assumptions – 1.The absorbance is directly proportional to the concentration (c) of the solution of the sample used in the experiment, A∝ C 2.The absorbance is directly proportional to the length of the light path (l), which is equal to the width of the cuvette, A∝ l Combining Equations 1 and 2: A∝ Cl This proportionality can be converted into an equality by including a proportionality constant (ε ). A= ε C l This formula is the common form of the Beer-Lambert Law, although it can be also written in terms of intensities: A=log10(It / Io )= ε C l ε is the molar absorptivity coefficient constant.
  • 9. Limitations of lambert beer law  The light source used must be monochromatic.  This is not suitable for concentrated solutions i.e. It can only be applicable to dilute solutions.  With an increase in dilution, the dissociation of weak acids occurs. The weak acids reach equilibrium with their conjugate base. The acid (HA) and conjugate base (A–) cannot have the same absorbance. Hence this law is not completely applicable to weak acidic solutions.
  • 10. Ultraviolet–visible spectrophotometer instrumentation - The instrument used in ultraviolet–visible spectroscopy is called a UV/Visible spectrophotometer. It measures the intensity of light after passing through a sample It, and compares it to the intensity of light before it passes through the sample Io The ratio It /Io is called the transmittance, and is usually expressed as a percentage (%T). The UV–visible spectrophotometer can also be configured to measure reflectance. In this case, the spectrophotometer measures the intensity of light reflected from a sample Io, and compares it to the intensity of light reflected from a reference material Ir. The ratio Ir Io is called the reflectance, and is usually expressed as a percentage (%R). The basic parts of a spectrophotometer are a light source, a holder for the sample, a diffraction grating in a monochromator or a prism to separate the different wavelengths of light, and a detector. A spectrophotometer can be either single beam or double beam. In a single beam instrument (such as the Spectronic 20 ), all of the light passes through the sample cell. Io must be measured by removing the sample. In a double-beam instrument, the light is split into two beams before it reaches the sample.One beam is used as the reference; the other beam passes through the sample. The reference beam intensity is taken as 100% Transmission (or 0 Absorbance), and the measurement displayed is the ratio of the two beam intensities. Some double-beam instruments have two detectors (photodiodes), and the sample and reference beam are measured at the same time.
  • 11. In other instruments, the two beams pass through a beam chopper, which blocks one beam at a time. The detector alternates between measuring the sample beam and the reference beam in synchronism with the chopper. block diagram of the single beam UV-Visible spectrometer. block diagram of the souble beam UV-Visible spectrometer
  • 12. Instrumentation of UV-visible spectroscopy The basic instrumentation of the UV-vis spectrometer comprises of 1. Light source 2. Diffraction grating 3. Wavelength selector 4. Sample container or cuvette 5. Detector 1. Light Source Light sources that lie in the ultraviolet and visible region are used as UV-visible spectrometer sources. 1. Hydrogen & deuterium lamps range 160-380nm 2. Xenon arc lamps range 250-600nm 3. Tungsten halogen lamps range 240-2500nm 4. more recently, light emitting diodes (LED)
  • 13. Types of the wavelength selectors 1. Filters 2. Monochromators Filters Filters are used to permit a certain band of wavelength. The simplest type of filter is the absorption filter. Most commonly colored glass filters are used. They absorb a broad portion of the spectrum (complementary colors) and transmit other portions (its own color). Advantages • The filters are inexpensive. . They possess technical simplicity. Disadvantages • The filters are restricted to the visible region only. • They are not very good wavelength selectors. • Not useful for research purposes as they allow broad bandwidth. So there are more chances o deviation from Lambert beer’s law. Monochromators A monochromator is an optical device that is used to select a narrow band of a wavelength of light. It may be a quartz prism or grating. Uses of monochromators Monochromators are used for spectral scanning i.e. varying wavelength of radiation over a range. They can be used for the UV-visible region. Components of a monochromator All monochromators are similar in mechanical construction. The essential components of a monochromator are: 1.Slit 2.Mirror 3.Lense 4.Grating/prism
  • 14. 3. Sample container/cells or cuvettes Sample containers or cuvettes may be made up of • Quartz • Borosilicate • Plastic Only quartz is transparent in both UV & visible regions (200-700nm range). Glass & plastic are suitable for the visible region only. Glass is not suitable for the UV region because it absorbs UV radiation i.e. it is not transparent in the UV region. Plastic cells are not used for organic solvents. Cuvette size The most common cuvette size is 1 cm, although it can vary from 0.1-10 cm. 4. Detectors A detector is an important instrument in the UV-Vis spectrophotometer, used in the conversion of light into proportional electrical signals, which provides the response of a spectrophotometer. Nowadays, detectors used in UV-Visible spectroscopy are classified into - • Photomultiplier tube • Phototube • Diode array detector • Charge coupled device
  • 15. Phototube - A phototube comprises of a light-sensitive cathode and an anode inside an evacuated quartz envelope. A potential difference of approximately 100 V is applied between the two electrodes. A photon entering the tube strikes the cathode and results in ejection of an electron which strikes the anode and results in flow of current. The current is generally of low intensity and needs to be amplified. The response of the phototube is dependent on wavelength of incident light. Photomultiplier Tube - It comprises of a photosensitive cathode, anode and several dynodes. Photons entering the tube strike the cathode resulting in emission of electrons. The electrons are accelerated towards the first dynode which is 90 V more positive than the cathode.The electrons striking the first dynode resulted in several electrons for each incident electron. The process repeats itself from one dynode to next and after about 10 dynodes each photon results in production of 106 to 107 electrons. The resulting current often needs to be amplified. Photomultipliers have high sensitivity for UV and visible radiation and have fast response times. However, they are susceptible to damage when exposed to high intensity light. Photomultiplier tube is inherently more sensitive than the photo tube.
  • 16. charge-coupled device (CCD) is a light-sensitive integrated circuit that captures images by converting photons to electrons. A CCD sensor breaks the image elements into pixels. Each pixel is converted into an electrical charge whose intensity is related to the intensity of light captured by that pixel. • Diode array detector
  • 17. Factor affecting absorbance & intensity Conjugation Absorption shift towards longer wavelength, if double bonds (chromophore) present in the molecule are in conjugation. For example, UV-VISIBLE SPECTROSCOPY SOLVENT Solvent must be transparent with in the wavelength range being examined. It should not itself absorb radiation in the region under investigation It should be less polar, to minimum interaction with solute molecule. The most commonly used solvent is 95% ethanol. It Is a cheap , Good dissolving power. Benzene, chloroform, carbon tetrachloride can not be used. Because they absorb in the range of about 240 - 280nm. The solvent exerts a profound influence on the quality and shape of spectrum. The absorption spectrum of pharmaceutical substance depends practically upon the solvent that has been employed to solubilize the substance. drug may absorb a maximum radiation energy at particular wavelength in one solvent but shall absorb partially at the same wavelength in another solvent. Eg: acetone in n-hexane λ max at 279nm. Acetone in water λ max at 264.5nm
  • 18. Factor affecting absorbance & intensity Conjugation Absorption shift towards longer wavelength, if double bonds (chromophore) present in the molecule are in conjugation. For example, Absorption, intensity shift & UV spectrum a) Bathochromic shift: It is also known as Red shift, in this case absorption shift towards longer wavelength (𝜆max). b) Hypsochromic shift: It is also known as Blue shift, in this case absorption shift towards shorter wavelength (𝜆max). c) Hyperchromic shift: Intensity of absorption maximum (𝜀max) increases. d) Hypochromic shift: Intensity of absorption maximum (𝜀max) decrease
  • 19. Chromophores & Auxochromes a) Chromophores: A chromophore is that part of a molecule that absorbs UV or visible light.Chromophore is a covalently unsaturated group absorbed electromagnetic radiation in UV-visible region and impart color to the compound. For example, C=C, C≡C, benzene, NO2 etc. b) Auxochromes: Auxochrome is a saturated group (containing lone pair of electron), when auxochrome attach to the Chromophore absorption shift towards longer wavelength. For example, -OH, -SH, -NH etc
  • 20. Applications: 1. Detection of Impurities - It is one of the best methods for determination of impurities in organic molecules. Additional peaks can be observed due to impurities in the sample and it can be compared with that of standard raw material.. 2. Structure elucidation of organic compounds - It is useful in the structure elucidation of organic molecules, such as in detecting the presence or absence of unsaturation, the presence of hetero atoms 3. UV absorption spectroscopy can be used for the quantitative determination of compounds that absorb UV radiation. 4. 4. UV radiation thus used in qualitative determination of compounds. Identification is done by comparing the absorption spectrum with the spectra of known compounds. 5. This technique is used to detect the presence or absence of functional group in the compound. Absence of a band at particular wavelength regarded as an evidence for absence of particular group 6. Kinetics of reaction can also be studied using UV spectroscopy 7. Many drugs are either in the form of raw material or in the form of formulation. They can be assayed by making a suitable solution of the drug in a solvent and measuring the absorbance at specific wavelength. 8 8. Molecular weights of compounds can be measured spectrophotometrically by preparing the suitable derivatives of these compounds. 9. UV spectrophotometer may be used as a detector for HPLC.