Download to read offline


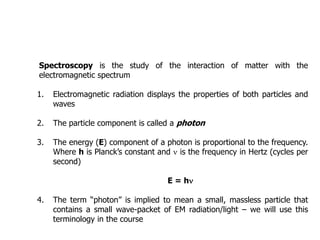

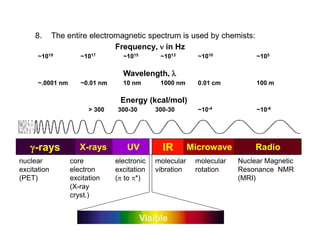
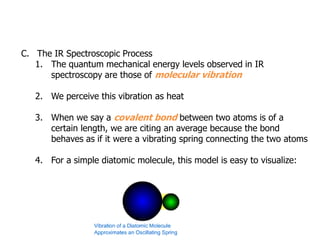
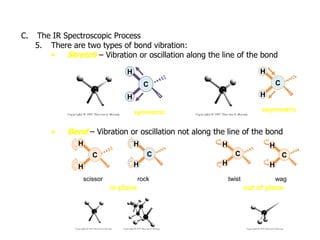
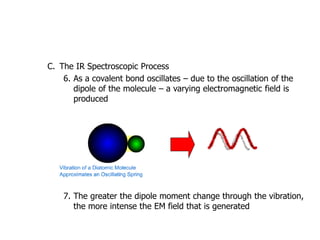

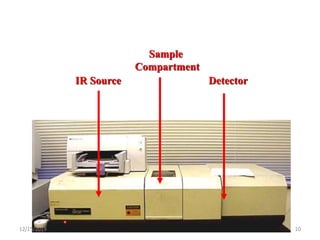
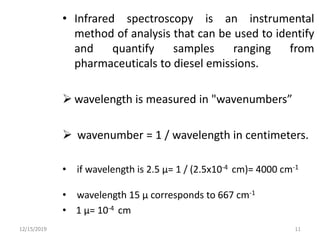
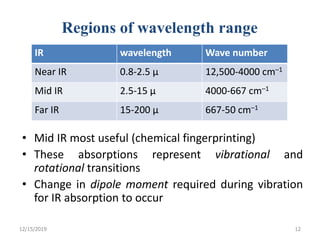
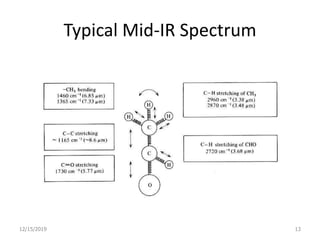
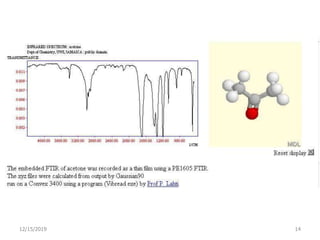
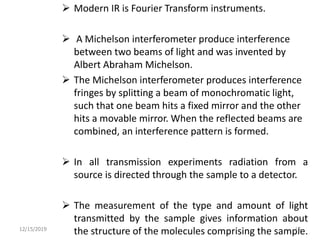
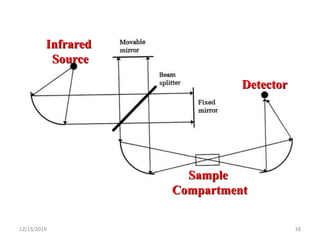


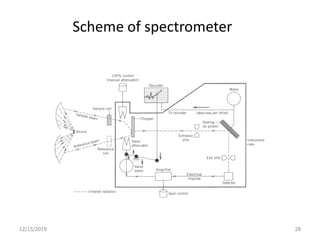


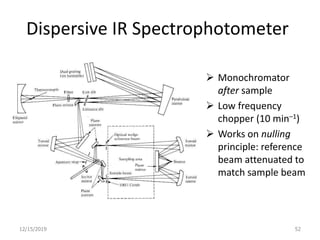
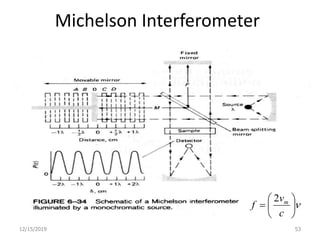
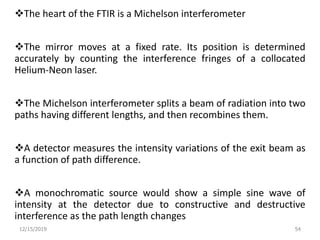
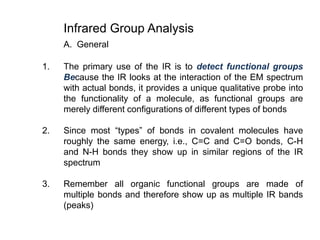
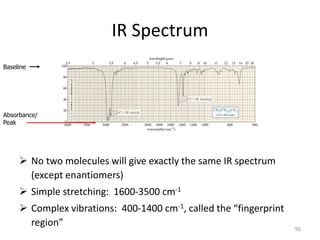


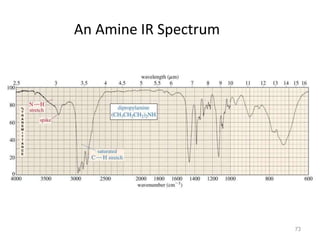


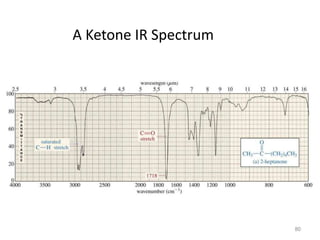


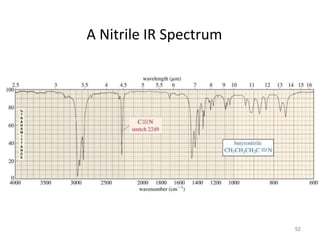
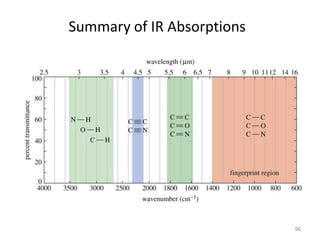


Infrared spectroscopy is a technique that uses infrared light to analyze chemical bonding and structure. It works by measuring the frequencies at which molecules vibrate and absorb infrared radiation. Modern infrared instruments use a Fourier transform method with an interferometer to produce an infrared spectrum that acts as a molecular "fingerprint". Infrared spectroscopy is useful for identifying unknown materials, determining molecular structure of organic and inorganic compounds, and studying molecular interactions.


