Downloaded 483 times


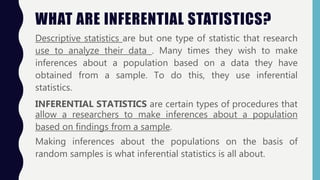
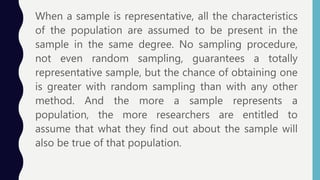


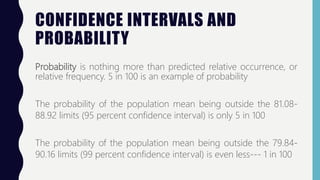


Inferential statistics allow researchers to make inferences about populations based on sample data, addressing concepts like sampling error, standard error, and confidence intervals. These statistics provide insights into population characteristics by analyzing the differences in sample means and estimating boundaries or limits for population means. Ultimately, the reliability of these inferences depends on the representativeness of the sample and the application of various statistical procedures like z scores.


