Downloaded 125 times
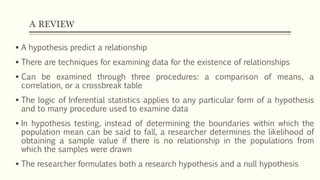
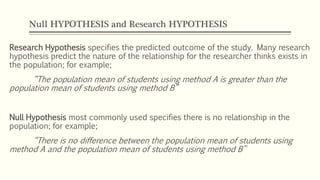


The document reviews hypothesis testing, detailing the distinction between research and null hypotheses and the process of determining statistical significance. It emphasizes the importance of understanding practical versus statistical significance and the potential for errors in hypothesis testing. Additionally, the document explains one-tailed and two-tailed tests, highlighting the need for careful interpretation of results.