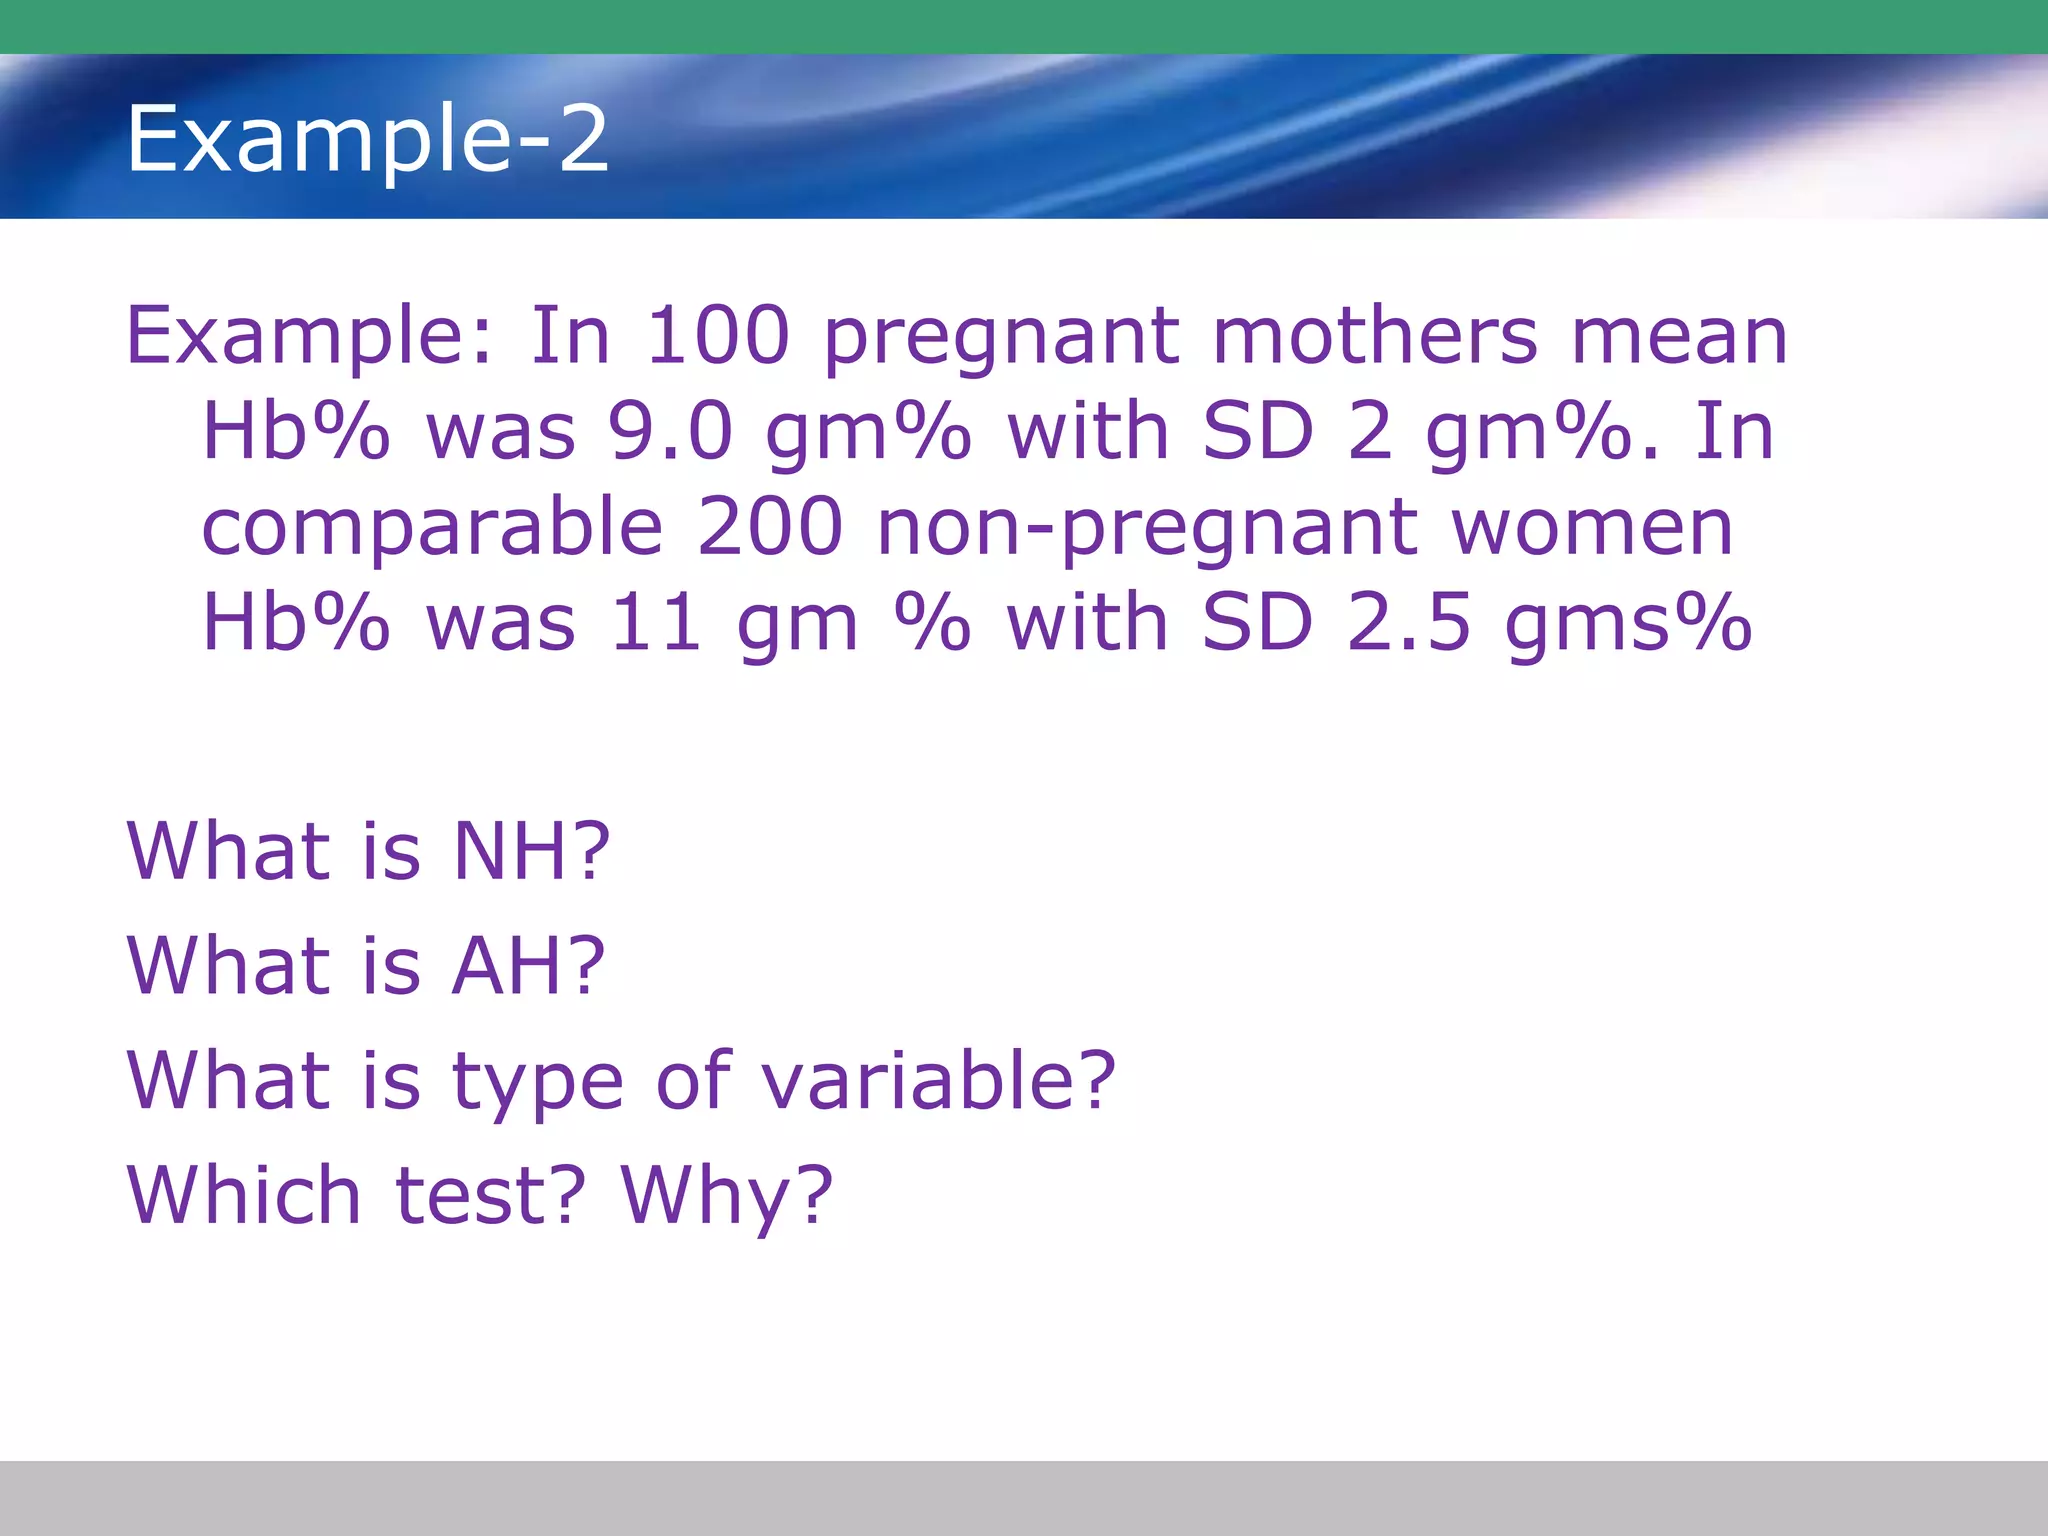
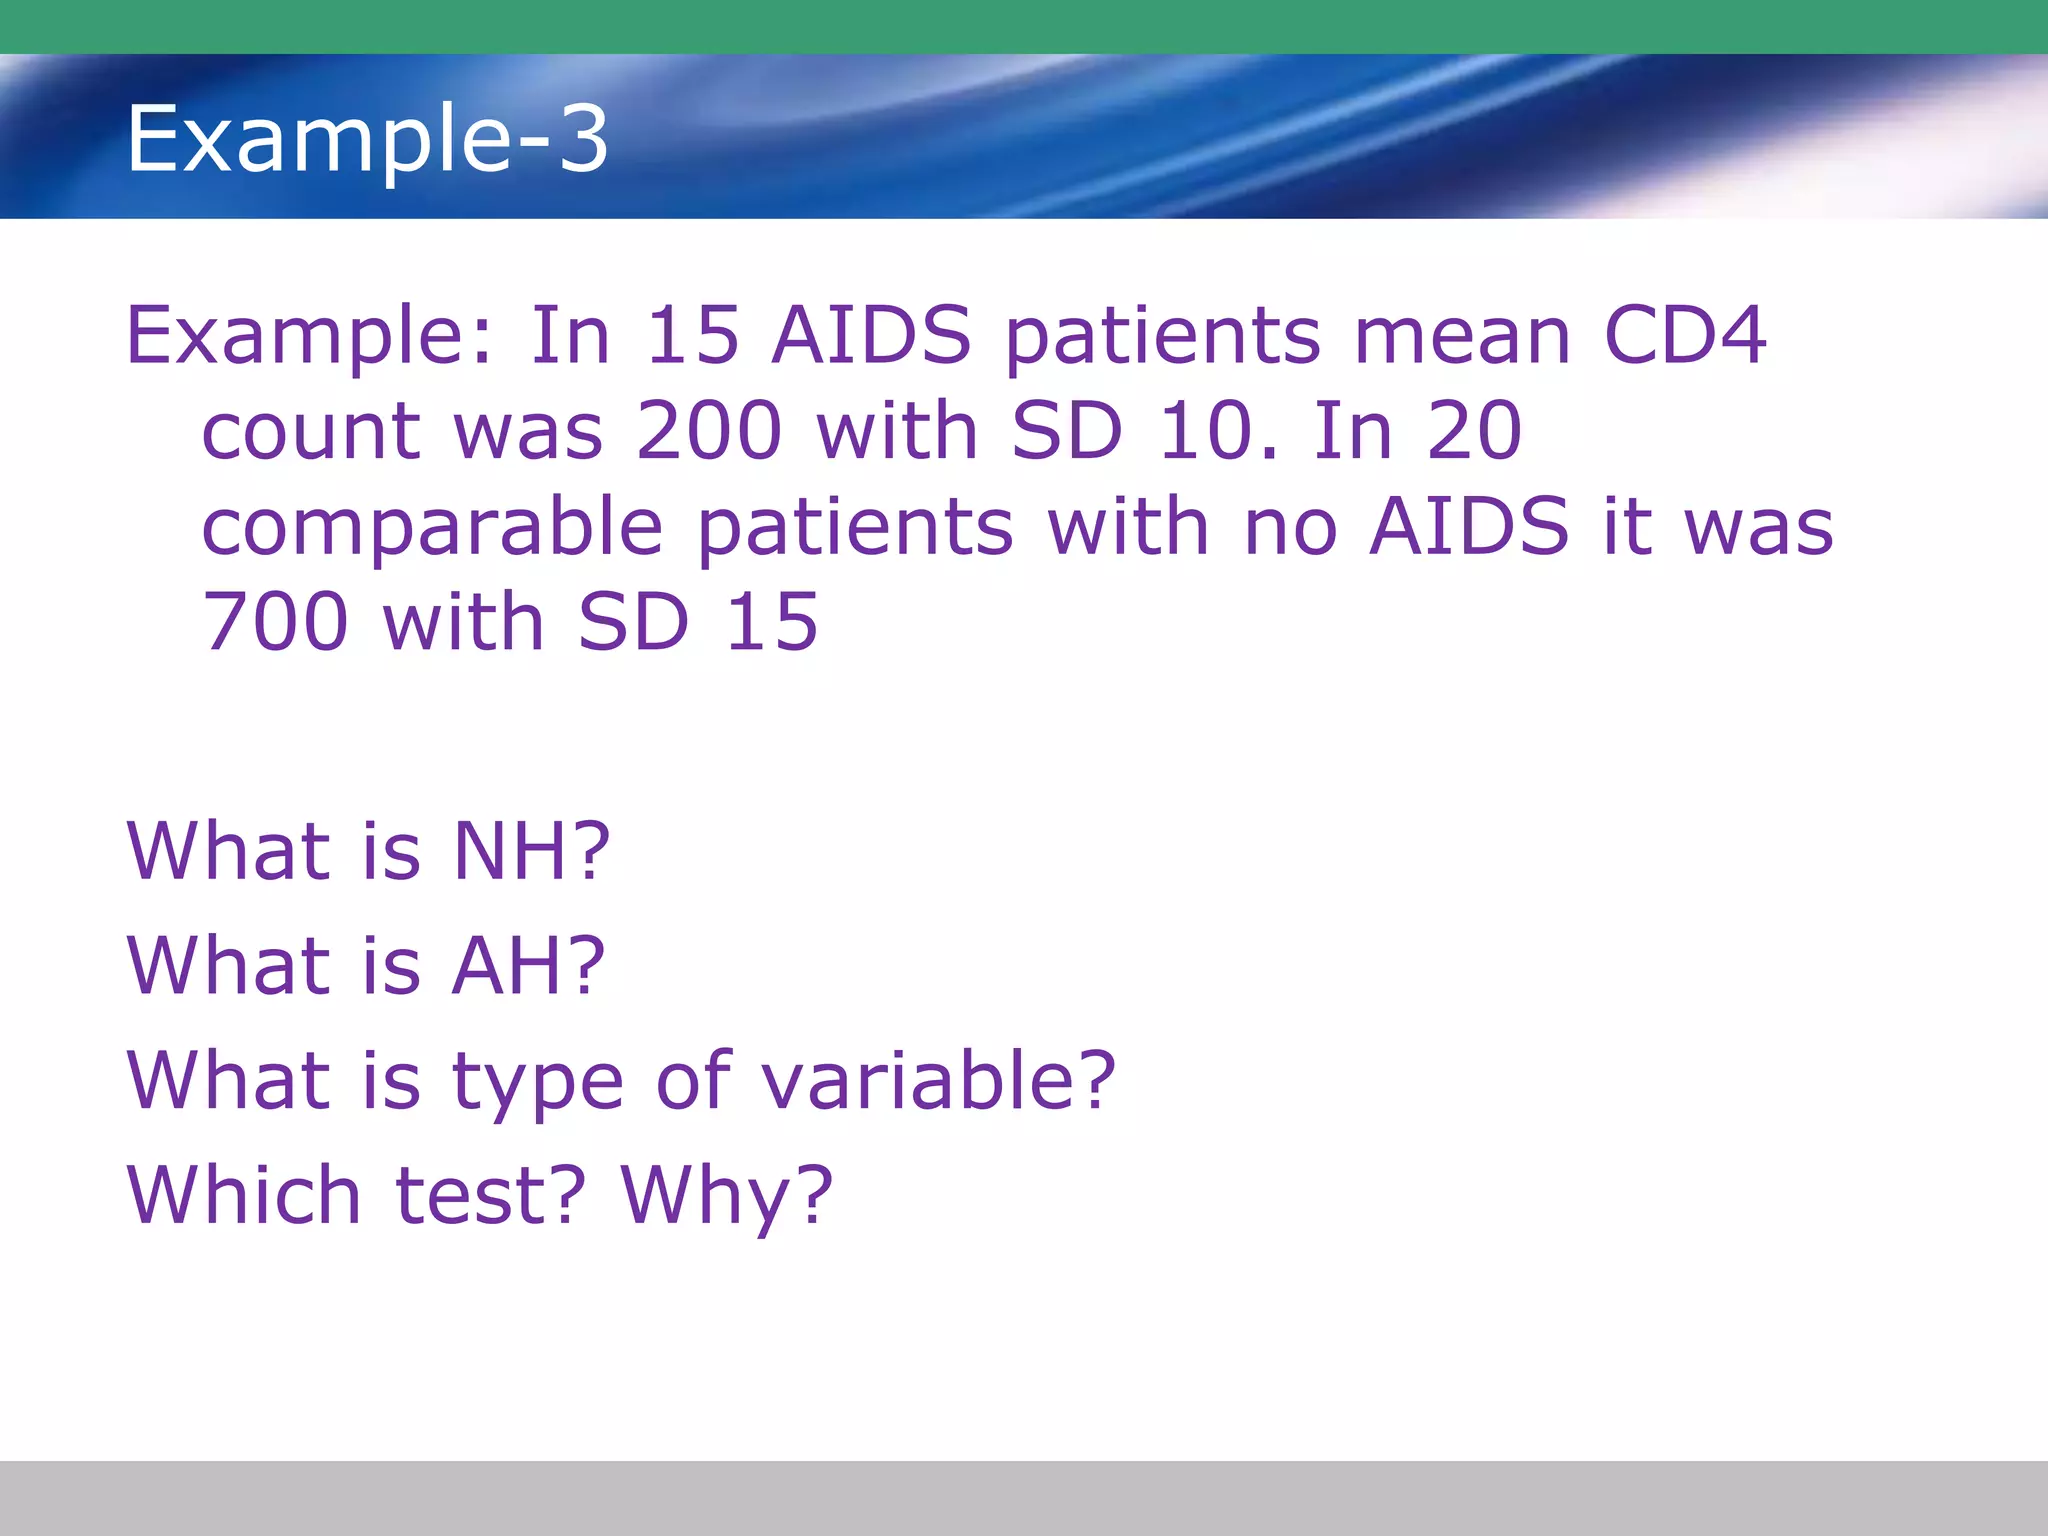
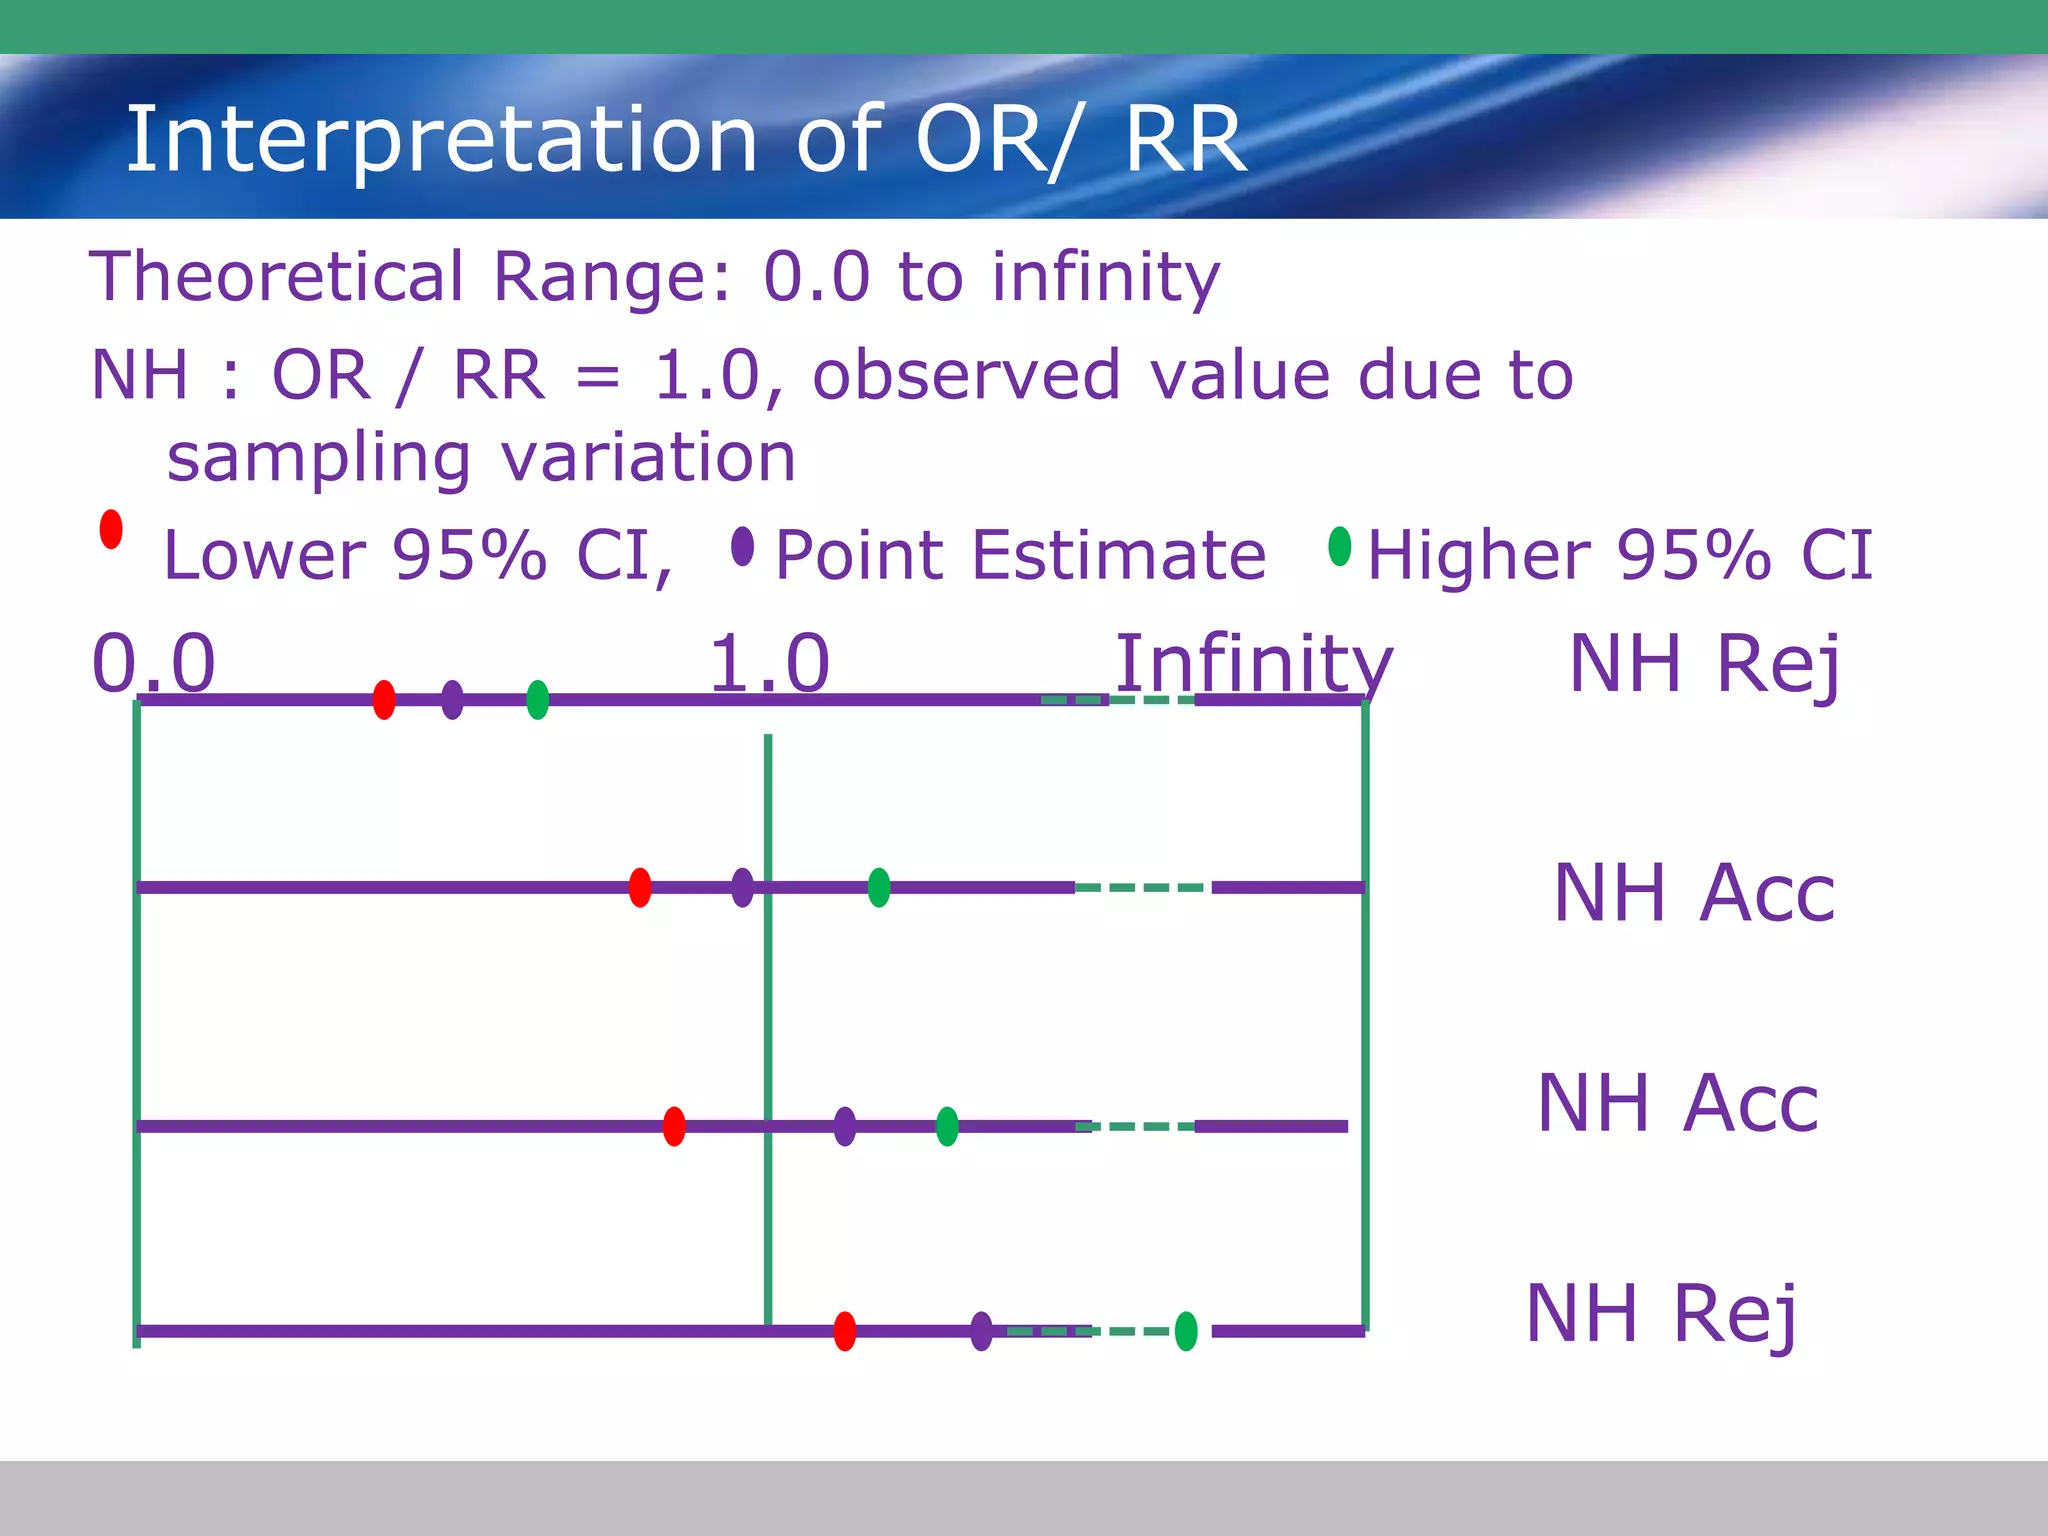
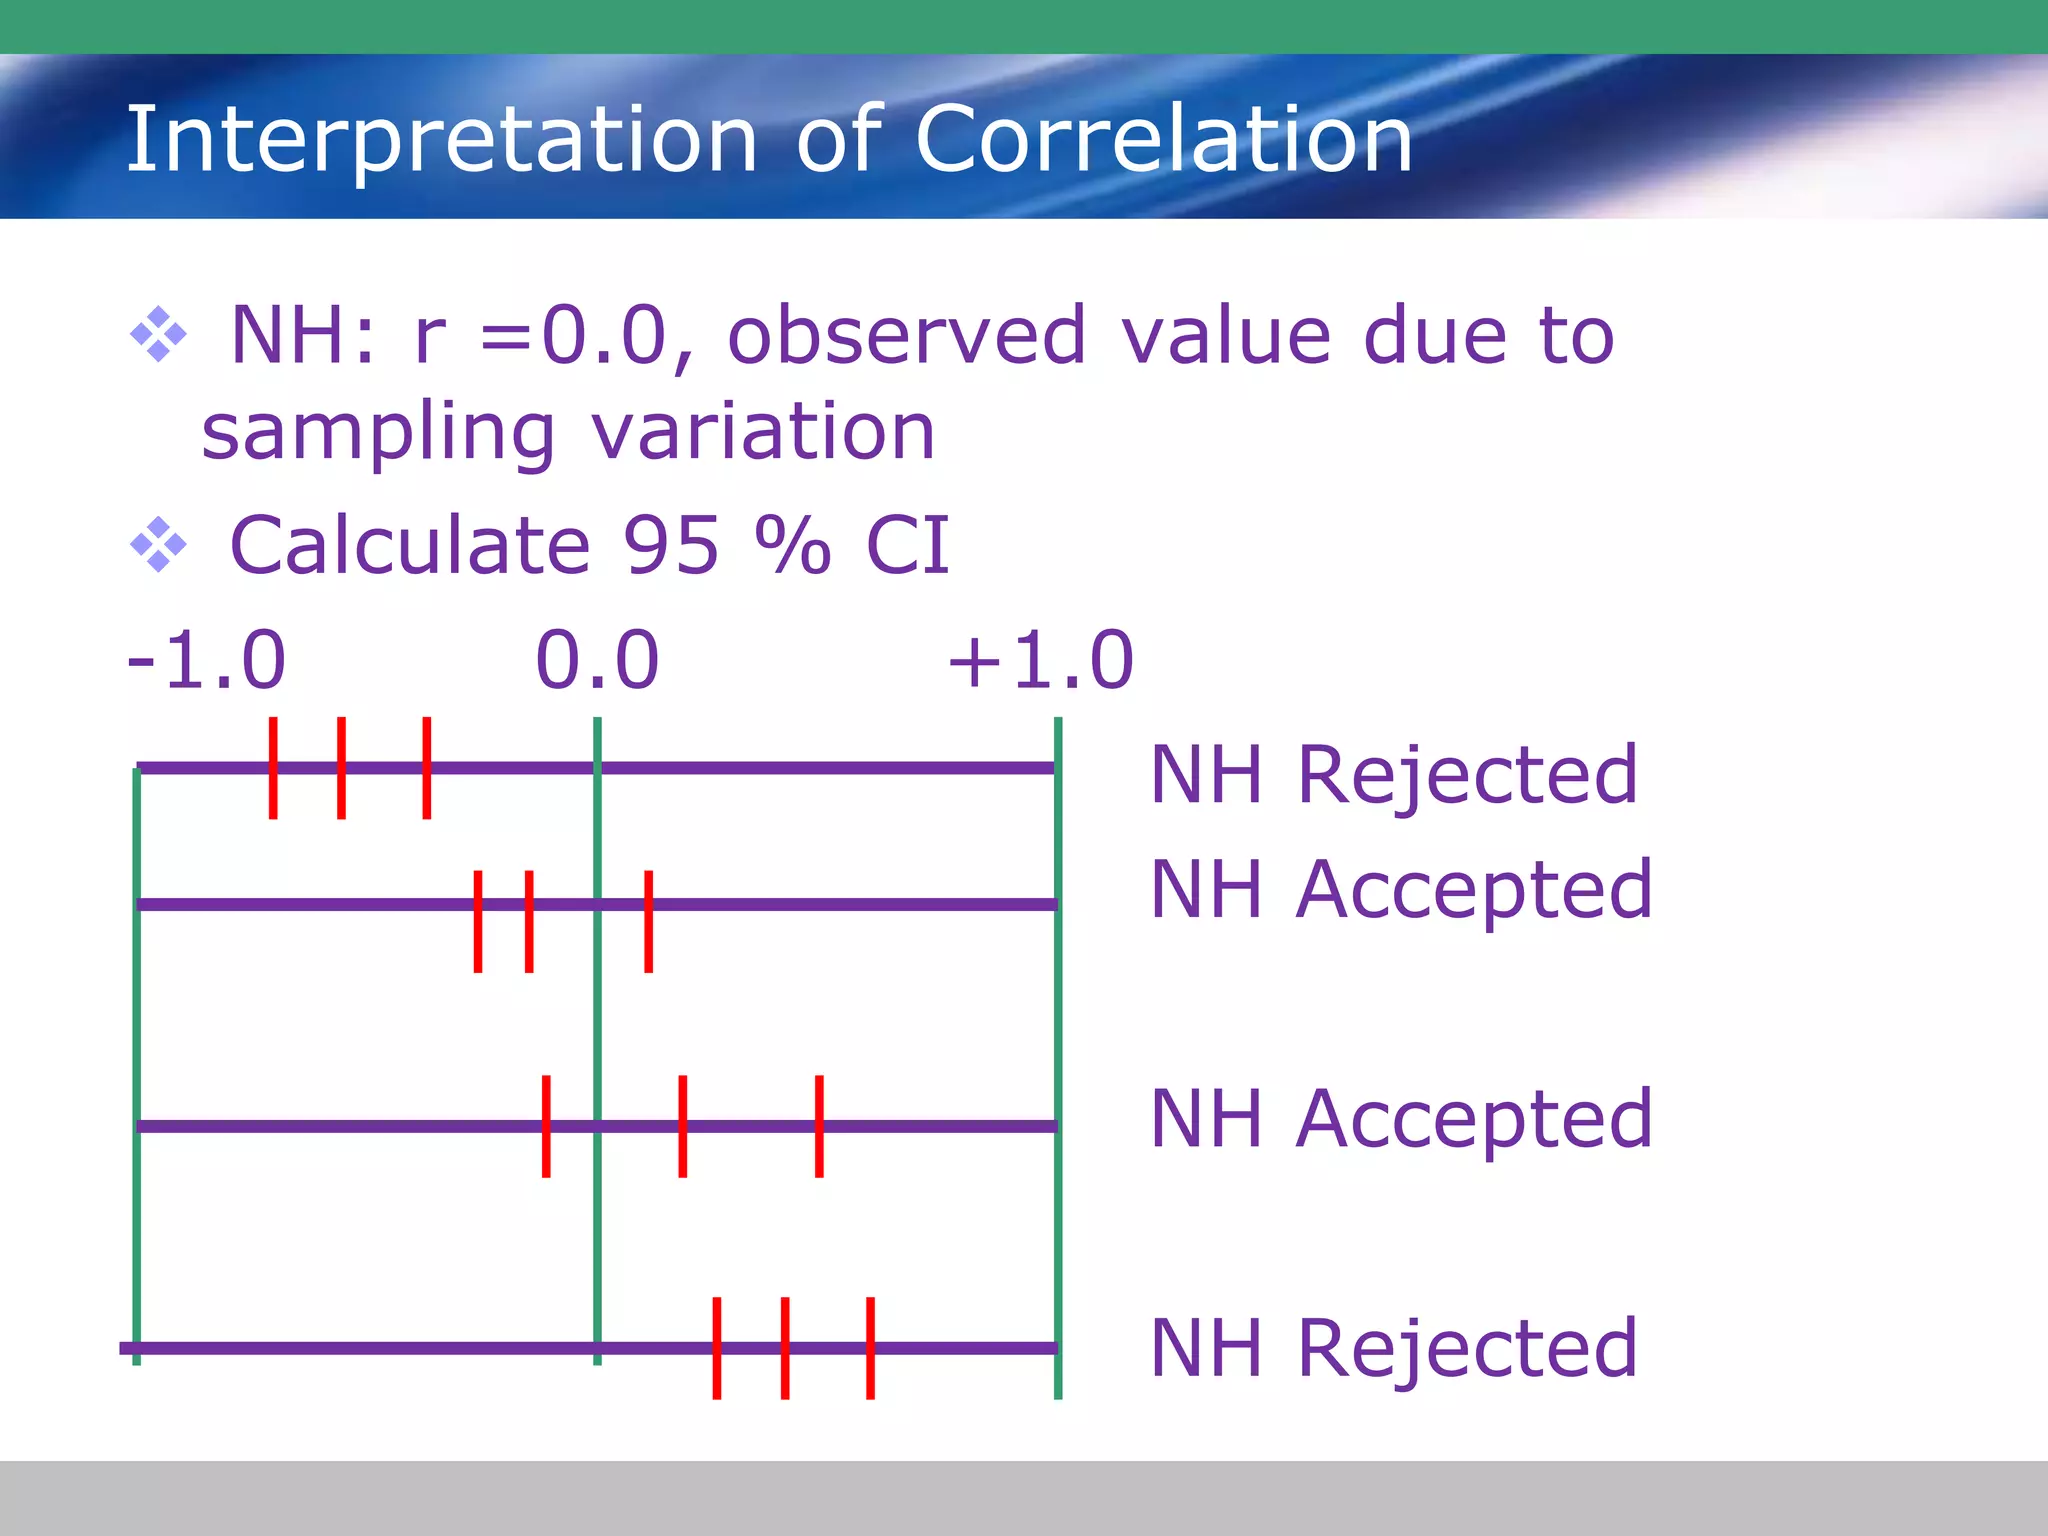
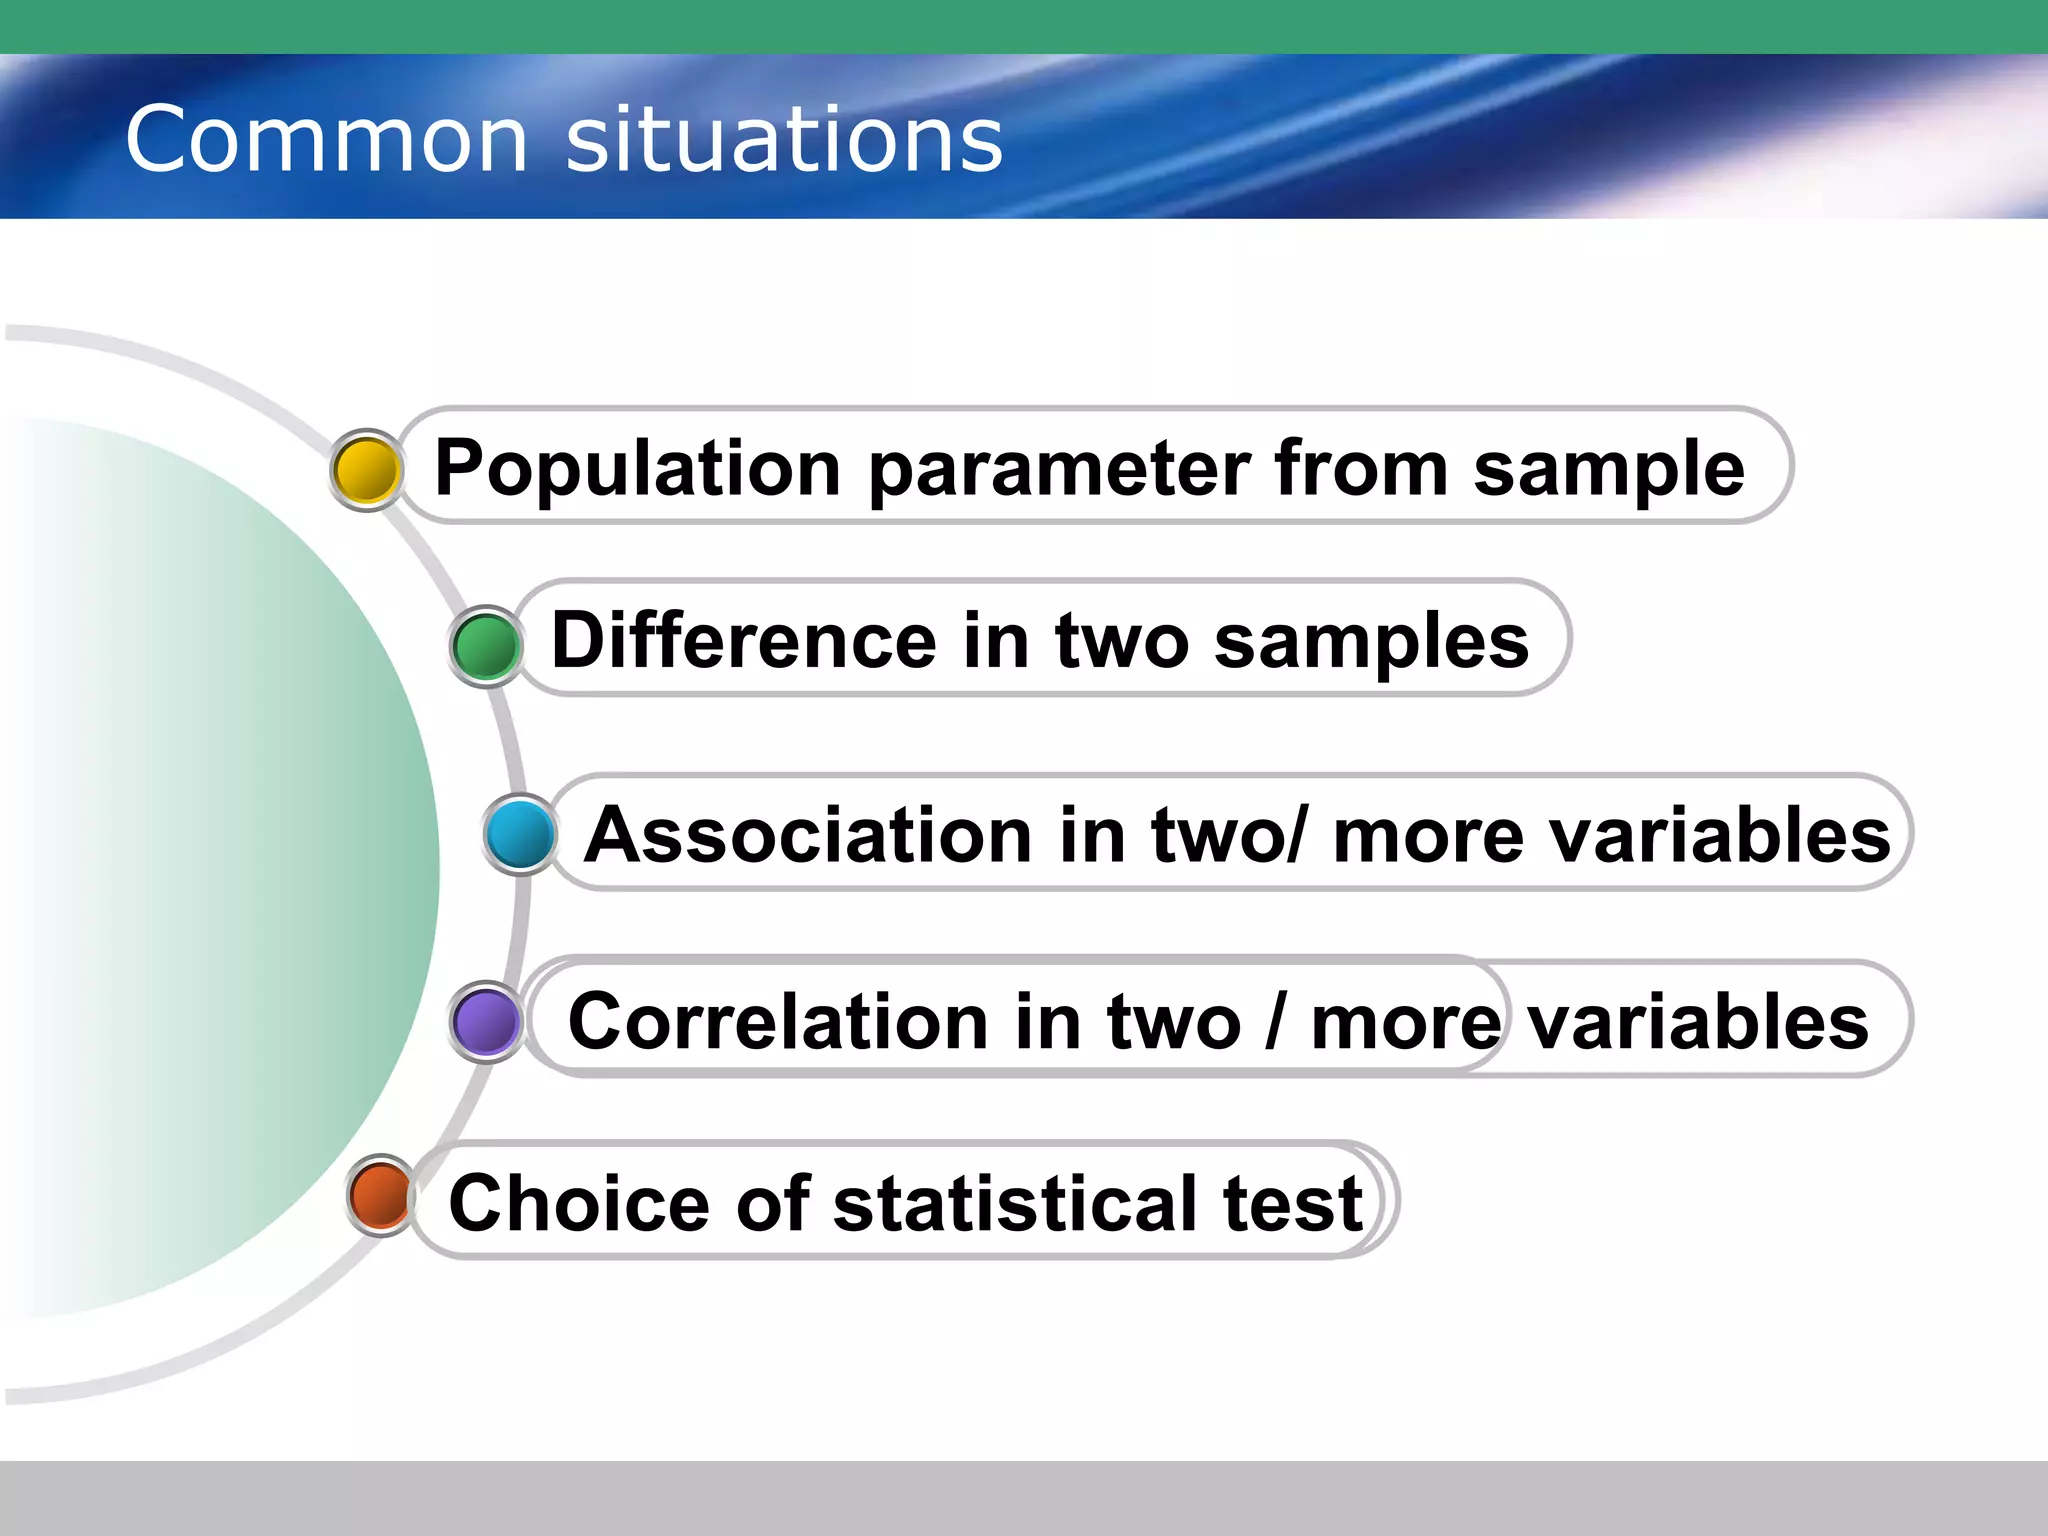
3. What is inferential statistics?
Process of drawing conclusions from
descriptive statistics
Scientific process & not half-hazard
Use of concepts like
Confidence limits
Null hypothesis
Probability
4. Common situations
Association in two/ more variables
Difference in two samples
Population parameter from sample
Correlation in two / more variables
Choice of statistical test
5. Estimate about population from sample
Population constant = Parameter
Estimate from sample = Sample statistics
(Point estimate)
Variable could be:
QUANTITATIVE
QUALITATIVE
Test statistics calculated is Standard Error
Presumption: Sample is representing
population
7. Example-1
Example: Mean Hb% of medical
students (allopathic) of
Maharashtra is unknown. In a
representative sample of 500
medicos it was found to be 11.2
gm% with SD of 2.0 gm%
What is your estimate of Hb% of
medicos?
SE m = SD / ⱱ(n) = 3.5 / ⱱ(500) = 0.1565
M est = m ± 2SEm
= 11.2 ± (2* 0.1565)
= 10.88, 11.51
8. Example-2
Example: Prevalence of diabetes
in gazetted employees in
Mubmbai in 400 randomly
selected officers was 5%. What
is your estimate about
prevalence of diabetes in these
officers?
p i.e. proportion of affected is 5 % = 0.05
1-p i.e. proportion of unaffected = (1-0.05) = 0.95
SEp = √ { (p x (1-p)/ n) = √ [(0.05 x 0.95)/400] = 0.011
P est = 0.05 +/- 2(0.011) = 0.0228; 0.072
9. Hypothesis test about difference
If there is difference in two or more samples then
two questions
1. Has the difference occurred due to sampling
variation ? (NULL Hypothesis accepted)
2. Is the difference because samples belong to
populations with different parameters? (Research
hypothesis accepted)
The variable being examined could be:
QUALITATIVE
QUANTITATIVE
3. Here we use various tests of significance
10. Tests of Significance
Basic steps in any test of significance are
Identify the variables & choose appropriate test of
significance
Calculate the test statistics like Z, t, Chi-Sq &
other required things like degrees of freedom)
Find probability
Interpret: A) Accept NH & Reject RH
B) Reject NH, Accept RH
Decision level of Probability = 0.05
If P => 0.05: Accept NH
P < 0.05: Reject NH
11. Common Tests of Significance
Type of
variable
Sample
size
Groups
compared
Test of choice Test
statistic
Qualitative
Large
2 Z-test
(Difference in 2
proportions)
Z
> 2 Chi-square Chi-square,
DF
Small 2 or more Chi-square Chi-square,
DF
Small 2 Fischer Exact
test
P
Quantitative
Large 2 Z-Test
(Difference in 2
means)
Z
Small 2 t-test t, df
>2 ANOVA F, DF
12. Example-1
Example: In clinical trial of two drugs (A,B -
new) in a disease 100 patients were
treated with drug A, 80 were cured. In
200 comparable patients treated with
drug-B, 190 were cured.
Cure rate with drug A = 80%
Cure rate with drug B = 95%
What is NH?
What is AH?
What is type of variable?
Which test? Why?
13. Example-2
Example: In 100 pregnant mothers mean
Hb% was 9.0 gm% with SD 2 gm%. In
comparable 200 non-pregnant women
Hb% was 11 gm % with SD 2.5 gms%
What is NH?
What is AH?
What is type of variable?
Which test? Why?
14. Example-3
Example: In 15 AIDS patients mean CD4
count was 200 with SD 10. In 20
comparable patients with no AIDS it was
700 with SD 15
What is NH?
What is AH?
What is type of variable?
Which test? Why?
15. Example-4
Example: In a trial two anti-anemic
drugs, these were compared with
standard treatment of Ferrous sulphate.
The patients were randomized in 3 groups
of 50 each. Mean Hb% with SD after 3
months are compared.
What is NH?
What is AH?
What is type of variable?
Which test? Why?
16. Example-5
Example: Following data shows weight gain
in mice after giving two drugs
What is NH?
What is AH?
What is type of variable?
Which test? Why?
Drug Weight
gain YES
Weight
gain NO
Total
A 4 2 6
B 1 5 6
Total 5 7 12
17. Errors in test of significance
Alpha (Type-1)
Probability of
rejecting a true NH
Possibility of bringing
a useless drug in
market
It is the P level of test
Usually kept at 0.05
(5%)
Confidence Level
= 1-alpha
Beta (Type-2)
Probability of
accepting a false NH
Possibility of
prohibiting a good
drug from entering
market
Usually kept at 0.20
(20%)
Power of test
= 1-beta
18. Association between two variables
This situation is seen in ANALYTICAL
studies
The test statistics is Odds Ratio or
Relative Risk
This being estimate from sample,
requires 95% CI
Software can find 95% CI
19. Interpretation of OR/ RR
Theoretical Range: 0.0 to infinity
NH : OR / RR = 1.0, observed value due to
sampling variation
Lower 95% CI, Point Estimate Higher 95% CI
0.0 1.0 Infinity NH Rej
NH Acc
NH Acc
NH Rej
20. Interpretation of Correlation
Relationship between two QUANTITATIVE
variables (say like Ht & Wt)
Test statistics: (r) Correlation coefficient
Theoretical range: -1.0 to +1.0
If (-) ve: Negative correlation
If (+) ve: Positive correlation
If above 0.6, strong correlation
21. Interpretation of Correlation
NH: r =0.0, observed value due to
sampling variation
Calculate 95 % CI
-1.0 0.0 +1.0
NH Rejected
NH Accepted
NH Accepted
NH Rejected