
DESCRIPTIVE STATISTICS
Dr. Resu Neha Reddy
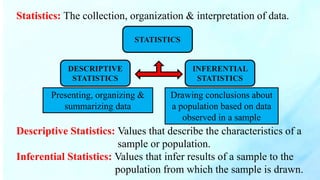
Statistics: The collection, organization & interpretation of data.
Descriptive Statistics: Values that describe the characteristics of a
sample or population.
Inferential Statistics: Values that infer results of a sample to the
population from which the sample is drawn.
STATISTICS
DESCRIPTIVE
STATISTICS
INFERENTIAL
STATISTICS
Presenting, organizing &
summarizing data
Drawing conclusions about
a population based on data
observed in a sample
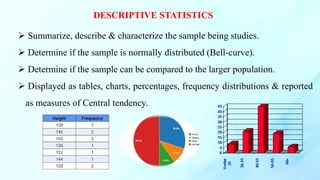
DESCRIPTIVE STATISTICS
 Summarize, describe & characterize the sample being studies.
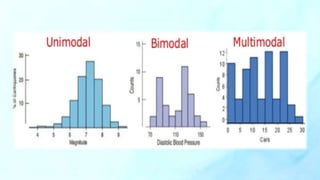
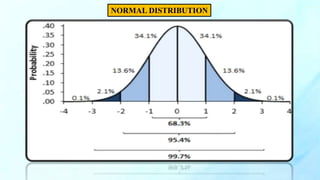
 Determine if the sample is normally distributed (Bell-curve).
 Determine if the sample can be compared to the larger population.
 Displayed as tables, charts, percentages, frequency distributions & reported
as measures of Central tendency.
DESCRIPTIVE STATISTICS
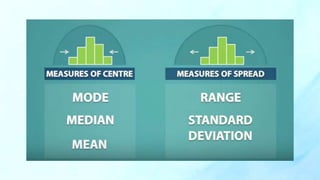
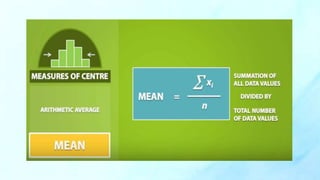
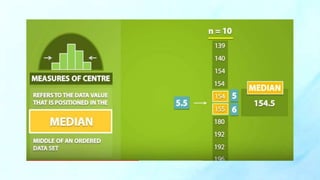
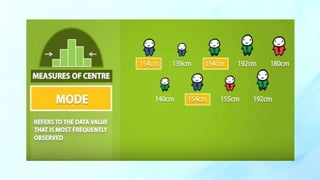
 CENTRAL TENDENCY
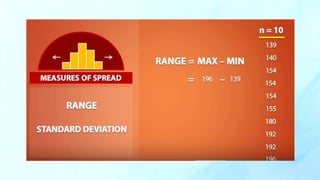
 MEASURES OF VARIABILITY
 SKEWNESS
 KURTOSIS
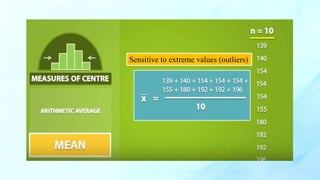
Sensitive to extreme values (outliers)
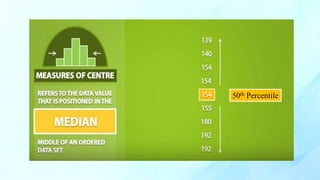
50th Percentile
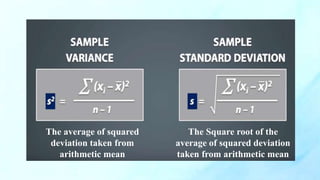
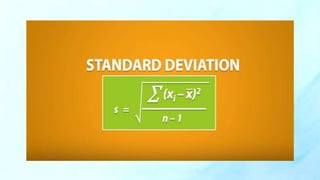
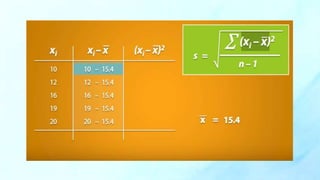
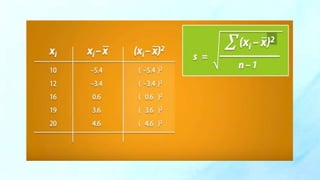
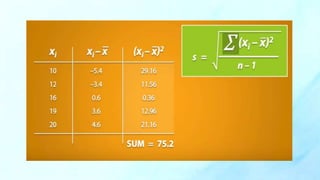
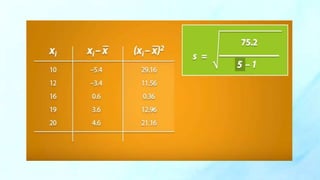
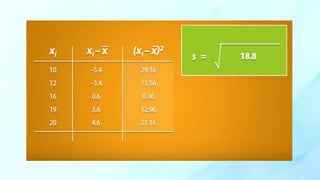
The Square root of the
average of squared deviation
taken from arithmetic mean
The average of squared
deviation taken from
arithmetic mean
NORMAL DISTRIBUTION
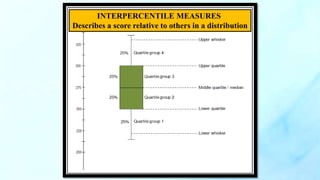
INTERPERCENTILE MEASURES
Describes a score relative to others in a distribution
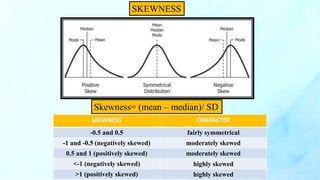
Skewness= (mean – median)/ SD
SKEWNESS
SKEWNESS CHARACTER
-0.5 and 0.5 fairly symmetrical
-1 and -0.5 (negatively skewed) moderately skewed
0.5 and 1 (positively skewed) moderately skewed
<-1 (negatively skewed) highly skewed
>1 (positively skewed) highly skewed
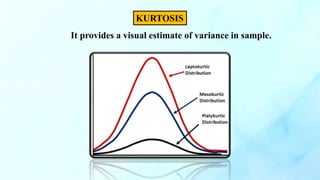
KURTOSIS
It provides a visual estimate of variance in sample.
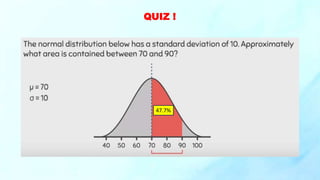
QUIZ !
47.7%
THANK YOU…