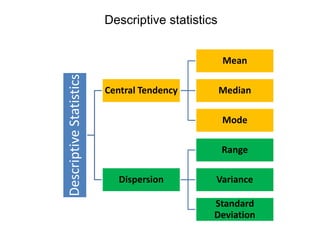
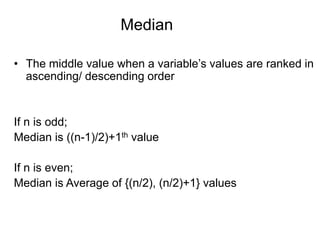
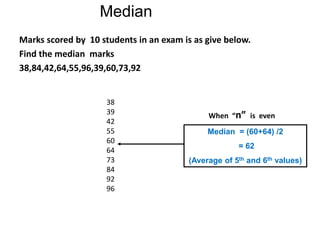
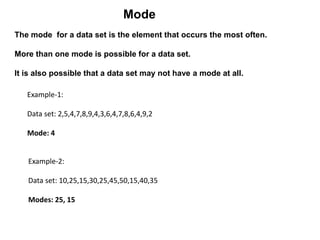
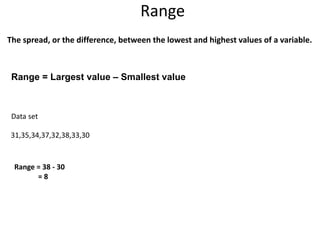
DESCRIPTIVE STATISTICS
K MURUGESAN
DescriptiveStatistics
Central Tendency
Mean
Median
Mode
Dispersion
Range
Variance
Standard
Deviation
Descriptive statistics
Central Tendency
• Mean is the average or arithmetic mean of the data.
• Median is the middle value of the data set, when the
data set is arranged in the ascending or descending order.
• Mode is the most frequently observed value(s).
• Range is the difference between highest and lowest observations in the data set
• Variance is a measure of spread of a data set
It is calculated as the average squared deviation of each number from mean of a data set.
• Standard Deviation is the Square Root of the Variance.
Dispersion
Mean
Variance
Standard
Deviation
X
n
x
n
i
i


1
The marks obtained by 10 students in a subject are as
given below
9,31,35,34,37,32,100,33,30,100
Average Marks:
=(9+31+35+34+37+32+100+33+30+100)/10
=44
Effect of outliers on Mean
The marks obtained by 8 students in a subject are as
given below
31,35,34,37,32,38,33,30
Average Marks:
=(31+35+34+37+32+38+33+30)/8
=33.75
Mean
The marks obtained by 10 students in a subject are as
given below
9,31,35,34,37,32,100,33,30,100
Average Marks:
=(9+31+35+34+37+32+100+33+30+100)/10
=44.1
Effect of outliers on Mean
• The middle value when a variable’s values are ranked in
ascending/ descending order
If n is odd;
Median is ((n-1)/2)+1th value
If n is even;
Median is Average of {(n/2), (n/2)+1} values
Median
Median = 60
(six cases above, six below)
Marks scored by 13 students in an exam is as give below.
Find the median marks
35,90,40,62,54,95,38,60,73,92,51,32,74
Median
32
35
38
40
51
54
60
62
73
74
90
92
95
When “n” is odd
Median = (60+64) /2
= 62
(Average of 5th and 6th values)
Marks scored by 10 students in an exam is as give below.
Find the median marks
38,84,42,64,55,96,39,60,73,92
Median
38
39
42
55
60
64
73
84
92
96
When “n” is even
The marks obtained by 10 students in a subject are as
given below
9,31,35,34,37,32,100,33,30,100
Median: 9,30,31,32,33,34,35,37,100,100
Effect of outliers on Median
= (33+34)/2
=33.5
Median is not influenced by outliers
The mode for a data set is the element that occurs the most often.
More than one mode is possible for a data set.
It is also possible that a data set may not have a mode at all.
Example-1:
Data set: 2,5,4,7,8,9,4,3,6,4,7,8,6,4,9,2
Mode: 4
Example-2:
Data set: 10,25,15,30,25,45,50,15,40,35
Modes: 25, 15
Mode
Range
Range = Largest value – Smallest value
The spread, or the difference, between the lowest and highest values of a variable.
31,35,34,37,32,38,33,30
Data set
Range = 38 - 30
= 8
Variance
A measure of the spread of the recorded values on a variable.
The larger the variance, the further the individual values are from the mean.
The smaller the variance, the closer the individual values are to the mean.
Mean
Mean
The square root of the variance (Standard deviation) reveals the
average deviation of the observations from the mean.
Standard deviation
 
1
1
2




n
xx
s
n
i
i
• The larger the standard deviation, the more
spread out the data is.
Interpretation of standard deviation
THANK YOU

Descriptive statistics

  • 1.
  • 2.
  • 3.
    Central Tendency • Meanis the average or arithmetic mean of the data. • Median is the middle value of the data set, when the data set is arranged in the ascending or descending order. • Mode is the most frequently observed value(s).
  • 4.
    • Range isthe difference between highest and lowest observations in the data set • Variance is a measure of spread of a data set It is calculated as the average squared deviation of each number from mean of a data set. • Standard Deviation is the Square Root of the Variance. Dispersion
  • 5.
  • 6.
    The marks obtainedby 10 students in a subject are as given below 9,31,35,34,37,32,100,33,30,100 Average Marks: =(9+31+35+34+37+32+100+33+30+100)/10 =44 Effect of outliers on Mean
  • 7.
    The marks obtainedby 8 students in a subject are as given below 31,35,34,37,32,38,33,30 Average Marks: =(31+35+34+37+32+38+33+30)/8 =33.75 Mean
  • 8.
    The marks obtainedby 10 students in a subject are as given below 9,31,35,34,37,32,100,33,30,100 Average Marks: =(9+31+35+34+37+32+100+33+30+100)/10 =44.1 Effect of outliers on Mean
  • 9.
    • The middlevalue when a variable’s values are ranked in ascending/ descending order If n is odd; Median is ((n-1)/2)+1th value If n is even; Median is Average of {(n/2), (n/2)+1} values Median
  • 10.
    Median = 60 (sixcases above, six below) Marks scored by 13 students in an exam is as give below. Find the median marks 35,90,40,62,54,95,38,60,73,92,51,32,74 Median 32 35 38 40 51 54 60 62 73 74 90 92 95 When “n” is odd
  • 11.
    Median = (60+64)/2 = 62 (Average of 5th and 6th values) Marks scored by 10 students in an exam is as give below. Find the median marks 38,84,42,64,55,96,39,60,73,92 Median 38 39 42 55 60 64 73 84 92 96 When “n” is even
  • 12.
    The marks obtainedby 10 students in a subject are as given below 9,31,35,34,37,32,100,33,30,100 Median: 9,30,31,32,33,34,35,37,100,100 Effect of outliers on Median = (33+34)/2 =33.5 Median is not influenced by outliers
  • 13.
    The mode fora data set is the element that occurs the most often. More than one mode is possible for a data set. It is also possible that a data set may not have a mode at all. Example-1: Data set: 2,5,4,7,8,9,4,3,6,4,7,8,6,4,9,2 Mode: 4 Example-2: Data set: 10,25,15,30,25,45,50,15,40,35 Modes: 25, 15 Mode
  • 14.
    Range Range = Largestvalue – Smallest value The spread, or the difference, between the lowest and highest values of a variable. 31,35,34,37,32,38,33,30 Data set Range = 38 - 30 = 8
  • 15.
    Variance A measure ofthe spread of the recorded values on a variable. The larger the variance, the further the individual values are from the mean. The smaller the variance, the closer the individual values are to the mean. Mean Mean
  • 16.
    The square rootof the variance (Standard deviation) reveals the average deviation of the observations from the mean. Standard deviation   1 1 2     n xx s n i i
  • 17.
    • The largerthe standard deviation, the more spread out the data is. Interpretation of standard deviation
  • 18.