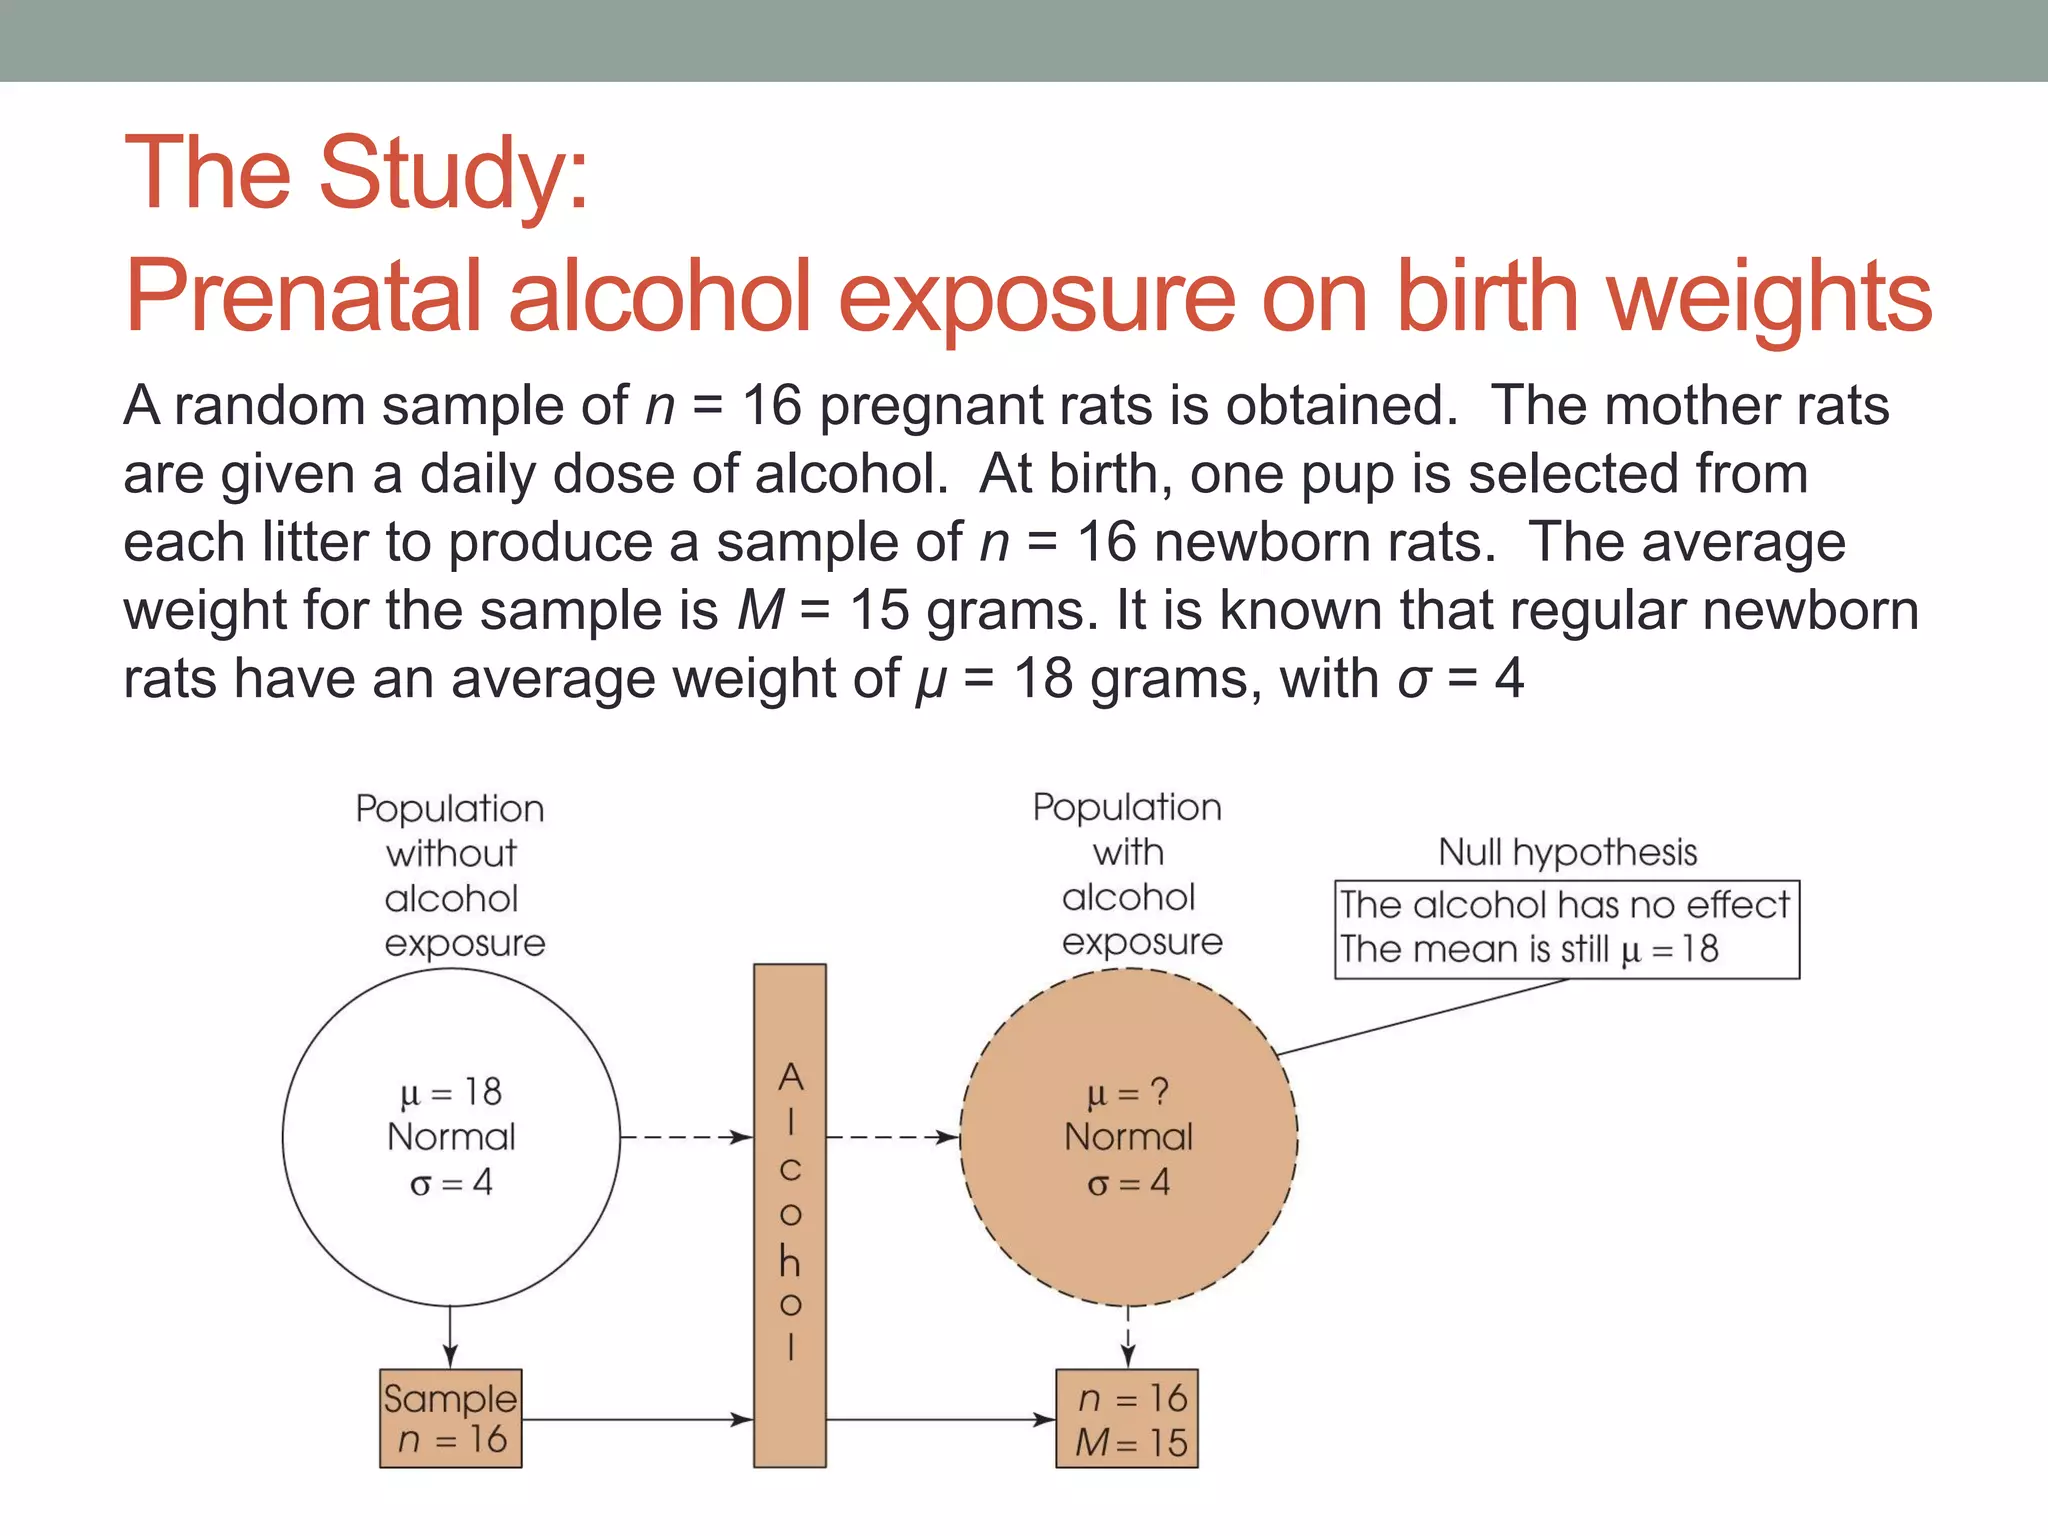
The document provides an overview of hypothesis testing. It begins by defining a hypothesis test and its purpose of ruling out chance as an explanation for research study results. It then outlines the logic and steps of a hypothesis test: 1) stating hypotheses, 2) setting decision criteria, 3) collecting data, 4) making a decision. Key concepts discussed include type I and type II errors, statistical significance, test statistics like the z-score, and assumptions of hypothesis testing. Factors that can influence a hypothesis test like effect size, sample size, and alpha level are also covered.

![Statistical Significance
A result is statistically significant if it is unlikely to occur
when the null hypothesis (H0) is true
(Sufficient to reject the null hypothesis [H0])
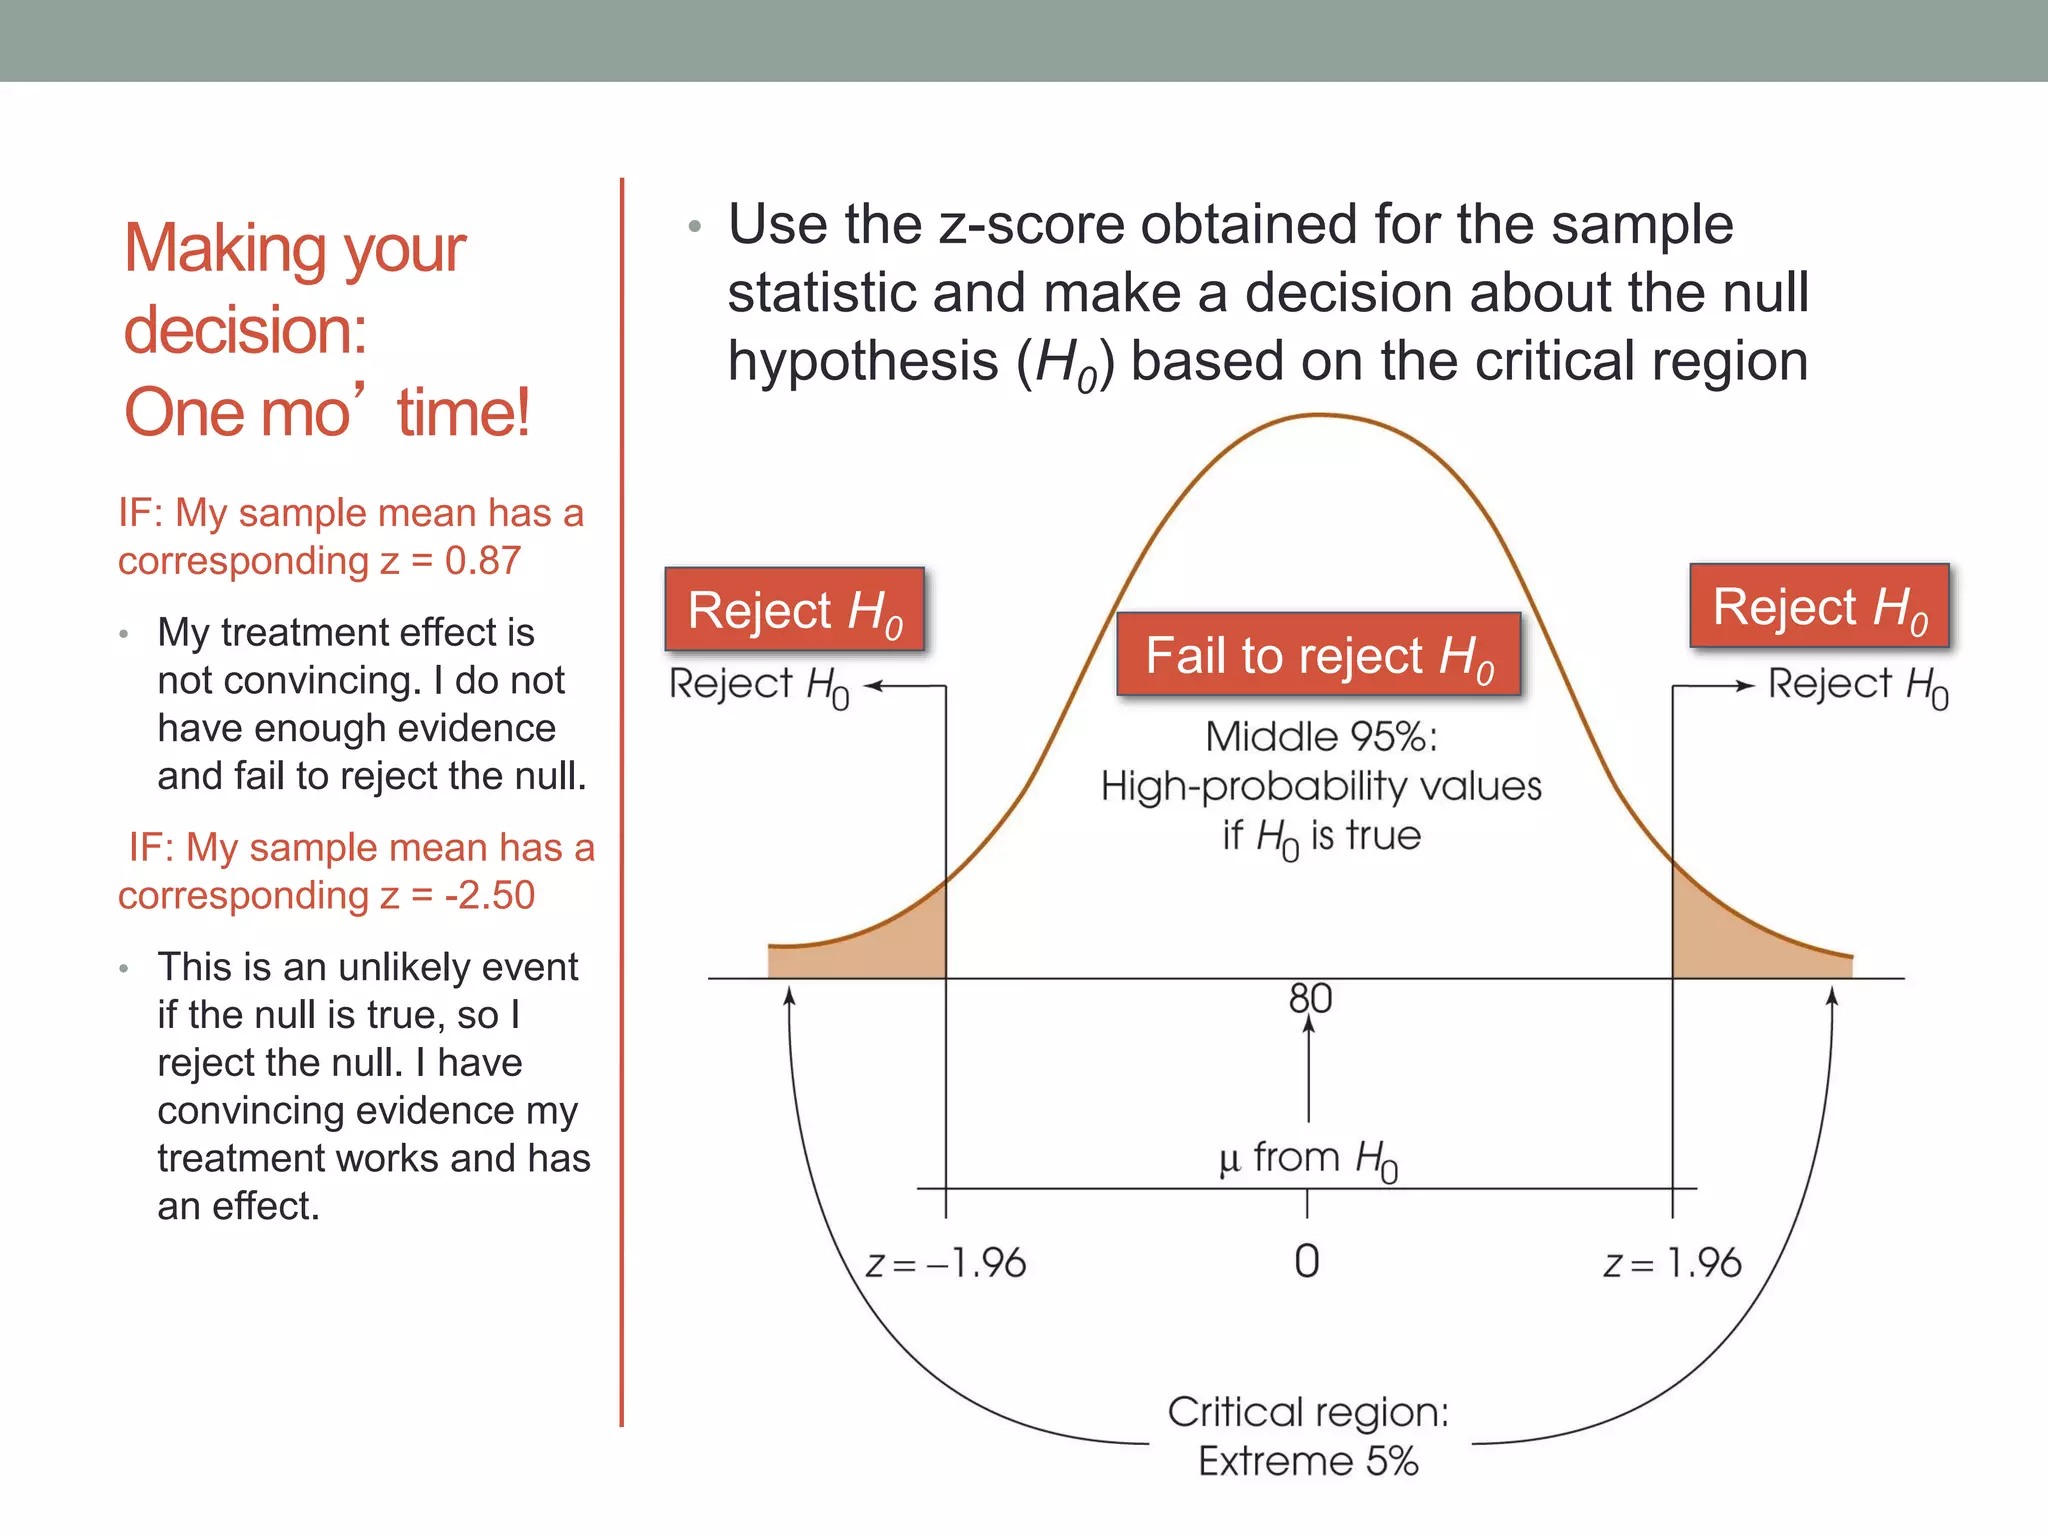
• An effect is significant if we decide to reject the null
hypothesis after conducting a hypothesis test
• Z = 0.87, p > 0.05
does not fall in the critical region, fail to reject the null
• Z = -2.50, p < 0.05
falls in the critical region, reject the null](https://image.slidesharecdn.com/chapter8hypothesistesting-170706210310/75/Hypothesis-testing-15-2048.jpg)