Download as PDF, PPTX
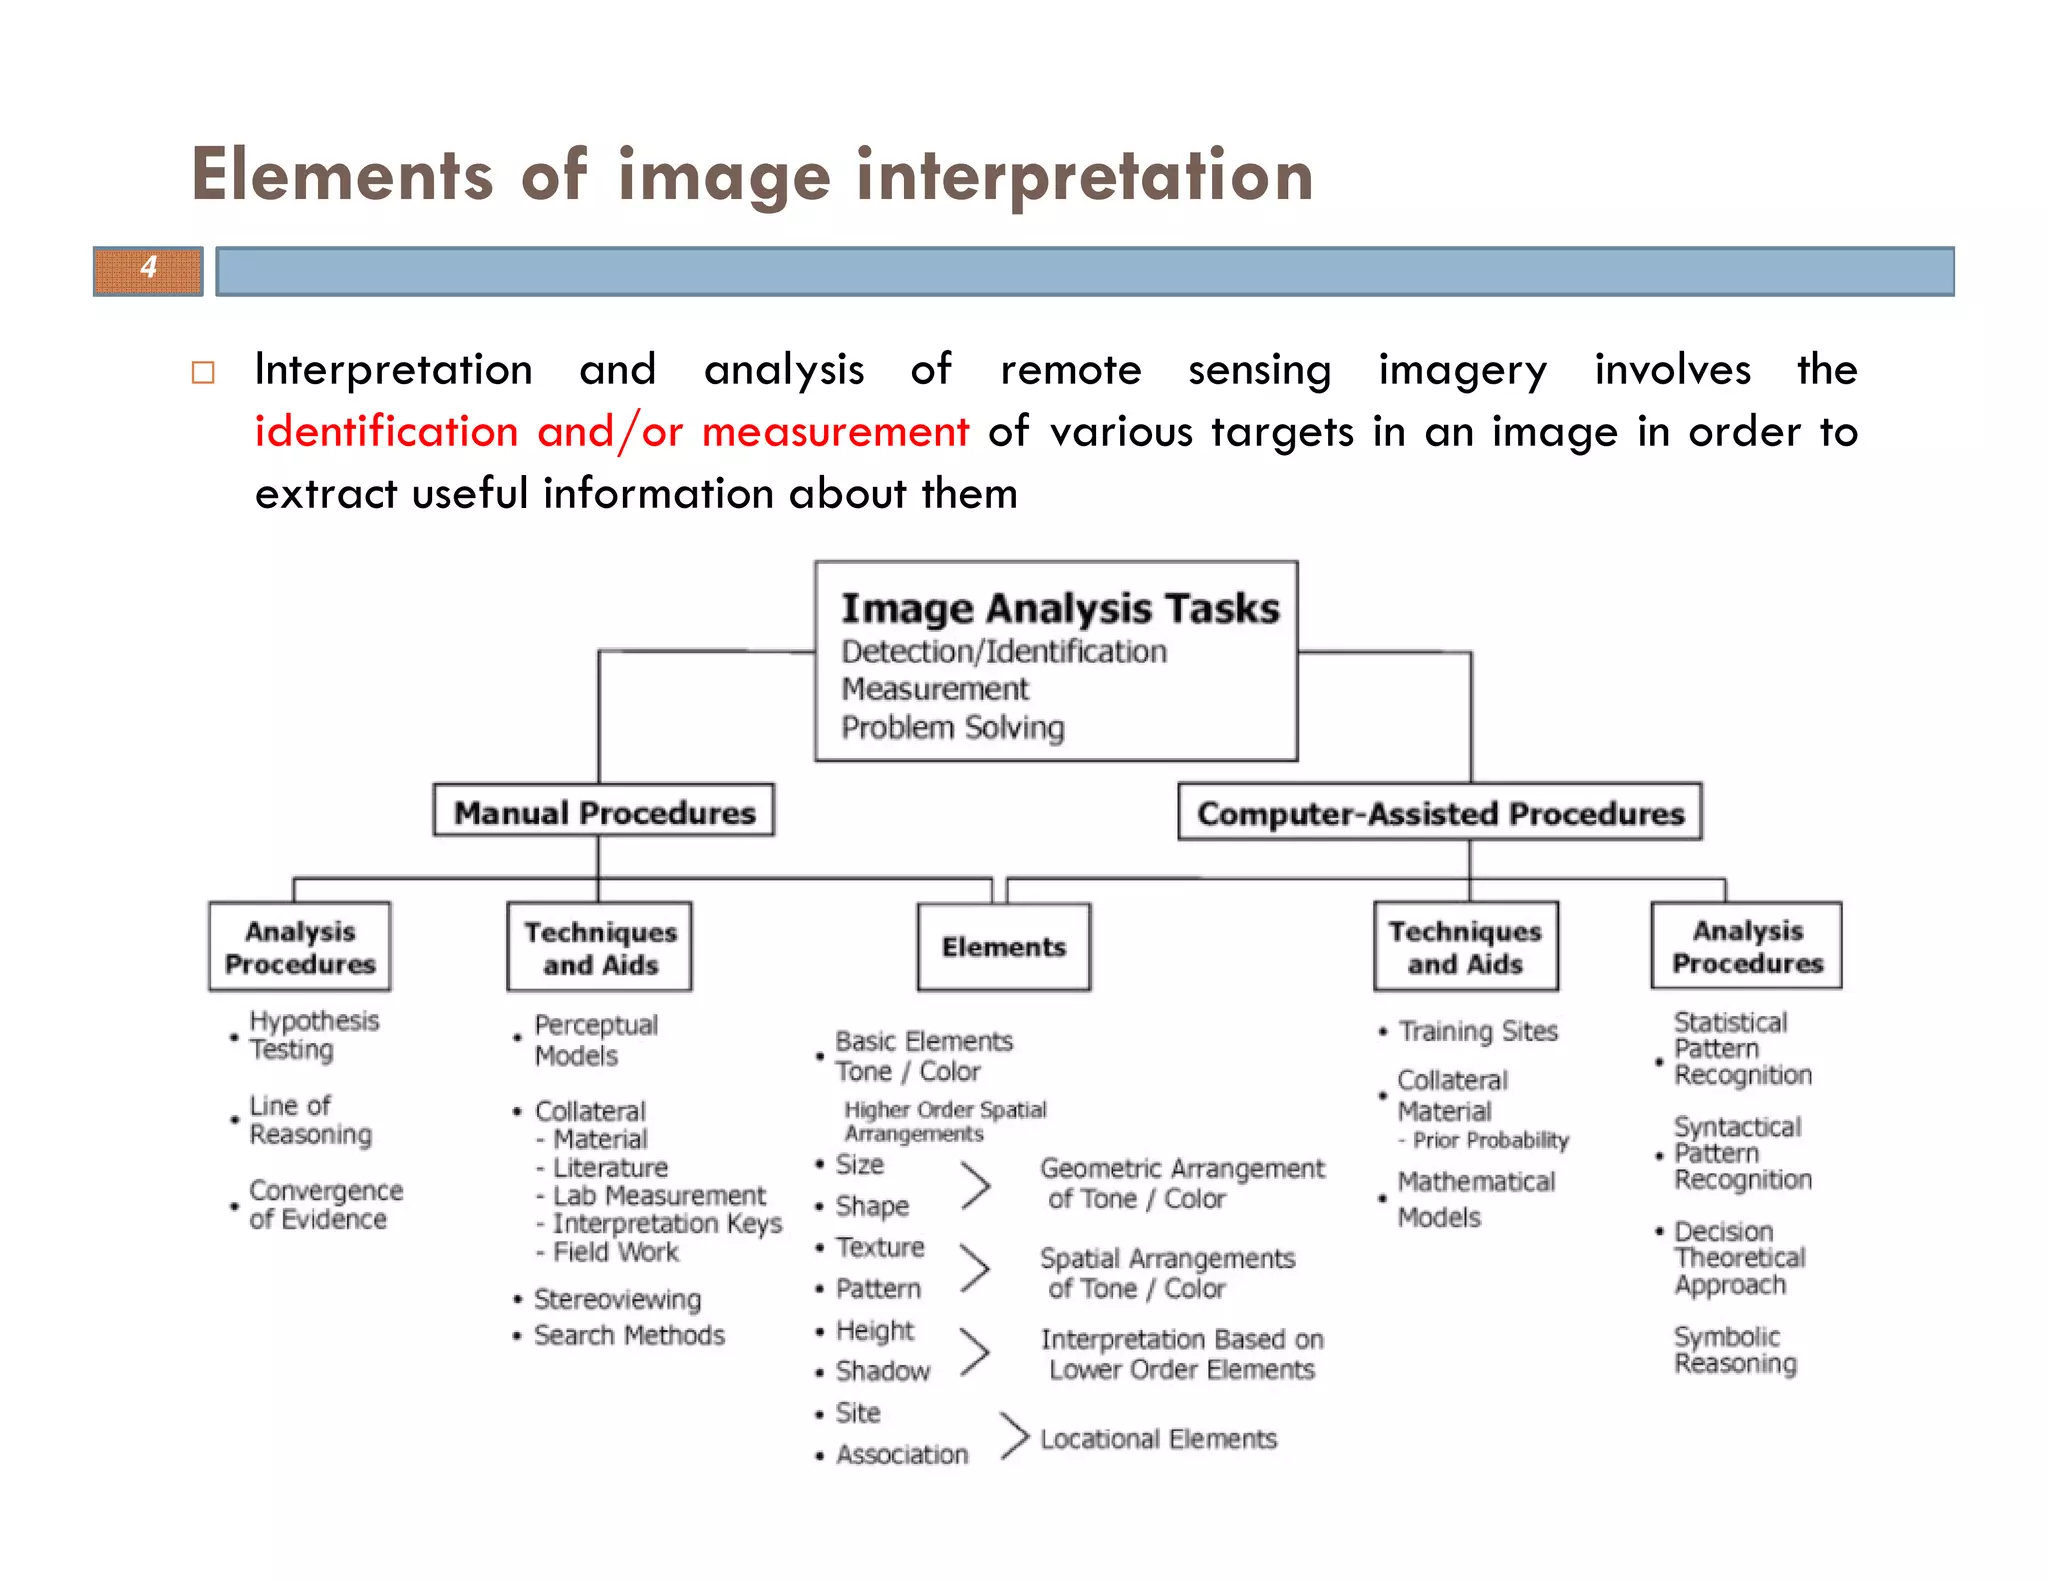
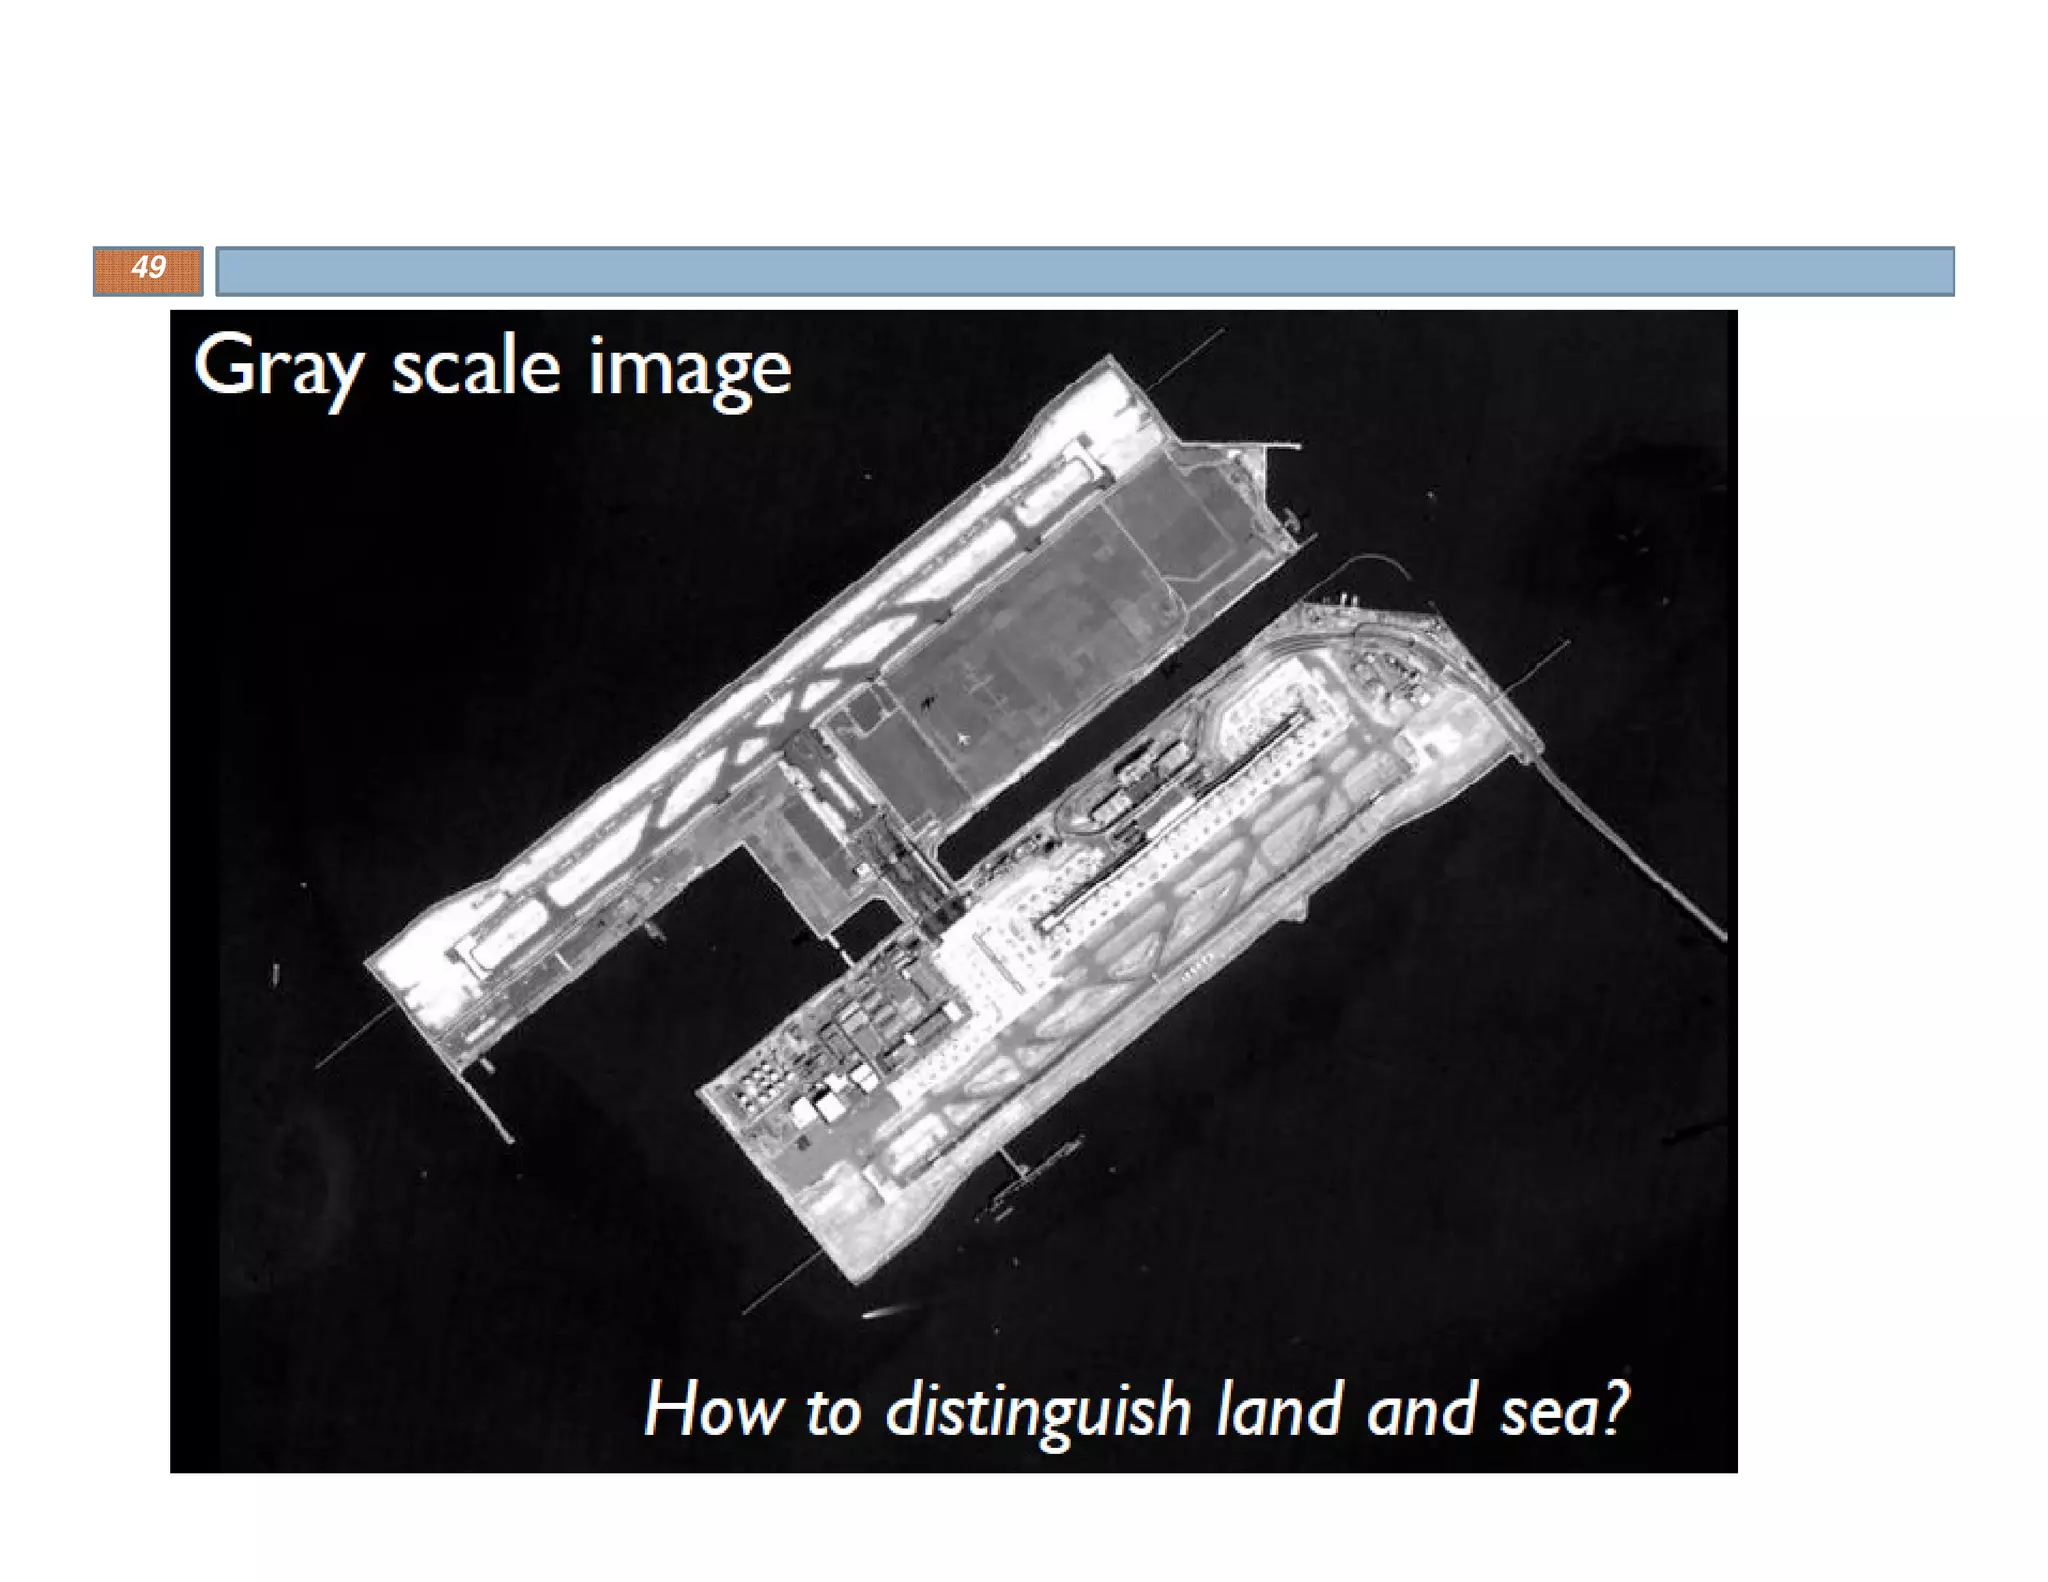
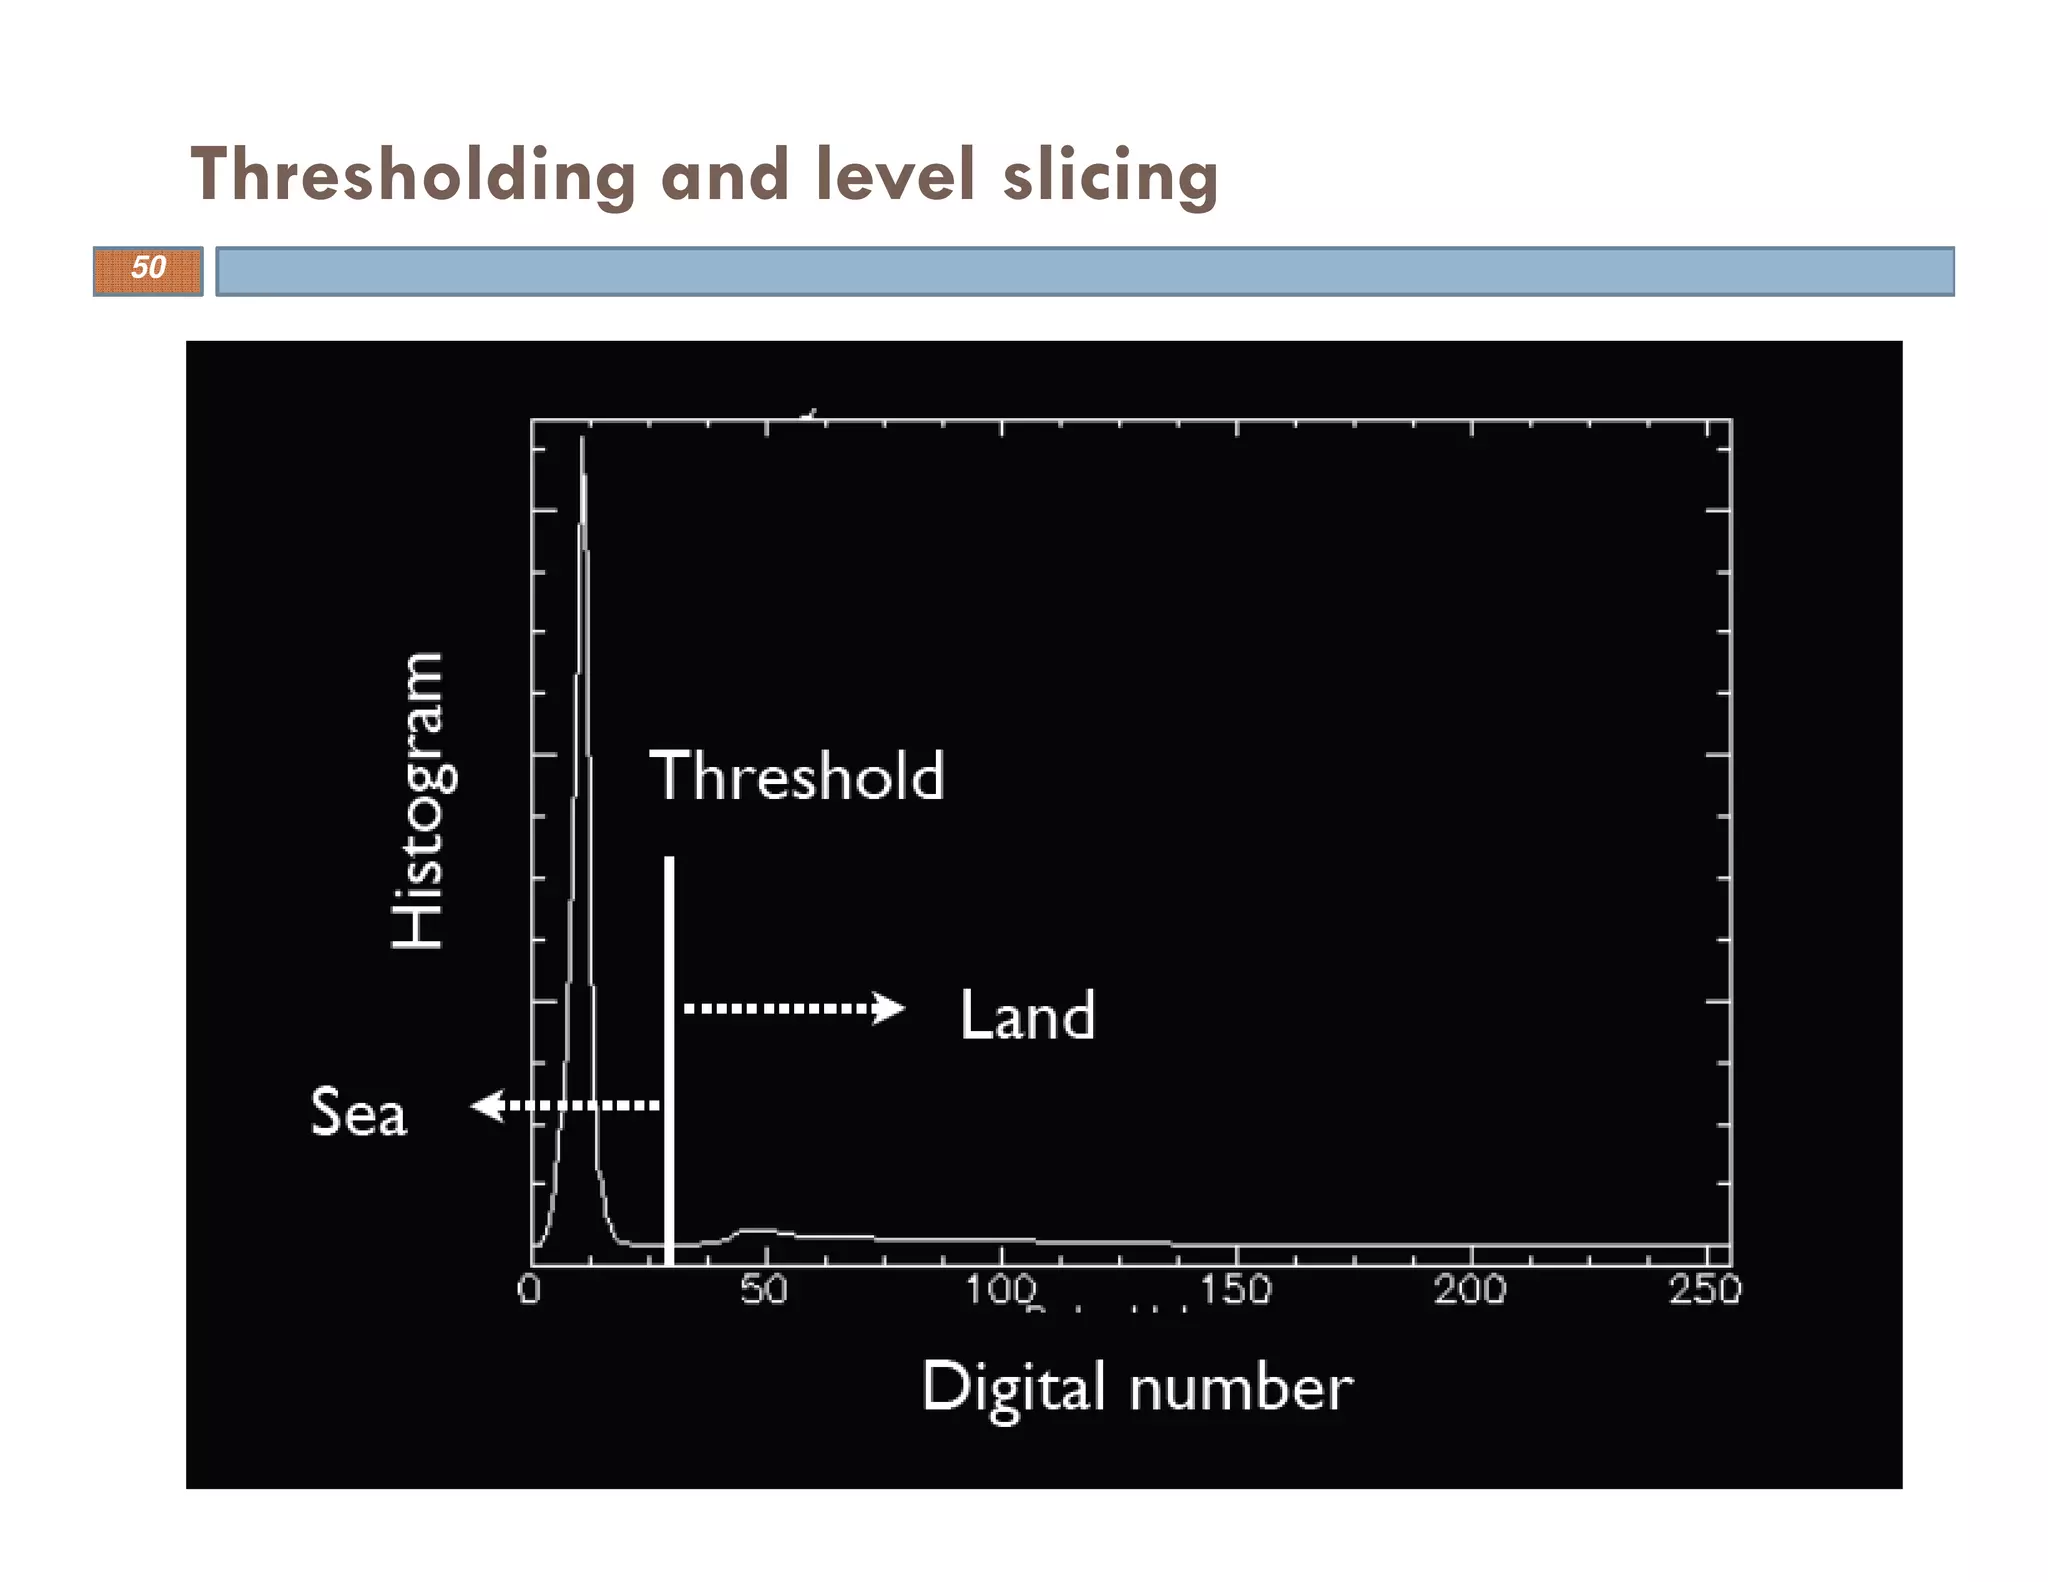
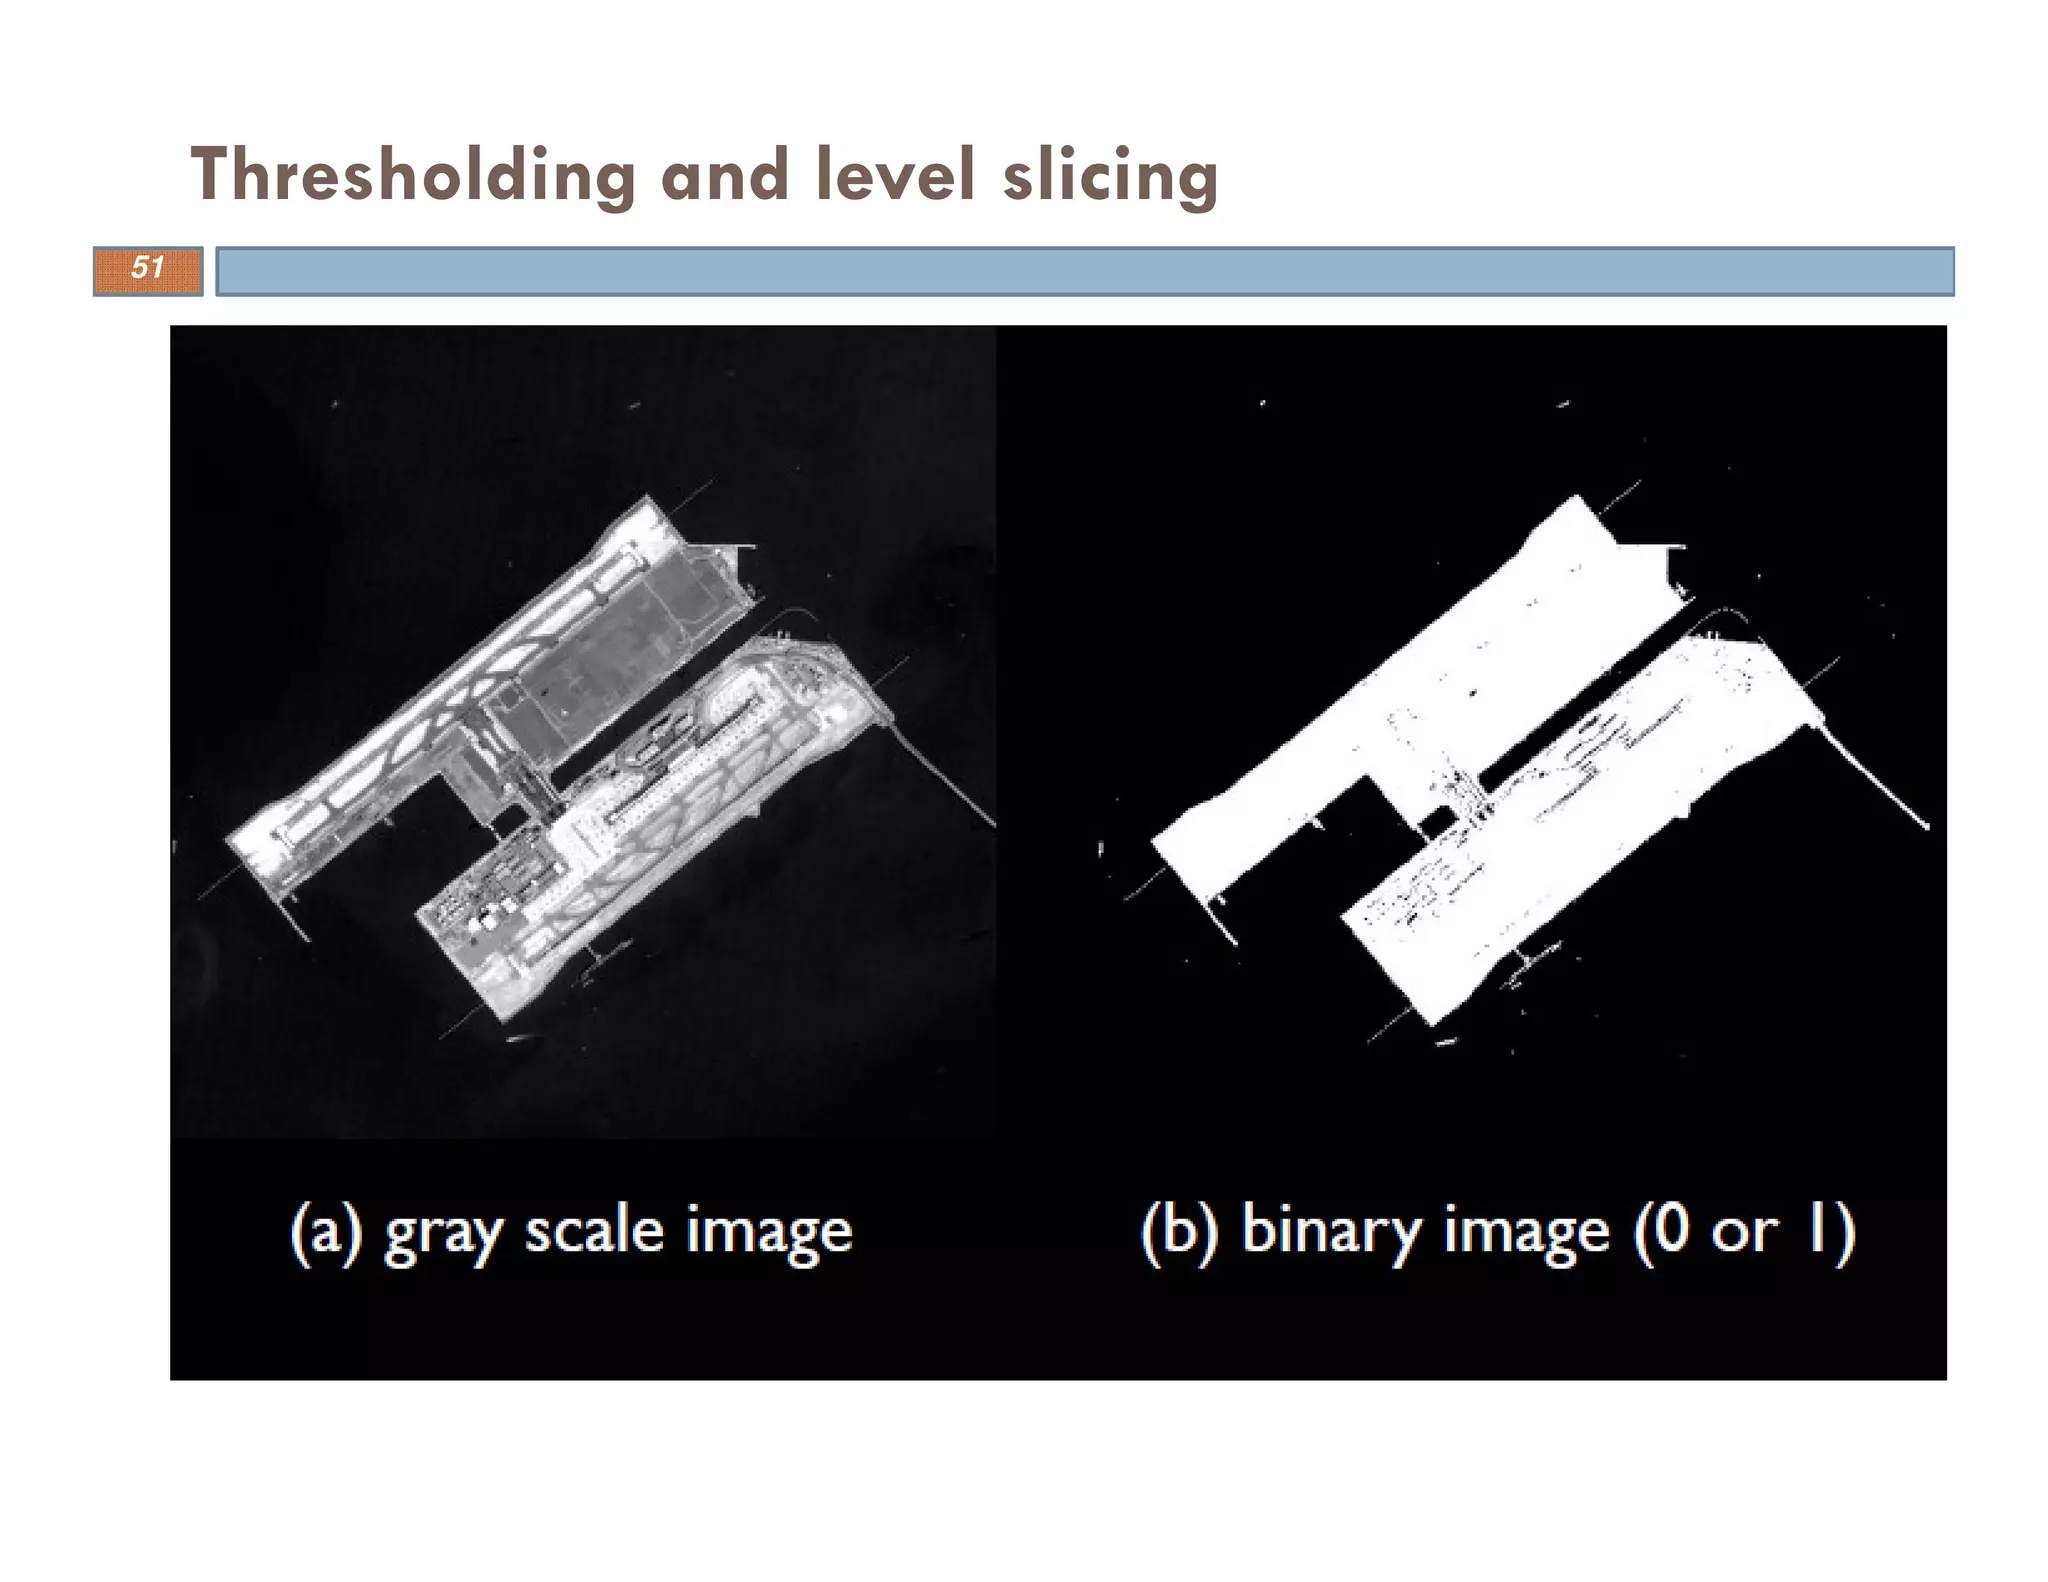
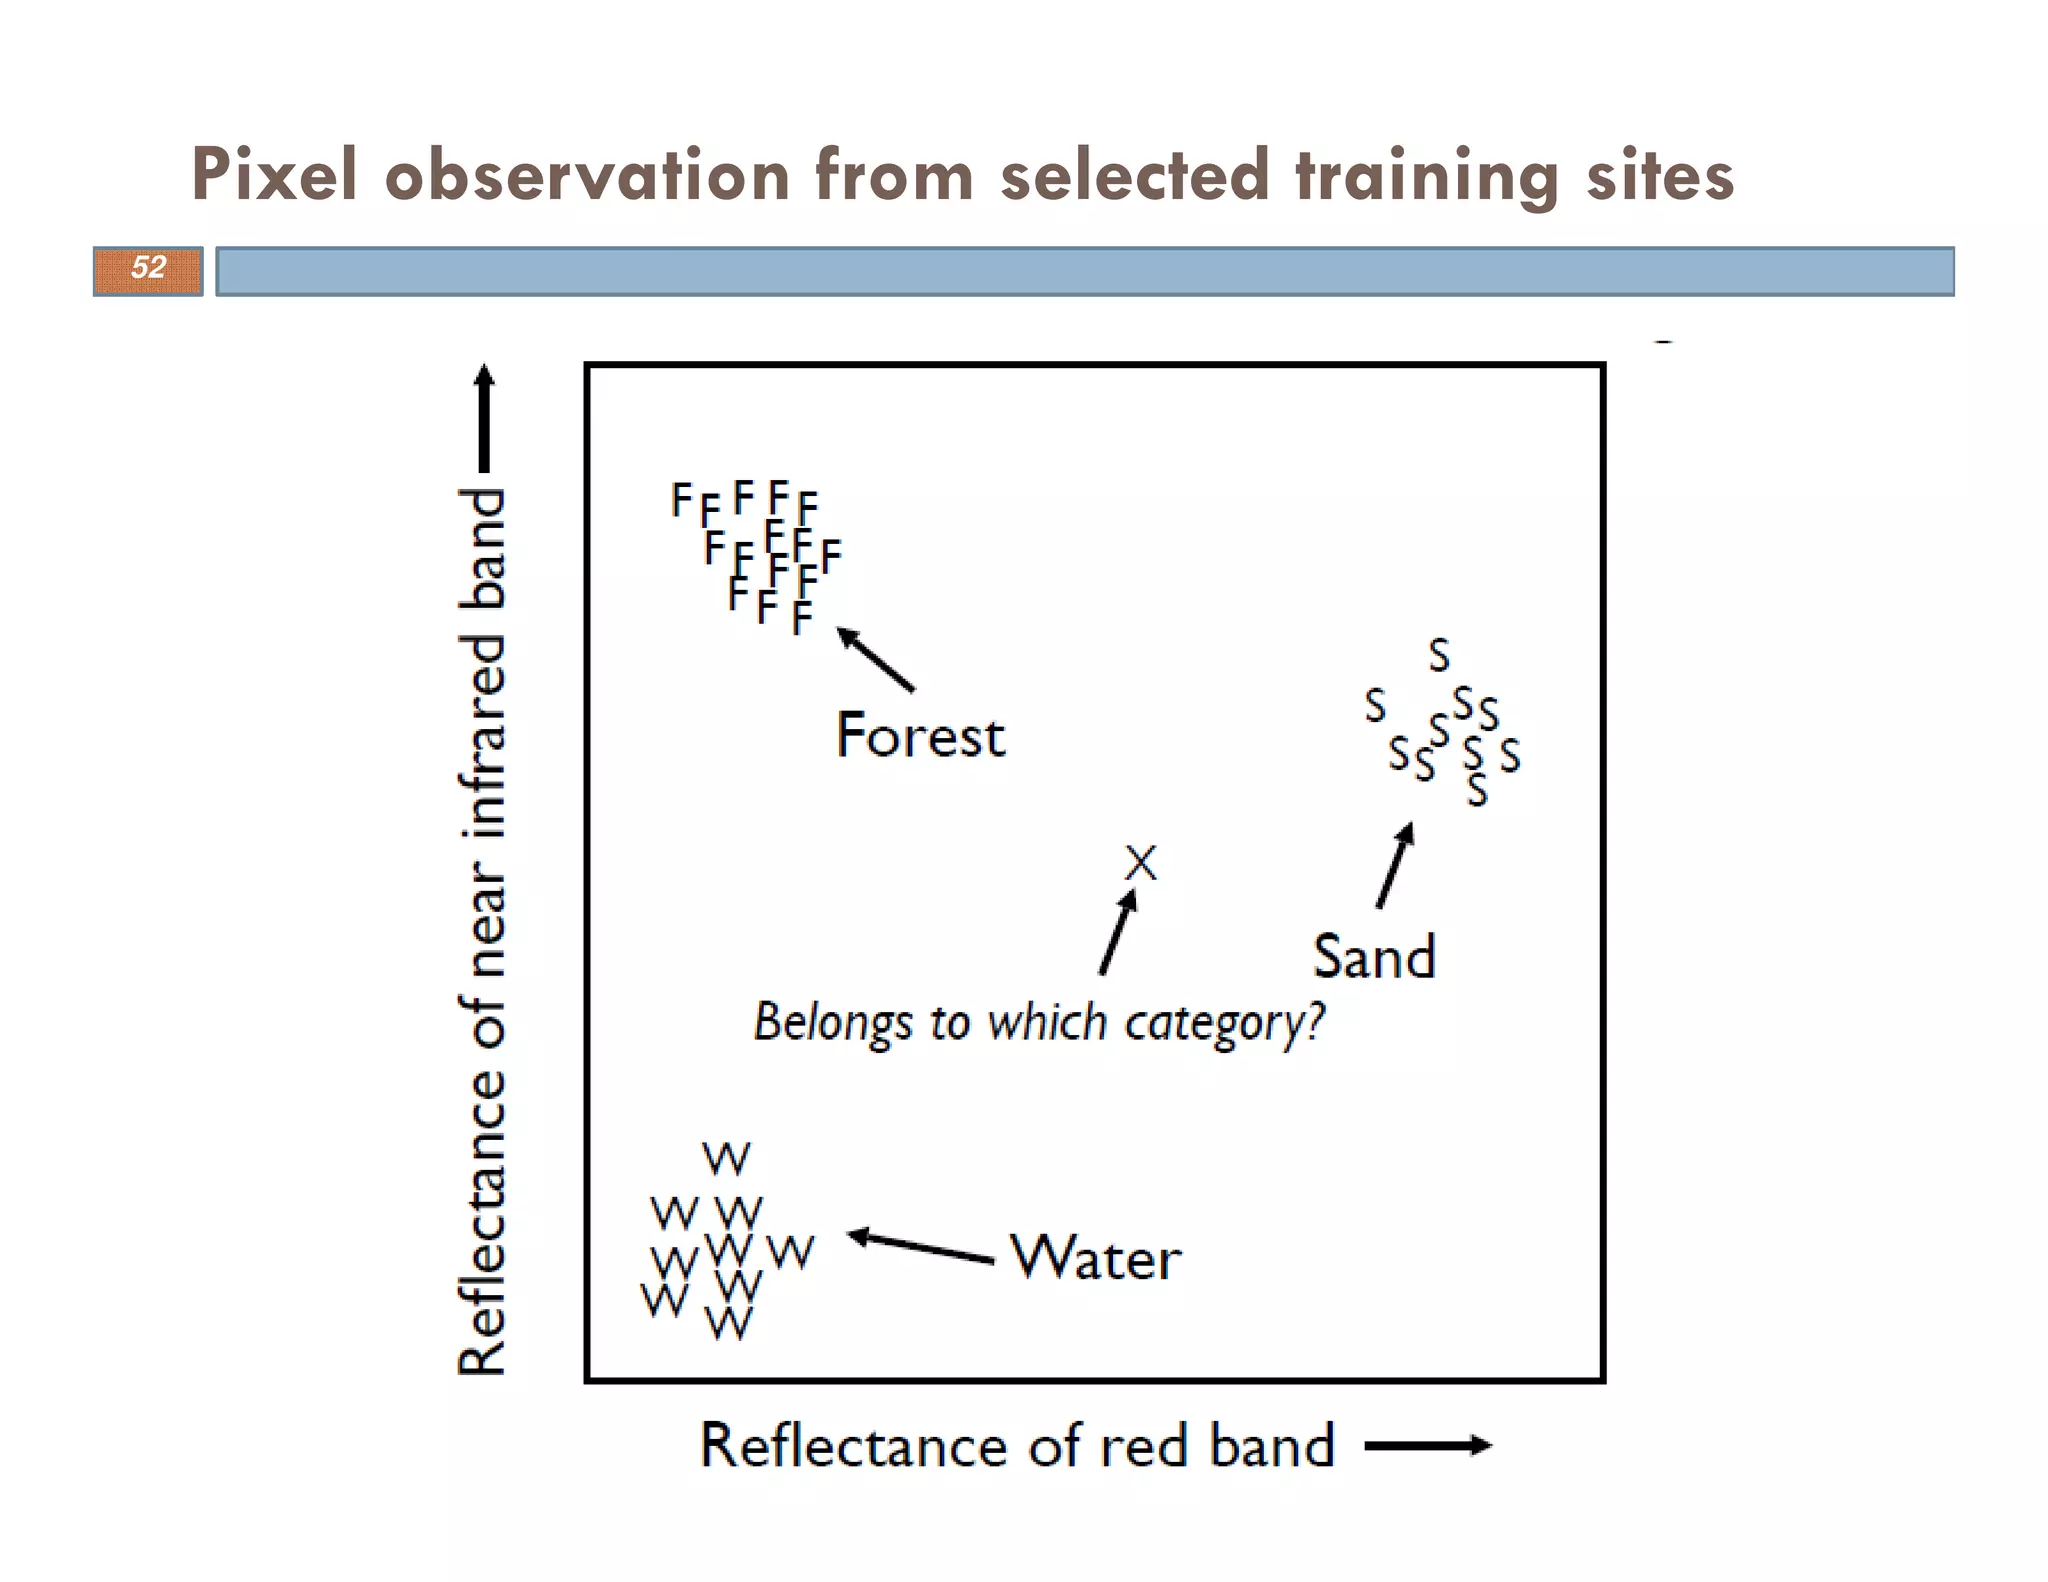

This document provides an overview of the application of remote sensing and geographical information systems in civil engineering. It discusses key concepts such as image interpretation, data preprocessing, feature extraction, image classification, and accuracy assessment. The document aims to explain how remote sensing and GIS techniques can be used to extract useful information from imagery and geospatial data for civil engineering applications.


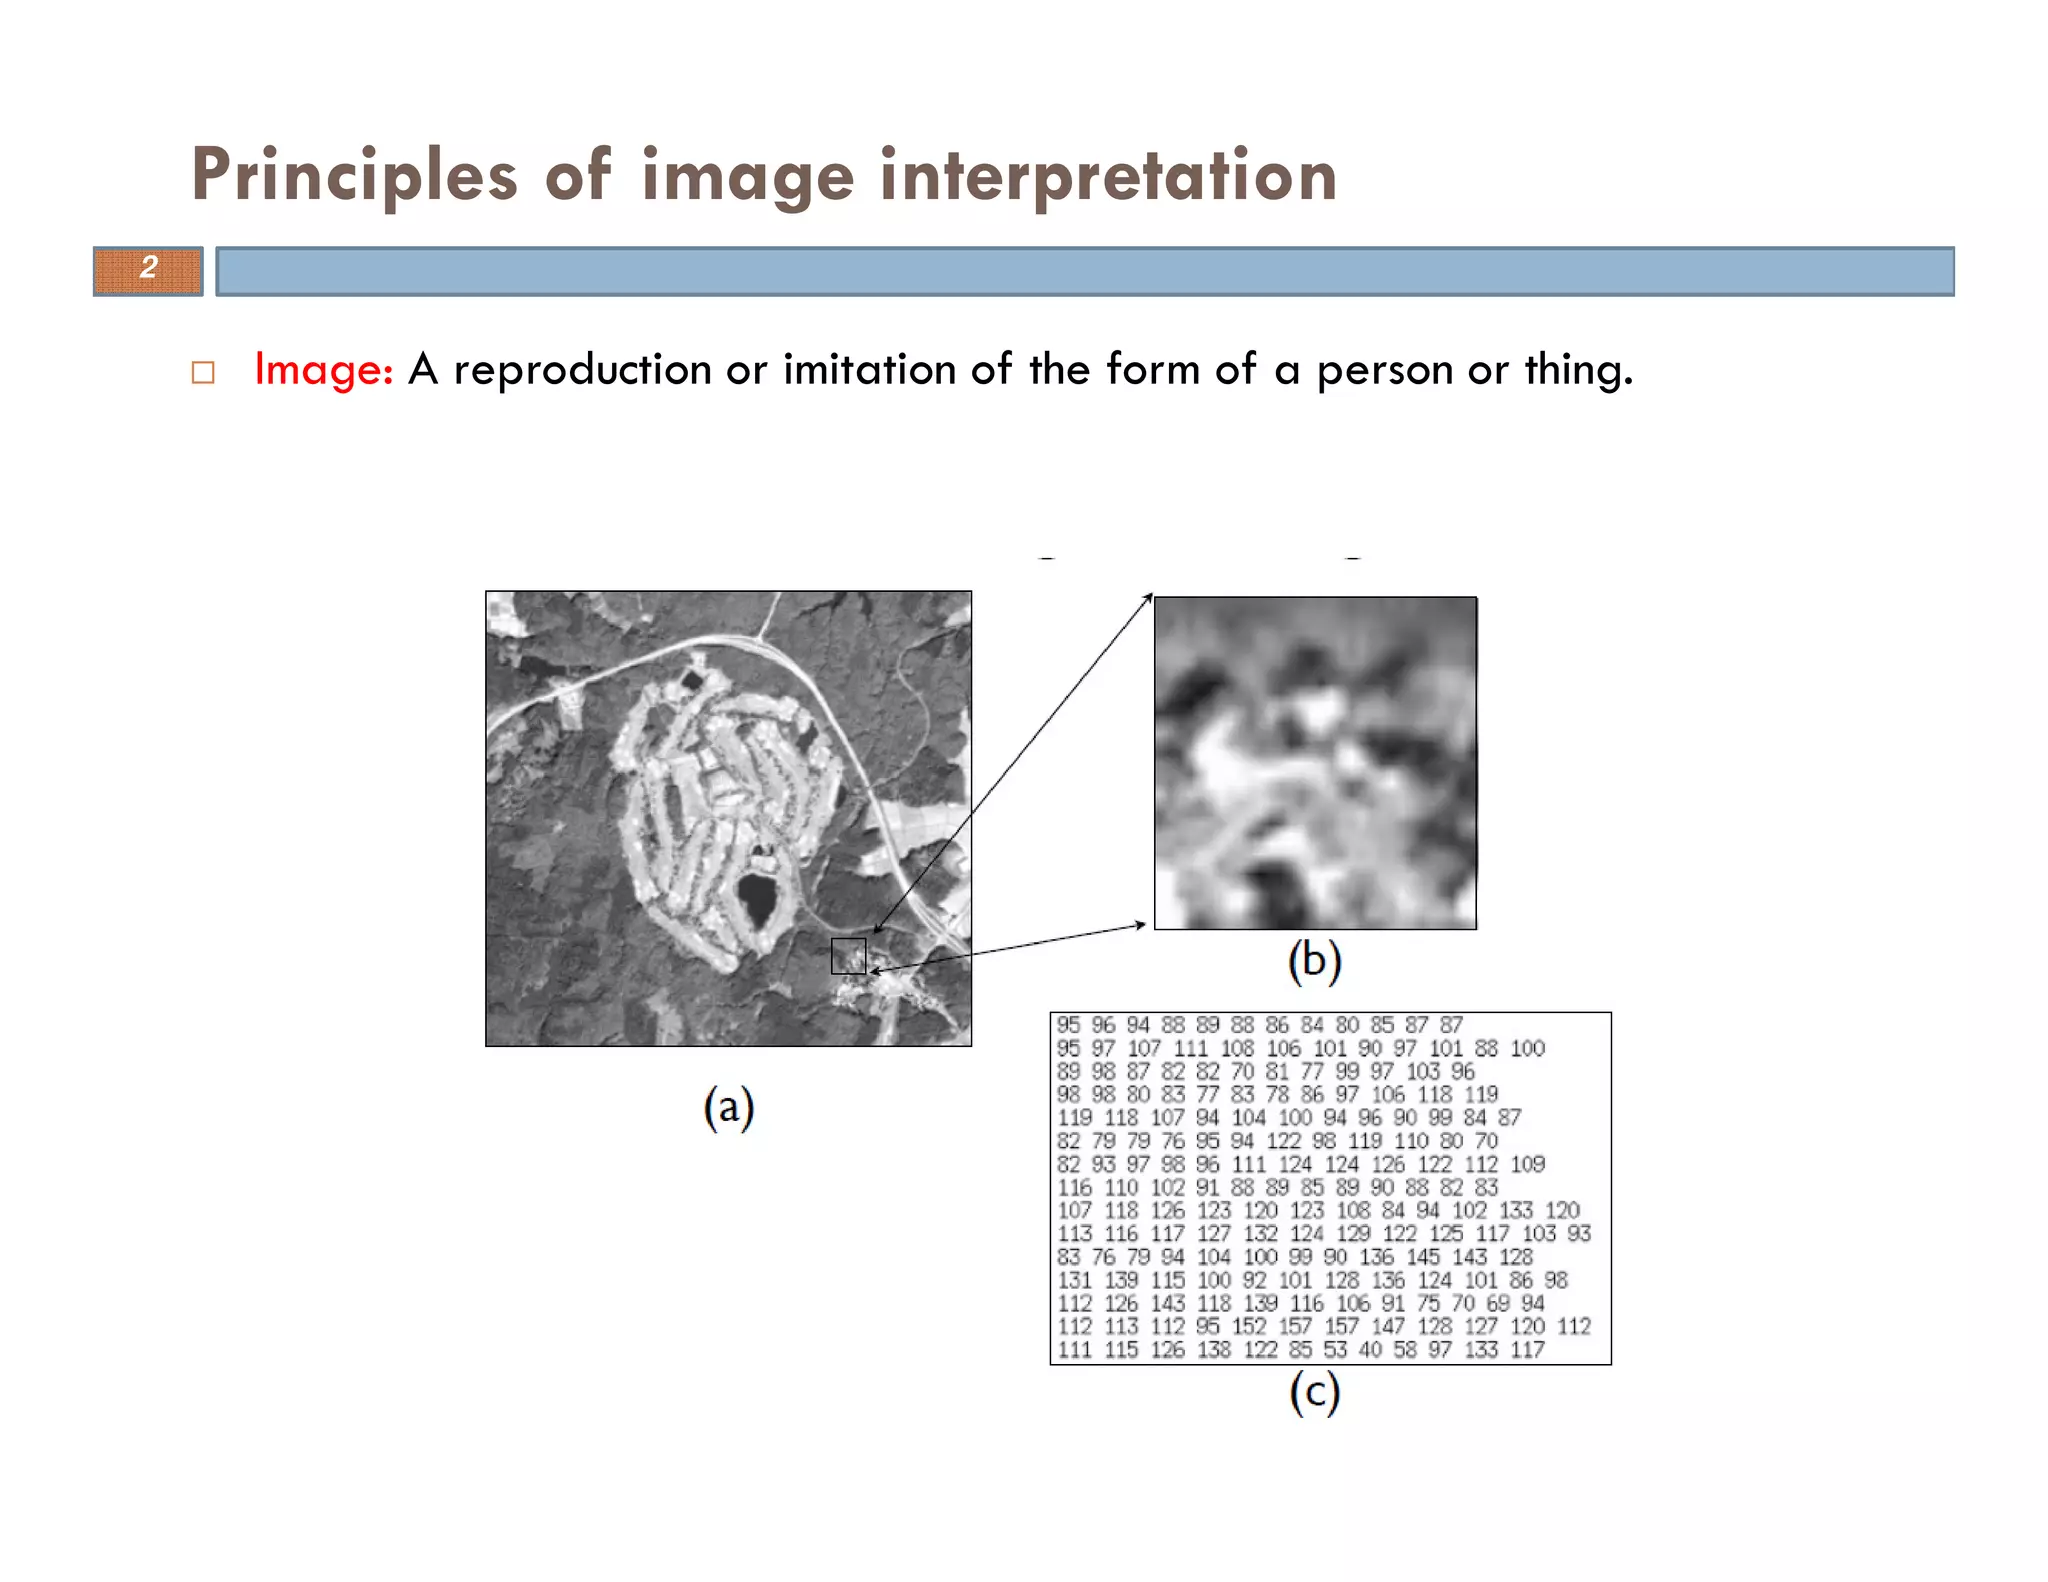
![Engineering Economics: Solved exam problems [ch1-ch4]](https://cdn.slidesharecdn.com/ss_thumbnails/solvedexamproblemsch1-ch4-200220070043-thumbnail.jpg?width=640&height=640&fit=bounds)


