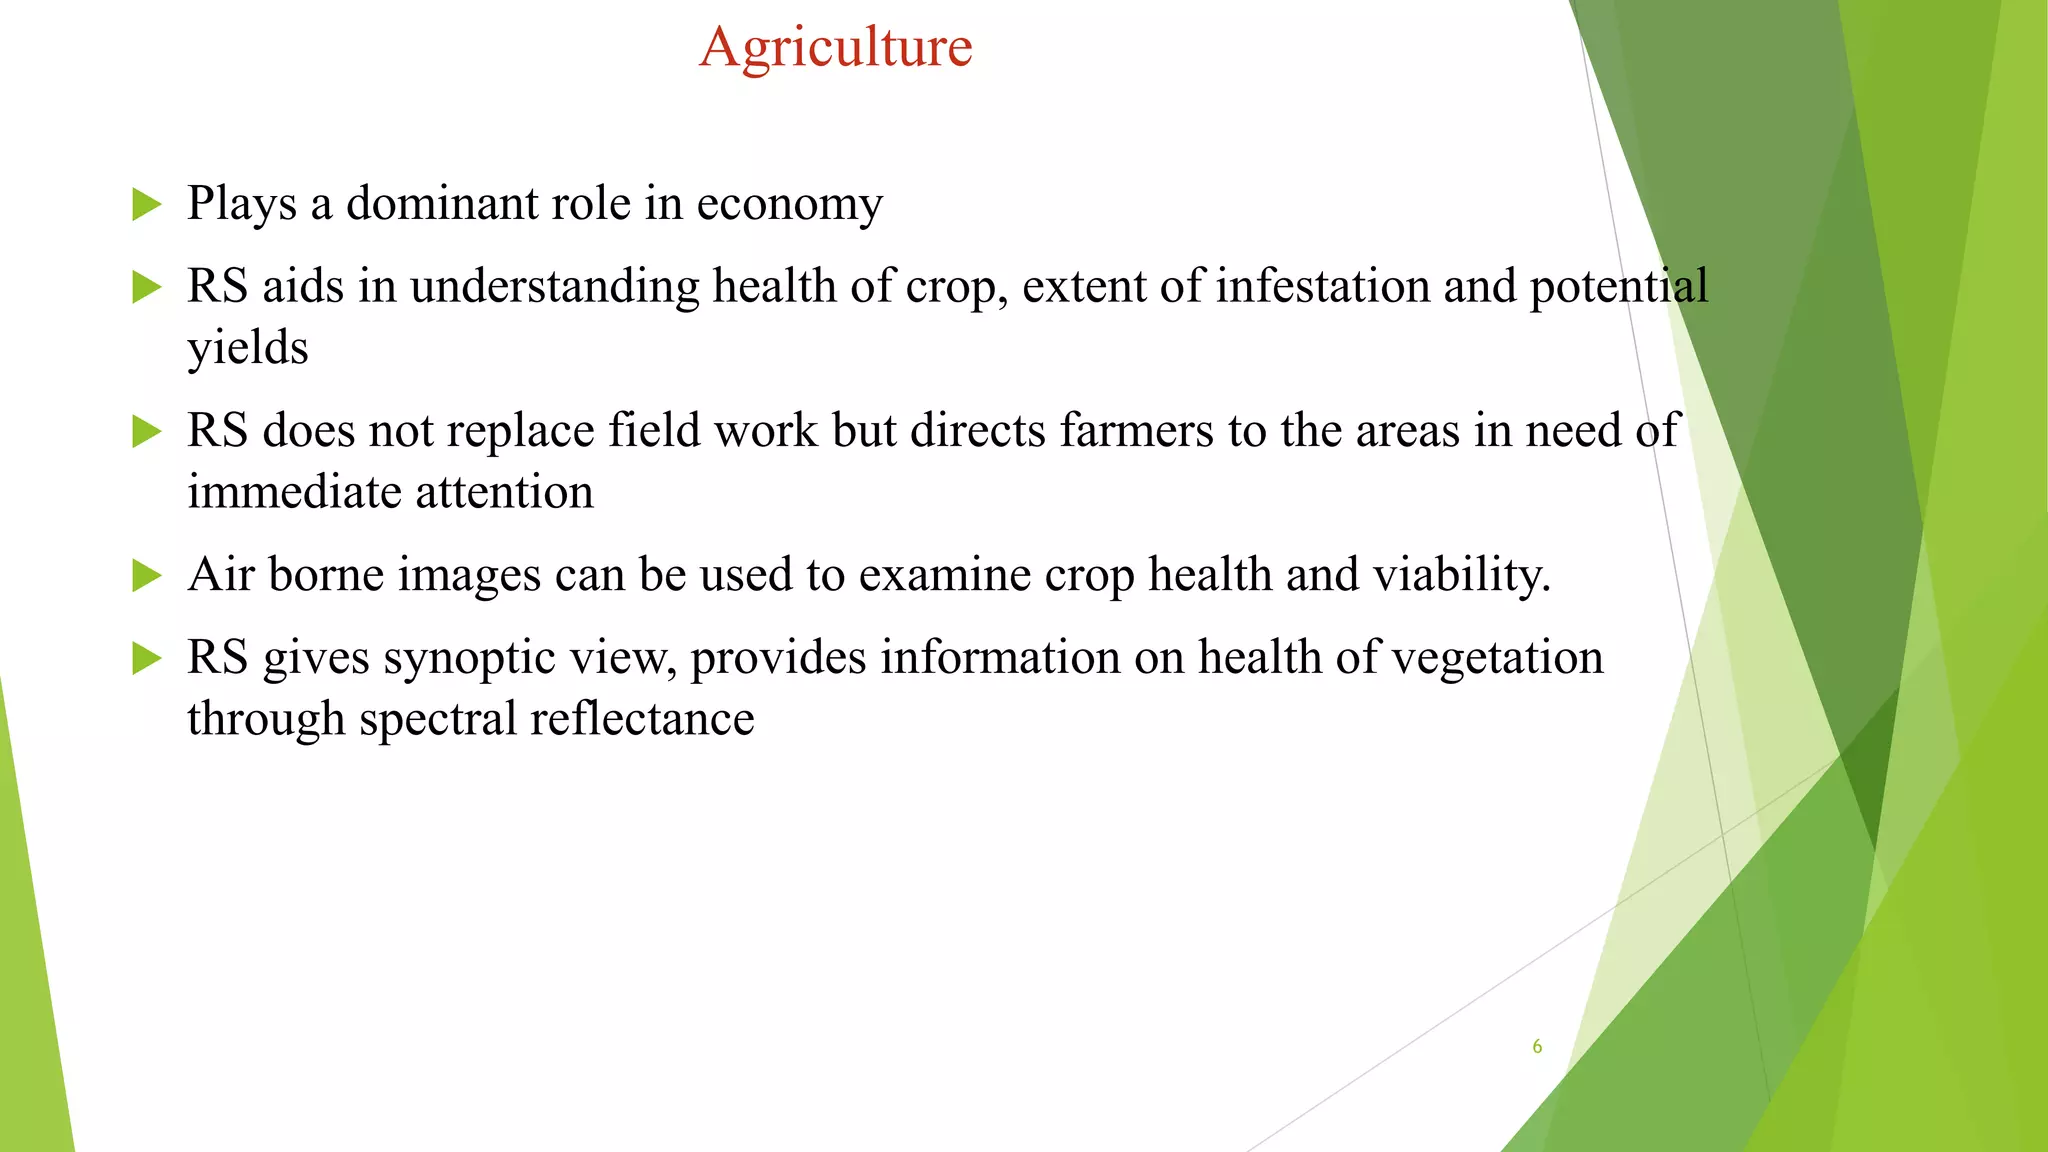
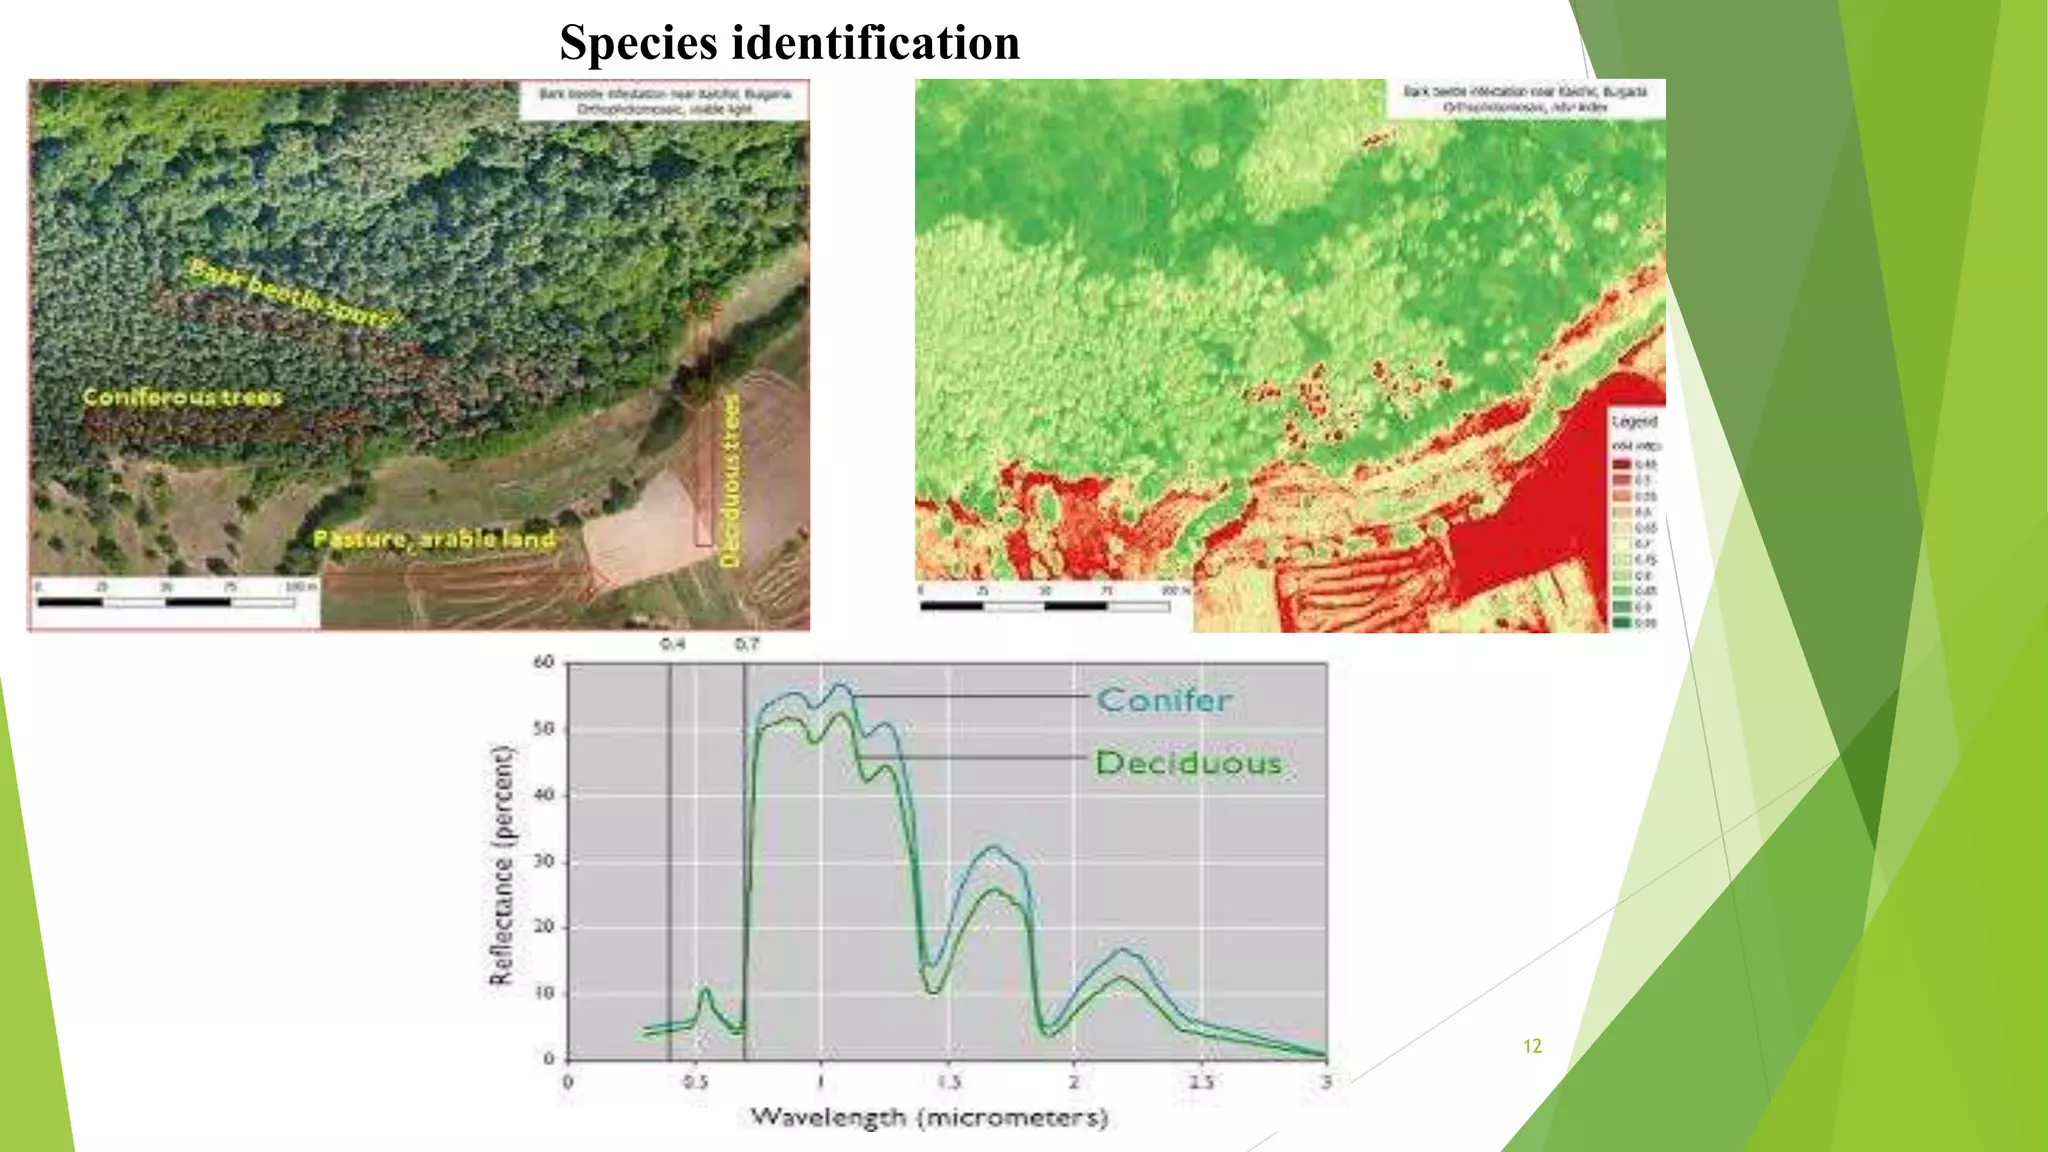
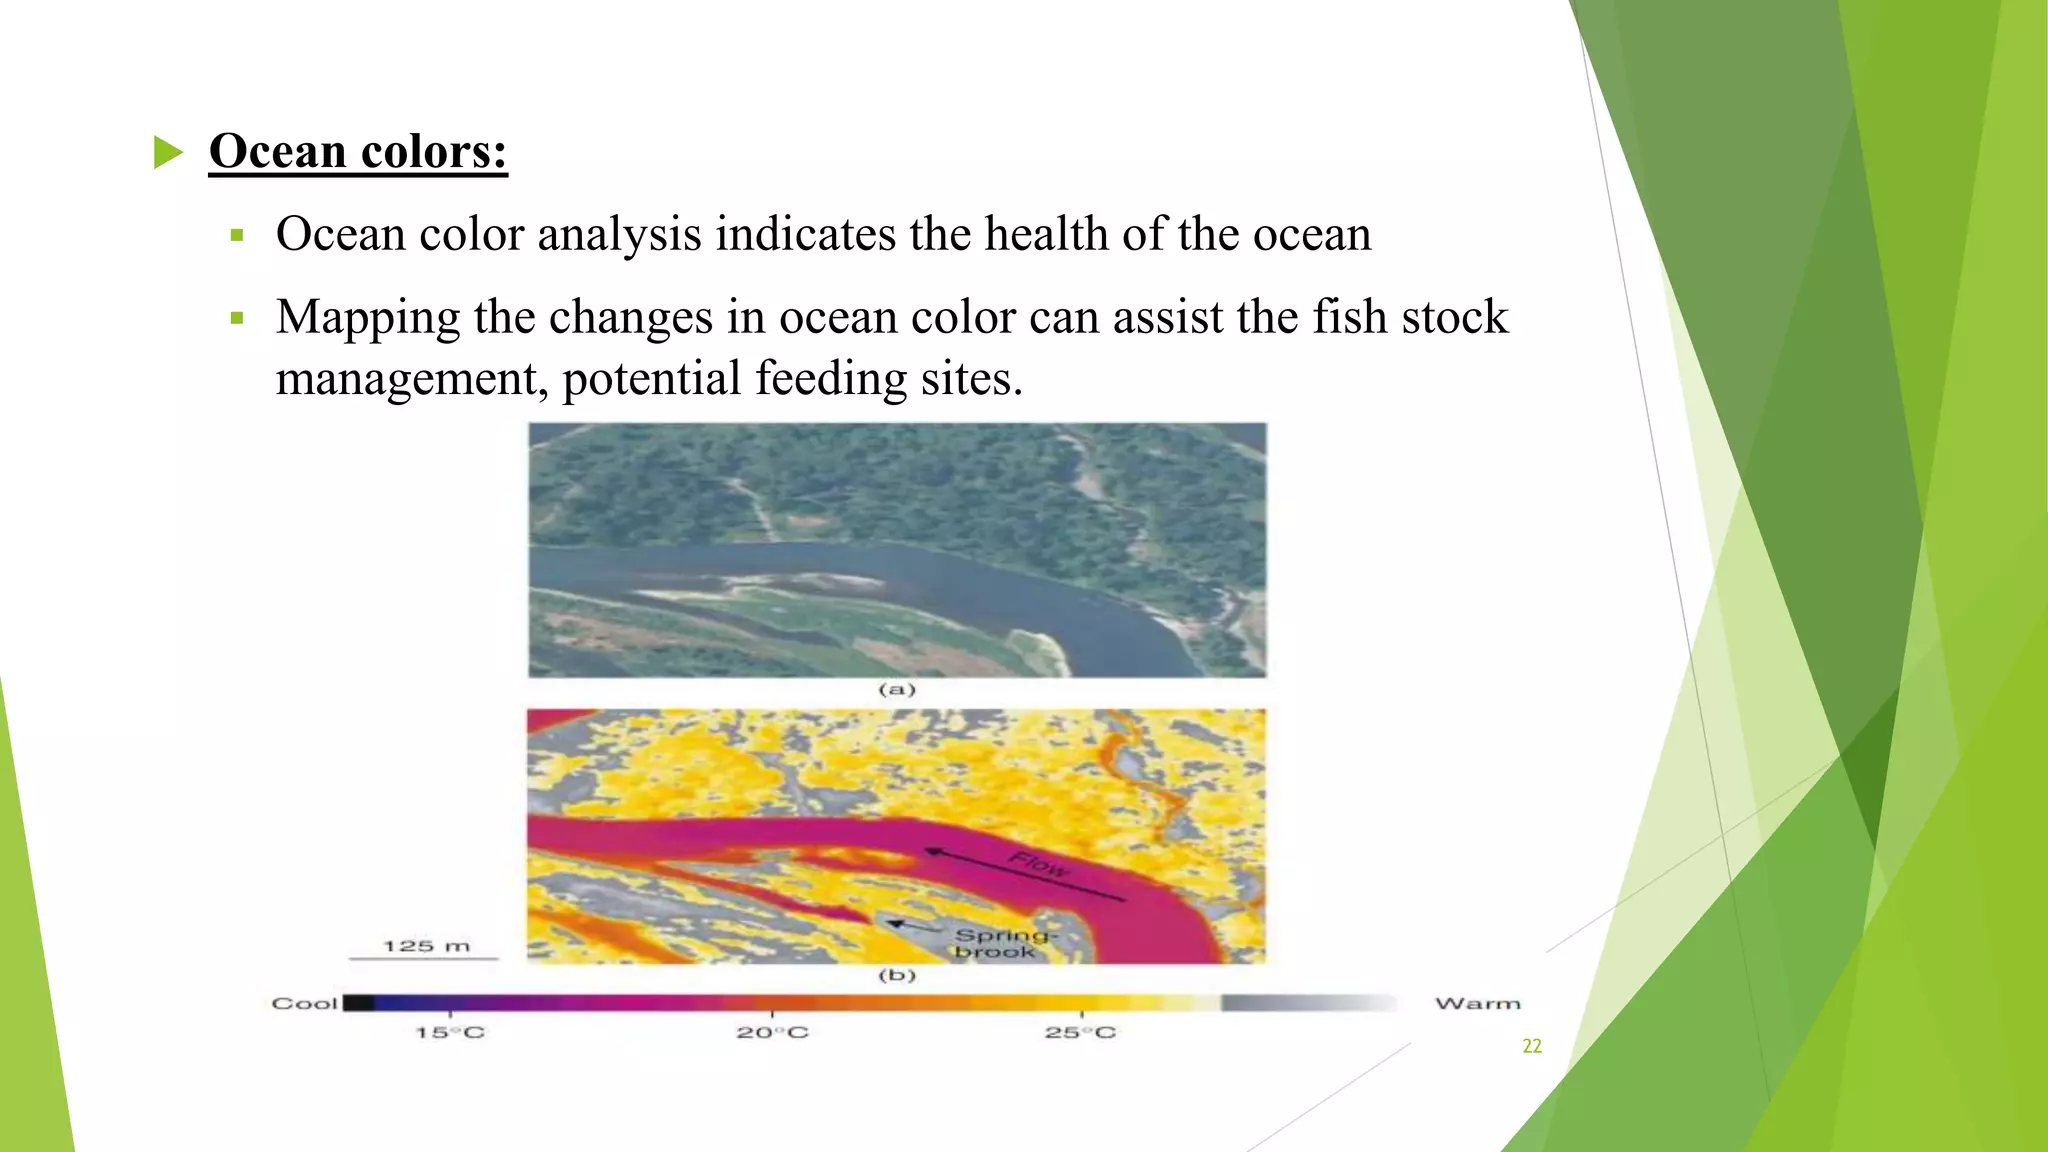
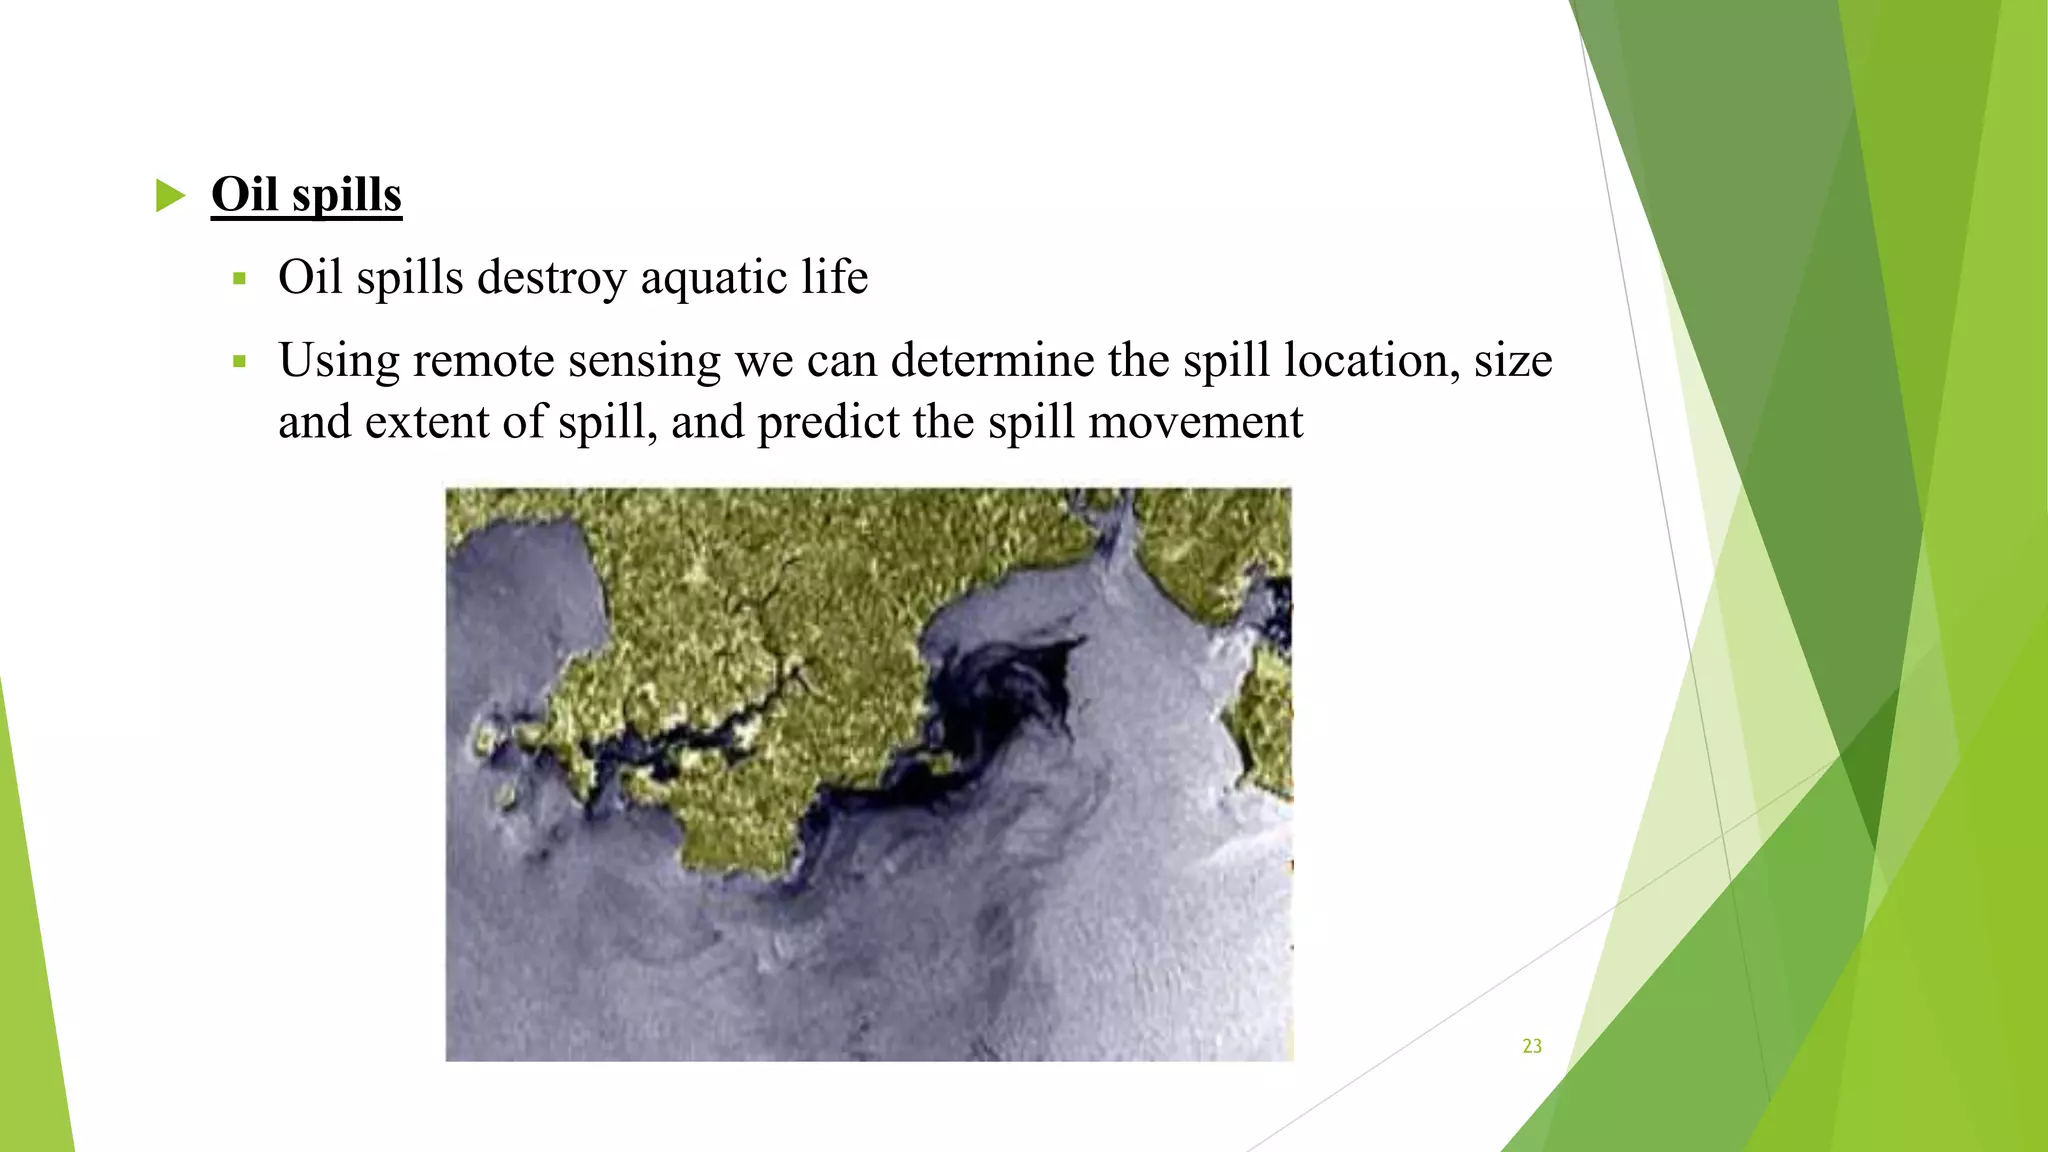
APPLICATIONS OF REMOTE
SENSING
1
Table of contents
 Introduction
 Land cover and land use
 Agriculture
 Forestry
 Geology
 Geomorphology
 Urban application
 Hydrology
 Mapping
 Ocean and coastal monitoring
2
Introduction
 Remote sensing is a versatile field.
 Can be used in various field such as agriculture, geology, oceanography, etc.
 Some areas of application include
 Landcover and landuse
 Agriculture
 Forestry
 Geology
 Geomorphology
 Urban applications
 Hydrology
 Mapping
 Ocean and coastal monitoring 3
Land cover and land use
 Land cover: physical condition of ground surface
 Land use: human employment of land
 Land use/land cover change:
 urban encroachment over agriculture/forest land.
 Change in land use from rural to urban is monitored to estimate
populations and sustainable planning.
 High resolution imageries can be used to estimate housing density.
 Analysis agriculture vs urban land use
 Can be used to identify building and violation
4
 Land cover mapping:
 Basic inventory for all levels of government.
 Includes ice cover, snow, biomass mapping, etc.
 Biomass mapping includes leaf area index (LAI) which denotes
health of forest.
 LAI= ∗
𝑡𝑜𝑡𝑎𝑙 𝑎𝑟𝑒𝑎 𝑜𝑓 𝑙𝑒𝑎𝑣𝑒𝑠
𝑡𝑜𝑡𝑎𝑙 𝑠𝑢𝑟𝑓𝑎𝑐𝑒 𝑎𝑟𝑒𝑎 𝑐𝑜𝑛𝑡𝑎𝑖𝑛𝑖𝑛𝑔 𝑡ℎ𝑒 𝑣𝑒𝑔𝑒𝑡𝑎𝑡𝑖𝑜𝑛
 LAI is dependent on reflectance . Near IR reflectance increase
with LAI
 RS sensors capture changes in plant phenology by identifying
changes in chlorophyll content.
5
1
2
Agriculture
 Plays a dominant role in economy
 RS aids in understanding health of crop, extent of infestation and potential
yields
 RS does not replace field work but directs farmers to the areas in need of
immediate attention
 Air borne images can be used to examine crop health and viability.
 RS gives synoptic view, provides information on health of vegetation
through spectral reflectance
6
 Crop monitoring and crop assessment:
 RS imagery is done at a frequent basis.
 Growth differences are spotted
 Helps to identify areas of stunted growth
 Reduces input costs
 Not only detects problems but also monitors success of the treatment.
7
Forestry
 Introduction
 Commercial and non commercial forests
 Causes of forest depletion (Natural and human activities)
 Traditional analysis of forests
 Use of remote sensing in forestry
8
Remote sensing application in forestry include the following:
 Reconnaissance mapping:
 Collecting information (forest cover updating, depletion,
biophysical properties of forest stand)
 Forest cover type classification (usually done by Landsat TM
FCC)
 Agroforestry mapping
 Commercial forestry:
 Collecting information( harvesting, timber supply, forest type,
vegetation density and biomass measurement)
 Clear cut mapping
 Burn delineation
 Forest inventory
 Biomass estimation
 Species inventory 9
 Environmental mapping:
 Concerned with monitoring the quantity, health, and diversity of the
earth’s forests
 Deforestation
 Species inventory
 Watershed protection
 Coastal protection
 Forest health
10
Clear cut mapping and deforestation
 Multi temporal data provides for change detection analysis.
 Normal image analysis
 Radar image analysis
11
Species identification
12
Fire detection
 Detect and monitor forest fire
 Thermal and meteorological data can be used when optical
sensors are hindered by smoke or darkness 13
Geology
 Mapping of surficial deposit/bed rock
 Lithological mapping
 Structural mapping
 Mineral exploration
 Environmental geology
 Geo hazard mapping
14
Structural mapping and terrain analysis
15
Geomorphology
 Introduction:
It is the study of shape or configuration of earths solid surface above and below
ocean level, involving the classification of landforms and the process by which
they develop.
 Application of RS:
 4
 In geomorphology the RS application tells about the landforms and the process
that are being used i.e. endogenetic and exogenetic process
 In its most simple application we can take remotely sensed image of earths
surface and interpret what we see to produce a geomorphological map.
 A very useful regard to todays RS is the availability of hyperspectral imagery.
 RS provides 3D representation of the surface in the production of digital
elevations models
 RS allows the rapid assessment of large areas and for monitoring of changes to
these areas 16
Urban application
 Analyzing urban growth studies
 Detection and measurement of variety of elements relating to the
morphology of cities
 Urban change analysis and modelling of future growth.
17
Hydrology
Application of remote sensing in hydrology are as follows:
 Water quality monitoring
 Flood mapping and monitoring
 Measuring snow thickness
 Soil moisture estimation
 Ground water prospects and recharge
18
Mapping
Application of remote sensing in mapping includes following:
 Planimetry:
It consists of the identification and geolocation of basic land covers (e.g., forest,
drainage) and anthropogenic features (e.g. urban infrastructures, transportation
networks) in (x,y) plane
 Digital elevation models(DEMs):
 DEM is the digital representation of the land surface elevation with respect to
any reference datum.
 It is the simplest form of digital representation of topography
 It is used to determine terrain attributes such as elevation at any point and slope
19
 Base line thematic mapping/topographic mapping:
 It is the digital integration of satellite imagery, land use, land cover and
topographic data to produce an image map with contour lines.
 Various combinations of thematic information may be displayed to
optimize the map information for application purposes like:
• land use allocation
• Utility site selection
• Route planning
20
Ocean and coastal monitoring
 RS offers numerous methods for acquiring information of ocean and
coastal regions
 Wind speed and direction, wave heights, sea water temperature can
be recorded
 This information is useful for offshore engineering works, fisheries
and more
21
 Ocean colors:
 Ocean color analysis indicates the health of the ocean
 Mapping the changes in ocean color can assist the fish stock
management, potential feeding sites.
22
 Oil spills
 Oil spills destroy aquatic life
 Using remote sensing we can determine the spill location, size
and extent of spill, and predict the spill movement
23
 Sea ice:
 Remote sensing data can be used to map and identify ice type, locate
cracks, movements.
24
 Ship routing:
 The remote sensing data allows to design us the most feasible
foots for designing routes for the ships.
 Data such as wind speed , wave height, sea ice, provide us
information of ocean activity.
25
26

Application of remote sensing

  • 1.
  • 2.
    Table of contents Introduction  Land cover and land use  Agriculture  Forestry  Geology  Geomorphology  Urban application  Hydrology  Mapping  Ocean and coastal monitoring 2
  • 3.
    Introduction  Remote sensingis a versatile field.  Can be used in various field such as agriculture, geology, oceanography, etc.  Some areas of application include  Landcover and landuse  Agriculture  Forestry  Geology  Geomorphology  Urban applications  Hydrology  Mapping  Ocean and coastal monitoring 3
  • 4.
    Land cover andland use  Land cover: physical condition of ground surface  Land use: human employment of land  Land use/land cover change:  urban encroachment over agriculture/forest land.  Change in land use from rural to urban is monitored to estimate populations and sustainable planning.  High resolution imageries can be used to estimate housing density.  Analysis agriculture vs urban land use  Can be used to identify building and violation 4
  • 5.
     Land covermapping:  Basic inventory for all levels of government.  Includes ice cover, snow, biomass mapping, etc.  Biomass mapping includes leaf area index (LAI) which denotes health of forest.  LAI= ∗ 𝑡𝑜𝑡𝑎𝑙 𝑎𝑟𝑒𝑎 𝑜𝑓 𝑙𝑒𝑎𝑣𝑒𝑠 𝑡𝑜𝑡𝑎𝑙 𝑠𝑢𝑟𝑓𝑎𝑐𝑒 𝑎𝑟𝑒𝑎 𝑐𝑜𝑛𝑡𝑎𝑖𝑛𝑖𝑛𝑔 𝑡ℎ𝑒 𝑣𝑒𝑔𝑒𝑡𝑎𝑡𝑖𝑜𝑛  LAI is dependent on reflectance . Near IR reflectance increase with LAI  RS sensors capture changes in plant phenology by identifying changes in chlorophyll content. 5 1 2
  • 6.
    Agriculture  Plays adominant role in economy  RS aids in understanding health of crop, extent of infestation and potential yields  RS does not replace field work but directs farmers to the areas in need of immediate attention  Air borne images can be used to examine crop health and viability.  RS gives synoptic view, provides information on health of vegetation through spectral reflectance 6
  • 7.
     Crop monitoringand crop assessment:  RS imagery is done at a frequent basis.  Growth differences are spotted  Helps to identify areas of stunted growth  Reduces input costs  Not only detects problems but also monitors success of the treatment. 7
  • 8.
    Forestry  Introduction  Commercialand non commercial forests  Causes of forest depletion (Natural and human activities)  Traditional analysis of forests  Use of remote sensing in forestry 8
  • 9.
    Remote sensing applicationin forestry include the following:  Reconnaissance mapping:  Collecting information (forest cover updating, depletion, biophysical properties of forest stand)  Forest cover type classification (usually done by Landsat TM FCC)  Agroforestry mapping  Commercial forestry:  Collecting information( harvesting, timber supply, forest type, vegetation density and biomass measurement)  Clear cut mapping  Burn delineation  Forest inventory  Biomass estimation  Species inventory 9
  • 10.
     Environmental mapping: Concerned with monitoring the quantity, health, and diversity of the earth’s forests  Deforestation  Species inventory  Watershed protection  Coastal protection  Forest health 10
  • 11.
    Clear cut mappingand deforestation  Multi temporal data provides for change detection analysis.  Normal image analysis  Radar image analysis 11
  • 12.
  • 13.
    Fire detection  Detectand monitor forest fire  Thermal and meteorological data can be used when optical sensors are hindered by smoke or darkness 13
  • 14.
    Geology  Mapping ofsurficial deposit/bed rock  Lithological mapping  Structural mapping  Mineral exploration  Environmental geology  Geo hazard mapping 14
  • 15.
    Structural mapping andterrain analysis 15
  • 16.
    Geomorphology  Introduction: It isthe study of shape or configuration of earths solid surface above and below ocean level, involving the classification of landforms and the process by which they develop.  Application of RS:  4  In geomorphology the RS application tells about the landforms and the process that are being used i.e. endogenetic and exogenetic process  In its most simple application we can take remotely sensed image of earths surface and interpret what we see to produce a geomorphological map.  A very useful regard to todays RS is the availability of hyperspectral imagery.  RS provides 3D representation of the surface in the production of digital elevations models  RS allows the rapid assessment of large areas and for monitoring of changes to these areas 16
  • 17.
    Urban application  Analyzingurban growth studies  Detection and measurement of variety of elements relating to the morphology of cities  Urban change analysis and modelling of future growth. 17
  • 18.
    Hydrology Application of remotesensing in hydrology are as follows:  Water quality monitoring  Flood mapping and monitoring  Measuring snow thickness  Soil moisture estimation  Ground water prospects and recharge 18
  • 19.
    Mapping Application of remotesensing in mapping includes following:  Planimetry: It consists of the identification and geolocation of basic land covers (e.g., forest, drainage) and anthropogenic features (e.g. urban infrastructures, transportation networks) in (x,y) plane  Digital elevation models(DEMs):  DEM is the digital representation of the land surface elevation with respect to any reference datum.  It is the simplest form of digital representation of topography  It is used to determine terrain attributes such as elevation at any point and slope 19
  • 20.
     Base linethematic mapping/topographic mapping:  It is the digital integration of satellite imagery, land use, land cover and topographic data to produce an image map with contour lines.  Various combinations of thematic information may be displayed to optimize the map information for application purposes like: • land use allocation • Utility site selection • Route planning 20
  • 21.
    Ocean and coastalmonitoring  RS offers numerous methods for acquiring information of ocean and coastal regions  Wind speed and direction, wave heights, sea water temperature can be recorded  This information is useful for offshore engineering works, fisheries and more 21
  • 22.
     Ocean colors: Ocean color analysis indicates the health of the ocean  Mapping the changes in ocean color can assist the fish stock management, potential feeding sites. 22
  • 23.
     Oil spills Oil spills destroy aquatic life  Using remote sensing we can determine the spill location, size and extent of spill, and predict the spill movement 23
  • 24.
     Sea ice: Remote sensing data can be used to map and identify ice type, locate cracks, movements. 24
  • 25.
     Ship routing: The remote sensing data allows to design us the most feasible foots for designing routes for the ships.  Data such as wind speed , wave height, sea ice, provide us information of ocean activity. 25
  • 26.