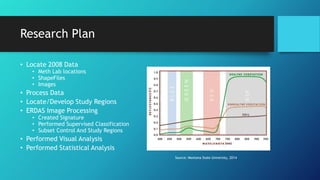
SlideShare a Scribd company logo
Supervised Classification
Identifying Methamphetamine Locations in Denver Colorado
By: Chad Yowler
Overview
• Meth – “Methamphetamine
(Also Called Meth, Crystal,
Chalk, And Ice, Among Other
Terms) Is An Extremely
Addictive Stimulant Drug That
Is Chemically Similar To
Amphetamine” (National
Institute On Drug Abuse, 2014)
• Economic, Social, And
Environmental Effects
• In 2008 – 8810 Meth Lab
Seizures
• Rural Low Income Areas
Have A Higher Incident
Rate
• Chemical Dumping
Damages Vegetation,
Water, And Has Negative
Effects On Wildlife
Why Remote Sensing?
• Can Identify Changes In
Landuse/Vegetation The
Human Eye Cant Detect
• Aerial Imagery As A
Supplement For Ground Truth
• Quick Analysis Of Many Areas
Through One Signature
• Potential Predictive
Capabilities
Method Used In Other Research
• Jasper County Missouri
• Highly Rural
• Highest Percentage Meth Lab
Seizures Per Capita
• Used Supervised Classification To
Identify Healthy and Unhealthy
Vegetation Percentages
• Compared Meth Sites To Control
Sites
• Statistically Significant Results
Source: Hall, 2014
Applying The Method to an Urban Setting
• Denver-low amount of
incidents
• 23rd Largest City by Population
• Highly Urban
• Easy Access to Data and
Statistics
• 4 Meth Lab Locations in 2008
• Good Study Area
Source: HomeFacts.com, 2015
Research Plan
• Locate 2008 Data
• Meth Lab locations
• ShapeFiles
• Images
• Process Data
• Locate/Develop Study Regions
• ERDAS Image Processing
• Created Signature
• Performed Supervised Classification
• Subset Control And Study Regions
• Performed Visual Analysis
• Performed Statistical Analysis
Source: Montana State University, 2014
Data Acquisition
• Denver Open Data Catalog
• DEA: Drug Enforcement Agency
• Yourmapper
• Allowed For Export Into Google
Earth
• Earth Explorer
• USGS: United States Geological
Survey
Geoprocessing
• Points Were Put Into KML Format
From Google Earth
• ArcMap Tool To Create Shapefile
From A KML
• Used Select By Attribute To Select Only
2008 Locations
• Created New “2008methlab.Shp File”
Study Regions
Region BRegion A
Create Signature
• Create New AOI Layer
• Raster->Supervised->Signature
Layer
• Select Pixels From Map->Merge-
>Name->Assign Color
Healthy(Green) Unhealthy(Red)
Clip Study Regions/Perform Supervised
Classification
• Create New AOI->Draw Polygon->Select
Raster->Subset & Chip->From AOI
• Supervised Classification->Maximum
Likelihood
Region A Region B
Visual Analysis
• Meth Labs • Not Meth Labs
A
B B
A
Statistics
Meth Lab
A
Healthy%:
46.67
Standard
Deviation(s):
.514
P-Value:
.314
Meth Lab
B
Healthy%:
32.17
Standard
Deviation(s):
1.597
P-Value:
.085
• Based On The Supervised
Classification Of The Meth Lab
Locations There Was Not A
Statistically Significant Identified
Change In Healthy Vegetation
Percentage
• Lab B Was Better Identified Using
The Signature
• Nearly No Difference In Meth Lab
A Compared To Control Sites
• At 90% Confidence Interval Meth
Lab B Would Meet Threshold Of
Statistical Significance
One Tailed T-Test
Confidence Interval α=.05
σ = 13.367
x̄ = 53.527
Conclusion
• A Lot Of Assumptions Made
• Selection Bias
• Could Be Improved With Random
Sampling
• Image Quality Too Low To Identify
Great Change In Vegetation At A
Parcel Level
• Works Better With Open Fields (Rural
Areas)
• Supervised Classification Can Identify
Healthy And Unhealthy Vegetation
• Difficult To Use For Identifying Meth
Lab Locations In An Urban Setting
• Study Could Be Improved With More
Samples
• Better Classification Can Be Done
With More Time, Better Images, And
A Larger Sample
Work Cited
• (n.d.). Retrieved December 8, 2015, from http://forensic-applications.com/meth/DEA_Druglab_list.pdf
• City Mayors: Largest 100 US cities. (n.d.). Retrieved December 8, 2015, from
http://www.citymayors.com/gratis/uscities_100.html
• Denver, CO Former Drug Labs Information and Locations. (n.d.). Retrieved December 8, 2015, from
http://www.homefacts.com/methlabs/Colorado/Denver-County/Denver.html
• Hall, M. (2014). EVALUATING THE POTENTIAL OF USING MULTISPECTRAL IMAGERY TO IDENTIFY AREAS OF
METHAMPHETAMINE PRODUCTION IN JASPER COUNTY, MISSOURI.
• Home. (n.d.). Retrieved December 8, 2015, from http://www.fs.fed.us/lei/dangers-meth-labs.php
• Methamphetamine. (n.d.). Retrieved December 8, 2015, from
http://www.drugabuse.gov/publications/drugfacts/methamphetamine
• Spectral Imager. (n.d.). Retrieved December 8, 2015, from
http://www.coe.montana.edu/ee/seniordesign/archive/FL10/tethered_balloon/index.html

More Related Content

What's hot

Remote Sensing: Image Classification
Remote Sensing: Image ClassificationRemote Sensing: Image Classification
Remote Sensing: Image ClassificationKamlesh Kumar
 
Remote sensing by jitendra thakor
Remote sensing by jitendra thakorRemote sensing by jitendra thakor
Remote sensing by jitendra thakorgandhinagar
 
Fundamentals of Remote Sensing
Fundamentals of Remote SensingFundamentals of Remote Sensing
Fundamentals of Remote SensingShah Naseer
 
Aerial photographs and their interpretation
Aerial photographs and their interpretationAerial photographs and their interpretation
Aerial photographs and their interpretationSumant Diwakar
 
Digital image processing
Digital image processingDigital image processing
Digital image processinglakhveer singh
 
Chapter 5: Remote sensing
Chapter 5: Remote sensingChapter 5: Remote sensing
Chapter 5: Remote sensingShankar Gangaju
 
Basics of Remote Sensing
Basics of Remote SensingBasics of Remote Sensing
Basics of Remote SensingAkash Tikhe
 
DATA in GIS and DATA Query
DATA in GIS and DATA QueryDATA in GIS and DATA Query
DATA in GIS and DATA QueryKU Leuven
 
Introduction to Landsat
Introduction to LandsatIntroduction to Landsat
Introduction to LandsatNizam GIS
 
Scale and resolution
Scale and resolutionScale and resolution
Scale and resolutionshabir dar
 
IMAGE INTERPRETATION TECHNIQUES of survey
IMAGE INTERPRETATION TECHNIQUES of surveyIMAGE INTERPRETATION TECHNIQUES of survey
IMAGE INTERPRETATION TECHNIQUES of surveyKaran Patel
 
Seminar on gis analysis functions
Seminar on gis analysis functionsSeminar on gis analysis functions
Seminar on gis analysis functionsPramoda Raj
 
Platforms of Remote sensing and GIS
Platforms of Remote sensing and GISPlatforms of Remote sensing and GIS
Platforms of Remote sensing and GISMouna Guru
 
Band ratioing presentation
Band ratioing presentationBand ratioing presentation
Band ratioing presentationsk asadul haque
 

What's hot (20)

Historical Development of Photogrammetry
Historical Development of PhotogrammetryHistorical Development of Photogrammetry
Historical Development of Photogrammetry
 
Remote Sensing: Image Classification
Remote Sensing: Image ClassificationRemote Sensing: Image Classification
Remote Sensing: Image Classification
 
Remote sensing by jitendra thakor
Remote sensing by jitendra thakorRemote sensing by jitendra thakor
Remote sensing by jitendra thakor
 
Fundamentals of Remote Sensing
Fundamentals of Remote SensingFundamentals of Remote Sensing
Fundamentals of Remote Sensing
 
Aerial photographs and their interpretation
Aerial photographs and their interpretationAerial photographs and their interpretation
Aerial photographs and their interpretation
 
Remote sensing
Remote sensingRemote sensing
Remote sensing
 
Digital image processing
Digital image processingDigital image processing
Digital image processing
 
Chapter 5: Remote sensing
Chapter 5: Remote sensingChapter 5: Remote sensing
Chapter 5: Remote sensing
 
Basics of Remote Sensing
Basics of Remote SensingBasics of Remote Sensing
Basics of Remote Sensing
 
GIS data analysis
GIS data analysisGIS data analysis
GIS data analysis
 
Historical Development of Photogrammetry
Historical Development of PhotogrammetryHistorical Development of Photogrammetry
Historical Development of Photogrammetry
 
Remote sensing
Remote sensingRemote sensing
Remote sensing
 
DATA in GIS and DATA Query
DATA in GIS and DATA QueryDATA in GIS and DATA Query
DATA in GIS and DATA Query
 
Introduction to Landsat
Introduction to LandsatIntroduction to Landsat
Introduction to Landsat
 
Scale and resolution
Scale and resolutionScale and resolution
Scale and resolution
 
IMAGE INTERPRETATION TECHNIQUES of survey
IMAGE INTERPRETATION TECHNIQUES of surveyIMAGE INTERPRETATION TECHNIQUES of survey
IMAGE INTERPRETATION TECHNIQUES of survey
 
Seminar on gis analysis functions
Seminar on gis analysis functionsSeminar on gis analysis functions
Seminar on gis analysis functions
 
Platforms of Remote sensing and GIS
Platforms of Remote sensing and GISPlatforms of Remote sensing and GIS
Platforms of Remote sensing and GIS
 
Band ratioing presentation
Band ratioing presentationBand ratioing presentation
Band ratioing presentation
 
Stereoscopic parallax
Stereoscopic parallaxStereoscopic parallax
Stereoscopic parallax
 

Viewers also liked

Normalized Difference Vegetation Index (NDVI)
Normalized Difference Vegetation Index (NDVI)Normalized Difference Vegetation Index (NDVI)
Normalized Difference Vegetation Index (NDVI)Susan Aragon
 
Introduce variable/ Indices using landsat image
Introduce variable/ Indices using landsat imageIntroduce variable/ Indices using landsat image
Introduce variable/ Indices using landsat imageKabir Uddin
 
Land cover supervised classification at Toro Park, California
Land cover supervised classification at Toro Park, CaliforniaLand cover supervised classification at Toro Park, California
Land cover supervised classification at Toro Park, CaliforniaLisa Jensen
 
Few Indicies(NDVI... etc) performed on ERDAS software using Model Maker
Few Indicies(NDVI... etc) performed on ERDAS software using Model MakerFew Indicies(NDVI... etc) performed on ERDAS software using Model Maker
Few Indicies(NDVI... etc) performed on ERDAS software using Model MakerSwetha A
 
Band Combination of Landsat 8 Earth-observing Satellite Images
Band Combination of Landsat 8 Earth-observing Satellite ImagesBand Combination of Landsat 8 Earth-observing Satellite Images
Band Combination of Landsat 8 Earth-observing Satellite ImagesKabir Uddin
 
Presentacion elafis Brasil 2009
Presentacion elafis Brasil 2009Presentacion elafis Brasil 2009
Presentacion elafis Brasil 2009Fredy Neira
 
Original SOINN
Original SOINNOriginal SOINN
Original SOINNSOINN Inc.
 
Program Evaluation and Review Technique (PERT)
Program Evaluation and Review Technique (PERT)Program Evaluation and Review Technique (PERT)
Program Evaluation and Review Technique (PERT)Abhishek Pachisia
 
Pert & cpm project management
Pert & cpm   project managementPert & cpm   project management
Pert & cpm project managementRahul Dubey
 

Viewers also liked (12)

Normalized Difference Vegetation Index (NDVI)
Normalized Difference Vegetation Index (NDVI)Normalized Difference Vegetation Index (NDVI)
Normalized Difference Vegetation Index (NDVI)
 
NDVI
NDVINDVI
NDVI
 
Introduce variable/ Indices using landsat image
Introduce variable/ Indices using landsat imageIntroduce variable/ Indices using landsat image
Introduce variable/ Indices using landsat image
 
Land cover supervised classification at Toro Park, California
Land cover supervised classification at Toro Park, CaliforniaLand cover supervised classification at Toro Park, California
Land cover supervised classification at Toro Park, California
 
Clustering
ClusteringClustering
Clustering
 
Few Indicies(NDVI... etc) performed on ERDAS software using Model Maker
Few Indicies(NDVI... etc) performed on ERDAS software using Model MakerFew Indicies(NDVI... etc) performed on ERDAS software using Model Maker
Few Indicies(NDVI... etc) performed on ERDAS software using Model Maker
 
Band Combination of Landsat 8 Earth-observing Satellite Images
Band Combination of Landsat 8 Earth-observing Satellite ImagesBand Combination of Landsat 8 Earth-observing Satellite Images
Band Combination of Landsat 8 Earth-observing Satellite Images
 
Presentacion elafis Brasil 2009
Presentacion elafis Brasil 2009Presentacion elafis Brasil 2009
Presentacion elafis Brasil 2009
 
Original SOINN
Original SOINNOriginal SOINN
Original SOINN
 
Pert & Cpm
Pert & CpmPert & Cpm
Pert & Cpm
 
Program Evaluation and Review Technique (PERT)
Program Evaluation and Review Technique (PERT)Program Evaluation and Review Technique (PERT)
Program Evaluation and Review Technique (PERT)
 
Pert & cpm project management
Pert & cpm   project managementPert & cpm   project management
Pert & cpm project management
 

Similar to Supervised Classification

ASSESSMENT OF CONTRIBUTING FACTORS TO THE REDUCTION OF DIARRHEA IN RURAL COMM...
ASSESSMENT OF CONTRIBUTING FACTORS TO THE REDUCTION OF DIARRHEA IN RURAL COMM...ASSESSMENT OF CONTRIBUTING FACTORS TO THE REDUCTION OF DIARRHEA IN RURAL COMM...
ASSESSMENT OF CONTRIBUTING FACTORS TO THE REDUCTION OF DIARRHEA IN RURAL COMM...leevg11
 
Analytical Chemistry.pptx
Analytical Chemistry.pptxAnalytical Chemistry.pptx
Analytical Chemistry.pptxWeareIndian4
 
Oral Fluid as a Chemical Test for the DRE Program
Oral Fluid as a Chemical Test for the DRE ProgramOral Fluid as a Chemical Test for the DRE Program
Oral Fluid as a Chemical Test for the DRE ProgramNMS Labs
 
Seminar on Rapid Epidemiological Assessment.pptx
Seminar on Rapid Epidemiological Assessment.pptxSeminar on Rapid Epidemiological Assessment.pptx
Seminar on Rapid Epidemiological Assessment.pptxIsaacLalrawngbawla1
 
Statistical learning approach for estimating water quality parameters
Statistical learning approach for estimating water quality parametersStatistical learning approach for estimating water quality parameters
Statistical learning approach for estimating water quality parametersDinesh Neupane
 
Establishing Reference Intervals in Laboratory Medicine
Establishing Reference Intervals in Laboratory MedicineEstablishing Reference Intervals in Laboratory Medicine
Establishing Reference Intervals in Laboratory MedicineShreekrishnaMaharjan6
 
SAMPLING.pptx for analystical chemistry sample techniques
SAMPLING.pptx for analystical chemistry sample techniquesSAMPLING.pptx for analystical chemistry sample techniques
SAMPLING.pptx for analystical chemistry sample techniquesrodneykiptoo8
 
Davis+Hilvers_9-21-15_IECA Presentation (Pub) (1)
Davis+Hilvers_9-21-15_IECA Presentation (Pub) (1)Davis+Hilvers_9-21-15_IECA Presentation (Pub) (1)
Davis+Hilvers_9-21-15_IECA Presentation (Pub) (1)George Hilvers, EI
 
Sample selection and measuring instruments basic consideration of.pptx
Sample selection and measuring instruments basic consideration of.pptxSample selection and measuring instruments basic consideration of.pptx
Sample selection and measuring instruments basic consideration of.pptxaamnaemir
 
High Throughput Screening drugg discovery.pdf
High Throughput Screening drugg discovery.pdfHigh Throughput Screening drugg discovery.pdf
High Throughput Screening drugg discovery.pdfsayedjannatfatema72
 
Predicting crop yield and response to Nutrients from soil spectra at WCSS 201...
Predicting crop yield and response to Nutrients from soil spectra at WCSS 201...Predicting crop yield and response to Nutrients from soil spectra at WCSS 201...
Predicting crop yield and response to Nutrients from soil spectra at WCSS 201...CIAT
 
Harmon, Uncertainty analysis: An evaluation metric for synthesis science
Harmon, Uncertainty analysis: An evaluation metric for synthesis scienceHarmon, Uncertainty analysis: An evaluation metric for synthesis science
Harmon, Uncertainty analysis: An evaluation metric for synthesis sciencequestRCN
 

Similar to Supervised Classification (20)

ASSESSMENT OF CONTRIBUTING FACTORS TO THE REDUCTION OF DIARRHEA IN RURAL COMM...
ASSESSMENT OF CONTRIBUTING FACTORS TO THE REDUCTION OF DIARRHEA IN RURAL COMM...ASSESSMENT OF CONTRIBUTING FACTORS TO THE REDUCTION OF DIARRHEA IN RURAL COMM...
ASSESSMENT OF CONTRIBUTING FACTORS TO THE REDUCTION OF DIARRHEA IN RURAL COMM...
 
Analytical Chemistry.pptx
Analytical Chemistry.pptxAnalytical Chemistry.pptx
Analytical Chemistry.pptx
 
Oral Fluid as a Chemical Test for the DRE Program
Oral Fluid as a Chemical Test for the DRE ProgramOral Fluid as a Chemical Test for the DRE Program
Oral Fluid as a Chemical Test for the DRE Program
 
Seminar on Rapid Epidemiological Assessment.pptx
Seminar on Rapid Epidemiological Assessment.pptxSeminar on Rapid Epidemiological Assessment.pptx
Seminar on Rapid Epidemiological Assessment.pptx
 
Harmel - Monitoring to Support and Improve H/WQ Modeling
Harmel - Monitoring to Support and Improve H/WQ ModelingHarmel - Monitoring to Support and Improve H/WQ Modeling
Harmel - Monitoring to Support and Improve H/WQ Modeling
 
Statistical learning approach for estimating water quality parameters
Statistical learning approach for estimating water quality parametersStatistical learning approach for estimating water quality parameters
Statistical learning approach for estimating water quality parameters
 
Establishing Reference Intervals in Laboratory Medicine
Establishing Reference Intervals in Laboratory MedicineEstablishing Reference Intervals in Laboratory Medicine
Establishing Reference Intervals in Laboratory Medicine
 
SAMPLING.pptx for analystical chemistry sample techniques
SAMPLING.pptx for analystical chemistry sample techniquesSAMPLING.pptx for analystical chemistry sample techniques
SAMPLING.pptx for analystical chemistry sample techniques
 
Davis+Hilvers_9-21-15_IECA Presentation (Pub) (1)
Davis+Hilvers_9-21-15_IECA Presentation (Pub) (1)Davis+Hilvers_9-21-15_IECA Presentation (Pub) (1)
Davis+Hilvers_9-21-15_IECA Presentation (Pub) (1)
 
Sample selection and measuring instruments basic consideration of.pptx
Sample selection and measuring instruments basic consideration of.pptxSample selection and measuring instruments basic consideration of.pptx
Sample selection and measuring instruments basic consideration of.pptx
 
King - Edge of Field Water Quality Monitoring
King - Edge of Field Water Quality Monitoring King - Edge of Field Water Quality Monitoring
King - Edge of Field Water Quality Monitoring
 
High Throughput Screening drugg discovery.pdf
High Throughput Screening drugg discovery.pdfHigh Throughput Screening drugg discovery.pdf
High Throughput Screening drugg discovery.pdf
 
July 29-1030-Stroud
July 29-1030-StroudJuly 29-1030-Stroud
July 29-1030-Stroud
 
Predicting crop yield and response to Nutrients from soil spectra at WCSS 201...
Predicting crop yield and response to Nutrients from soil spectra at WCSS 201...Predicting crop yield and response to Nutrients from soil spectra at WCSS 201...
Predicting crop yield and response to Nutrients from soil spectra at WCSS 201...
 
Measuring the effect soil conservation sundermeier
Measuring the effect soil conservation   sundermeierMeasuring the effect soil conservation   sundermeier
Measuring the effect soil conservation sundermeier
 
Development of a Tool for Systematic Integration of Traditional and New Appro...
Development of a Tool for Systematic Integration of Traditional and New Appro...Development of a Tool for Systematic Integration of Traditional and New Appro...
Development of a Tool for Systematic Integration of Traditional and New Appro...
 
ChemColor.ppt
ChemColor.pptChemColor.ppt
ChemColor.ppt
 
Mawdsley monitoring climate change
Mawdsley monitoring climate changeMawdsley monitoring climate change
Mawdsley monitoring climate change
 
King - What We Monitor for and What We Learn
King - What We Monitor for and What We LearnKing - What We Monitor for and What We Learn
King - What We Monitor for and What We Learn
 
Harmon, Uncertainty analysis: An evaluation metric for synthesis science
Harmon, Uncertainty analysis: An evaluation metric for synthesis scienceHarmon, Uncertainty analysis: An evaluation metric for synthesis science
Harmon, Uncertainty analysis: An evaluation metric for synthesis science
 

Supervised Classification

  • 1. Supervised Classification Identifying Methamphetamine Locations in Denver Colorado By: Chad Yowler
  • 2. Overview • Meth – “Methamphetamine (Also Called Meth, Crystal, Chalk, And Ice, Among Other Terms) Is An Extremely Addictive Stimulant Drug That Is Chemically Similar To Amphetamine” (National Institute On Drug Abuse, 2014) • Economic, Social, And Environmental Effects • In 2008 – 8810 Meth Lab Seizures • Rural Low Income Areas Have A Higher Incident Rate • Chemical Dumping Damages Vegetation, Water, And Has Negative Effects On Wildlife
  • 3. Why Remote Sensing? • Can Identify Changes In Landuse/Vegetation The Human Eye Cant Detect • Aerial Imagery As A Supplement For Ground Truth • Quick Analysis Of Many Areas Through One Signature • Potential Predictive Capabilities
  • 4. Method Used In Other Research • Jasper County Missouri • Highly Rural • Highest Percentage Meth Lab Seizures Per Capita • Used Supervised Classification To Identify Healthy and Unhealthy Vegetation Percentages • Compared Meth Sites To Control Sites • Statistically Significant Results Source: Hall, 2014
  • 5. Applying The Method to an Urban Setting • Denver-low amount of incidents • 23rd Largest City by Population • Highly Urban • Easy Access to Data and Statistics • 4 Meth Lab Locations in 2008 • Good Study Area Source: HomeFacts.com, 2015
  • 6. Research Plan • Locate 2008 Data • Meth Lab locations • ShapeFiles • Images • Process Data • Locate/Develop Study Regions • ERDAS Image Processing • Created Signature • Performed Supervised Classification • Subset Control And Study Regions • Performed Visual Analysis • Performed Statistical Analysis Source: Montana State University, 2014
  • 7. Data Acquisition • Denver Open Data Catalog • DEA: Drug Enforcement Agency • Yourmapper • Allowed For Export Into Google Earth • Earth Explorer • USGS: United States Geological Survey
  • 8. Geoprocessing • Points Were Put Into KML Format From Google Earth • ArcMap Tool To Create Shapefile From A KML • Used Select By Attribute To Select Only 2008 Locations • Created New “2008methlab.Shp File”
  • 10. Create Signature • Create New AOI Layer • Raster->Supervised->Signature Layer • Select Pixels From Map->Merge- >Name->Assign Color Healthy(Green) Unhealthy(Red)
  • 11. Clip Study Regions/Perform Supervised Classification • Create New AOI->Draw Polygon->Select Raster->Subset & Chip->From AOI • Supervised Classification->Maximum Likelihood Region A Region B
  • 12. Visual Analysis • Meth Labs • Not Meth Labs A B B A
  • 13. Statistics Meth Lab A Healthy%: 46.67 Standard Deviation(s): .514 P-Value: .314 Meth Lab B Healthy%: 32.17 Standard Deviation(s): 1.597 P-Value: .085 • Based On The Supervised Classification Of The Meth Lab Locations There Was Not A Statistically Significant Identified Change In Healthy Vegetation Percentage • Lab B Was Better Identified Using The Signature • Nearly No Difference In Meth Lab A Compared To Control Sites • At 90% Confidence Interval Meth Lab B Would Meet Threshold Of Statistical Significance One Tailed T-Test Confidence Interval α=.05 σ = 13.367 x̄ = 53.527
  • 14. Conclusion • A Lot Of Assumptions Made • Selection Bias • Could Be Improved With Random Sampling • Image Quality Too Low To Identify Great Change In Vegetation At A Parcel Level • Works Better With Open Fields (Rural Areas) • Supervised Classification Can Identify Healthy And Unhealthy Vegetation • Difficult To Use For Identifying Meth Lab Locations In An Urban Setting • Study Could Be Improved With More Samples • Better Classification Can Be Done With More Time, Better Images, And A Larger Sample
  • 15. Work Cited • (n.d.). Retrieved December 8, 2015, from http://forensic-applications.com/meth/DEA_Druglab_list.pdf • City Mayors: Largest 100 US cities. (n.d.). Retrieved December 8, 2015, from http://www.citymayors.com/gratis/uscities_100.html • Denver, CO Former Drug Labs Information and Locations. (n.d.). Retrieved December 8, 2015, from http://www.homefacts.com/methlabs/Colorado/Denver-County/Denver.html • Hall, M. (2014). EVALUATING THE POTENTIAL OF USING MULTISPECTRAL IMAGERY TO IDENTIFY AREAS OF METHAMPHETAMINE PRODUCTION IN JASPER COUNTY, MISSOURI. • Home. (n.d.). Retrieved December 8, 2015, from http://www.fs.fed.us/lei/dangers-meth-labs.php • Methamphetamine. (n.d.). Retrieved December 8, 2015, from http://www.drugabuse.gov/publications/drugfacts/methamphetamine • Spectral Imager. (n.d.). Retrieved December 8, 2015, from http://www.coe.montana.edu/ee/seniordesign/archive/FL10/tethered_balloon/index.html