Downloaded 1,109 times
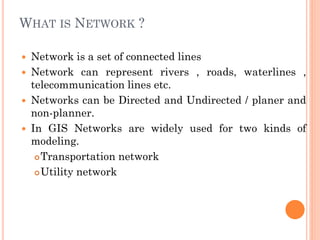


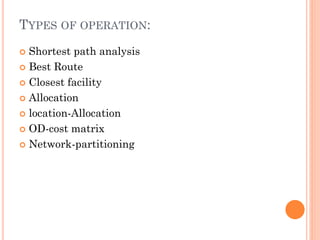


The document provides an overview of network analysis, defining networks and their types, including transportation and utility networks. It describes various network analysis operations such as shortest path analysis, best route determination, and closest facility identification, and explains how these analyses are implemented in GIS software like ArcGIS. Additionally, it discusses concepts like allocation, location-allocation, and the od-cost matrix, highlighting their applications in optimizing resource use and service delivery.