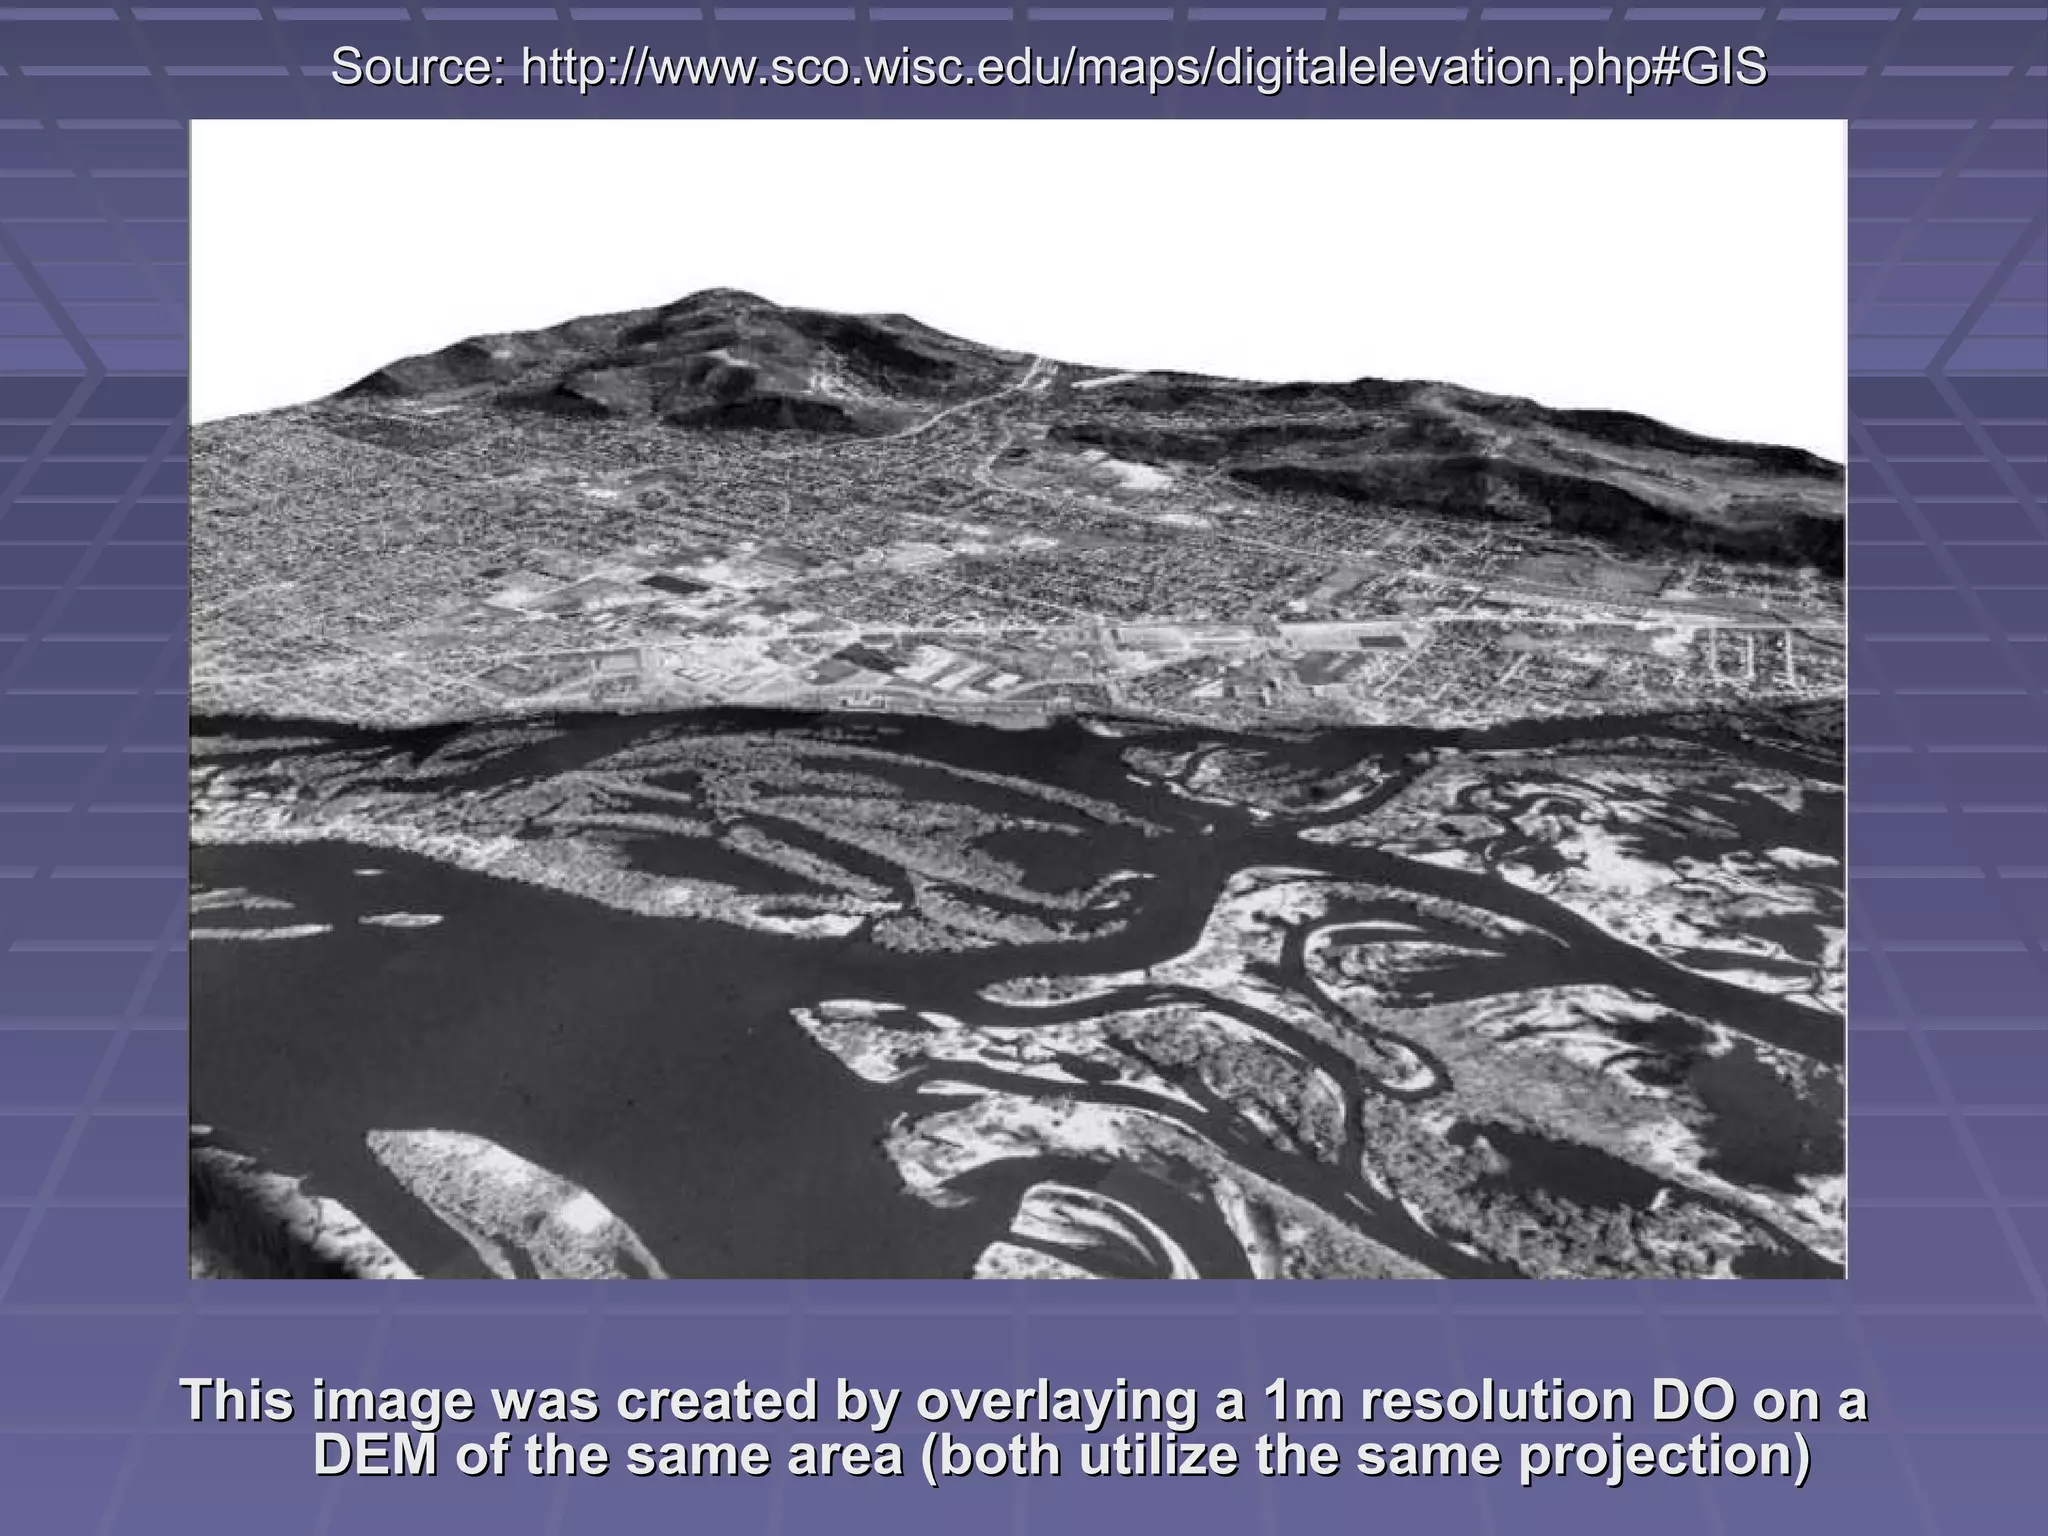
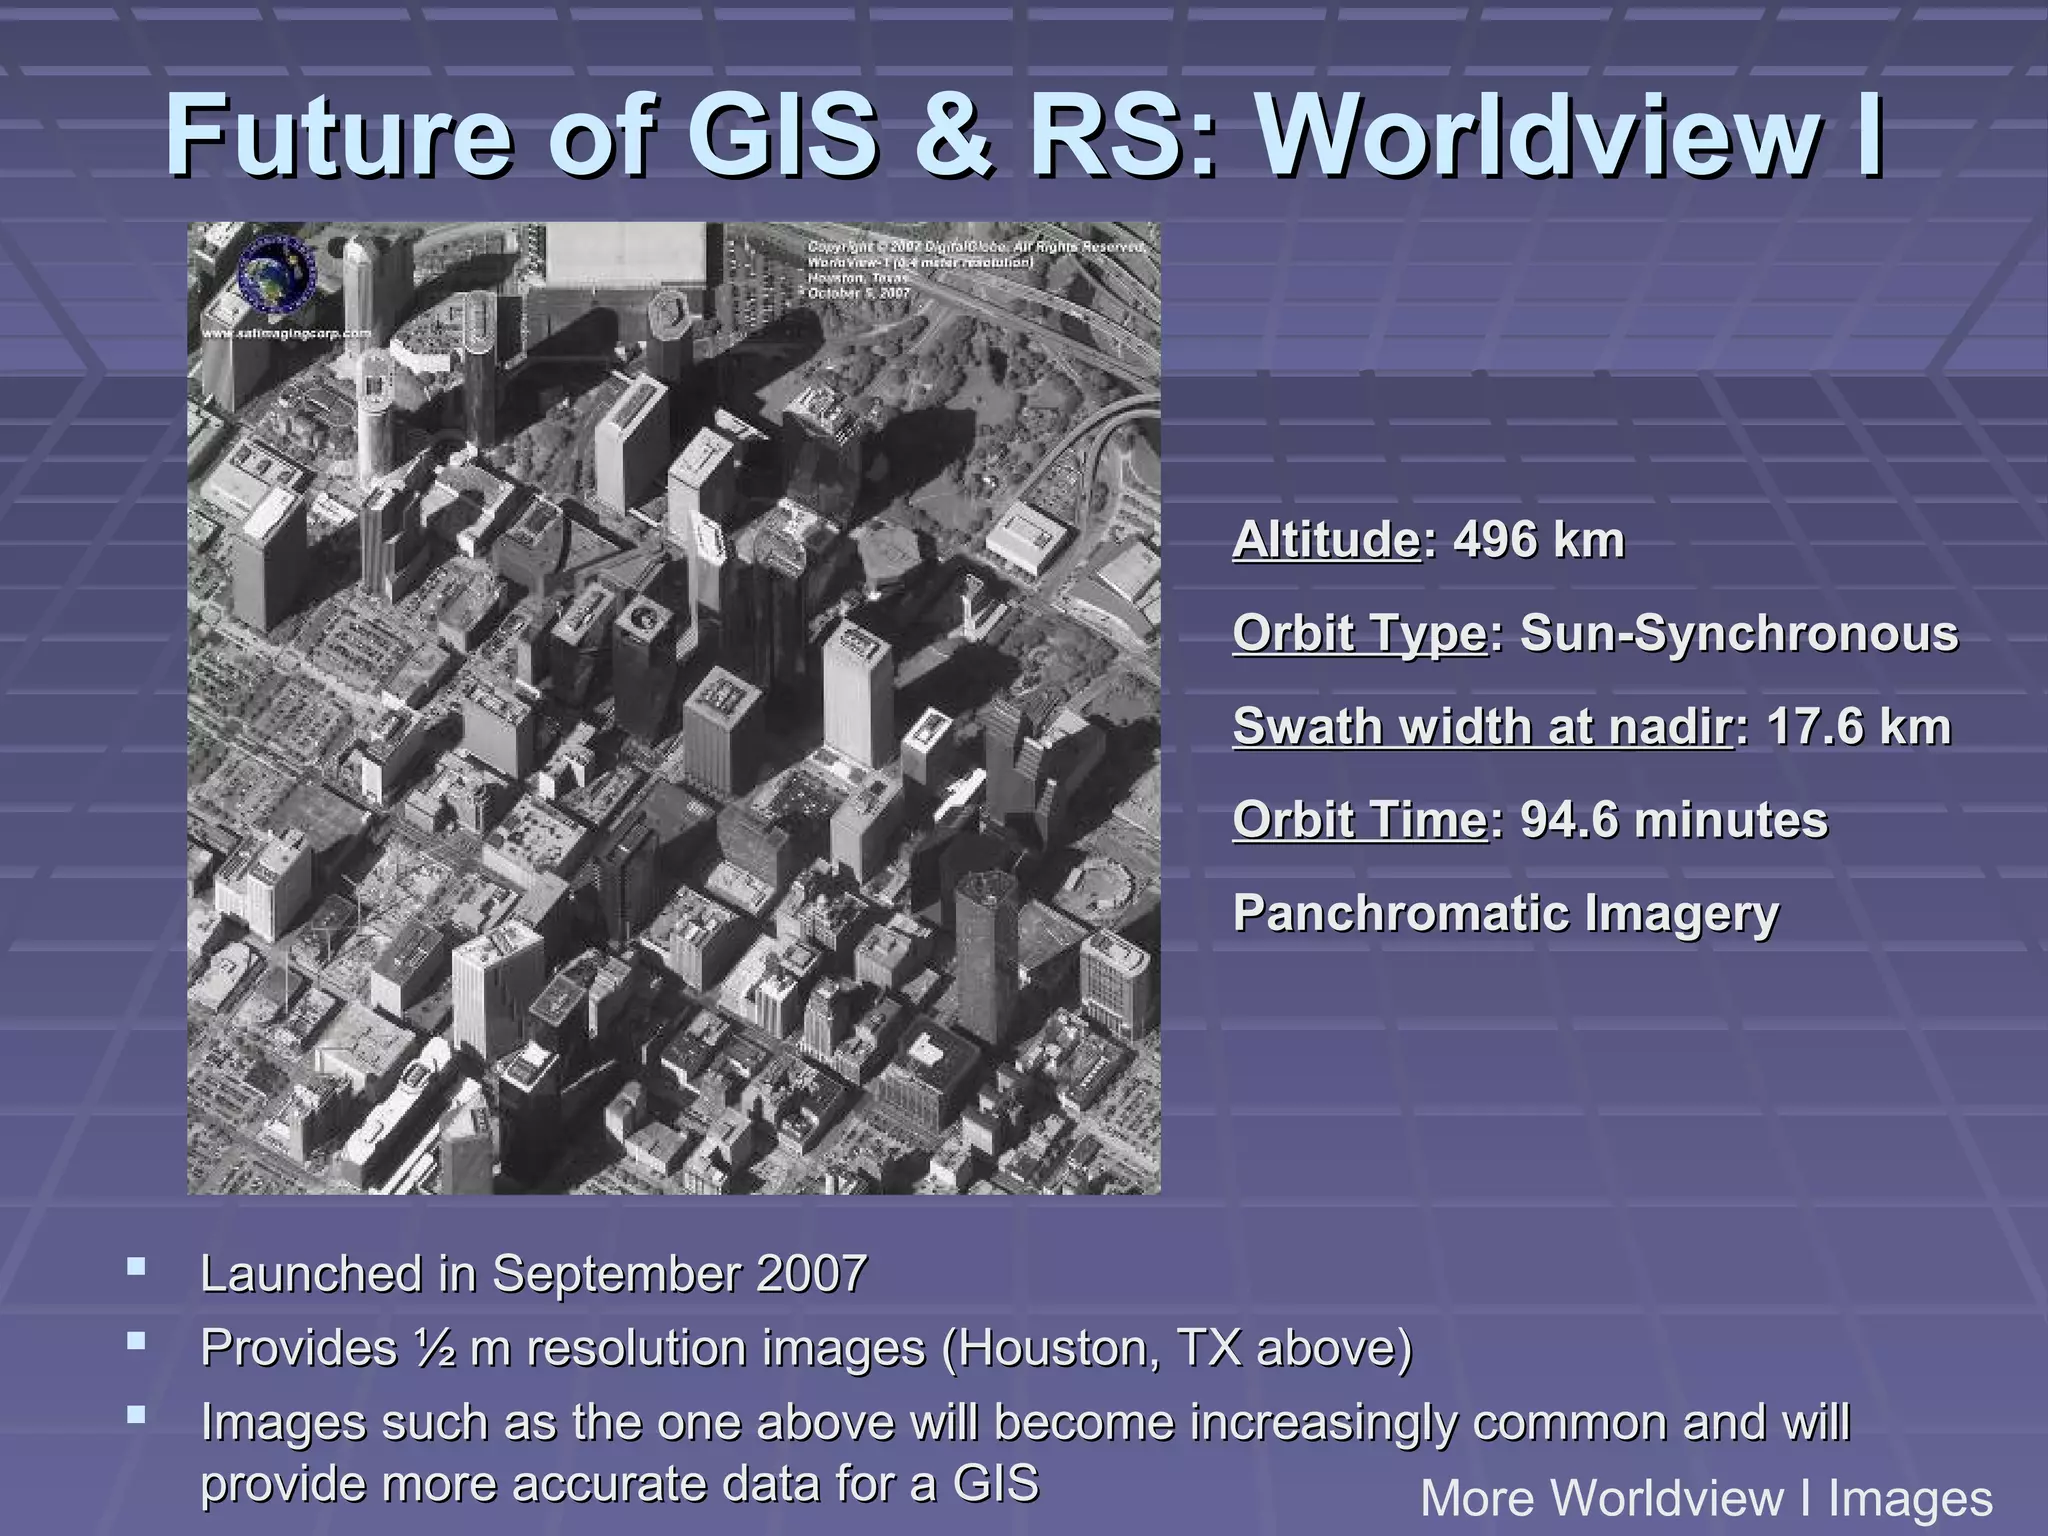
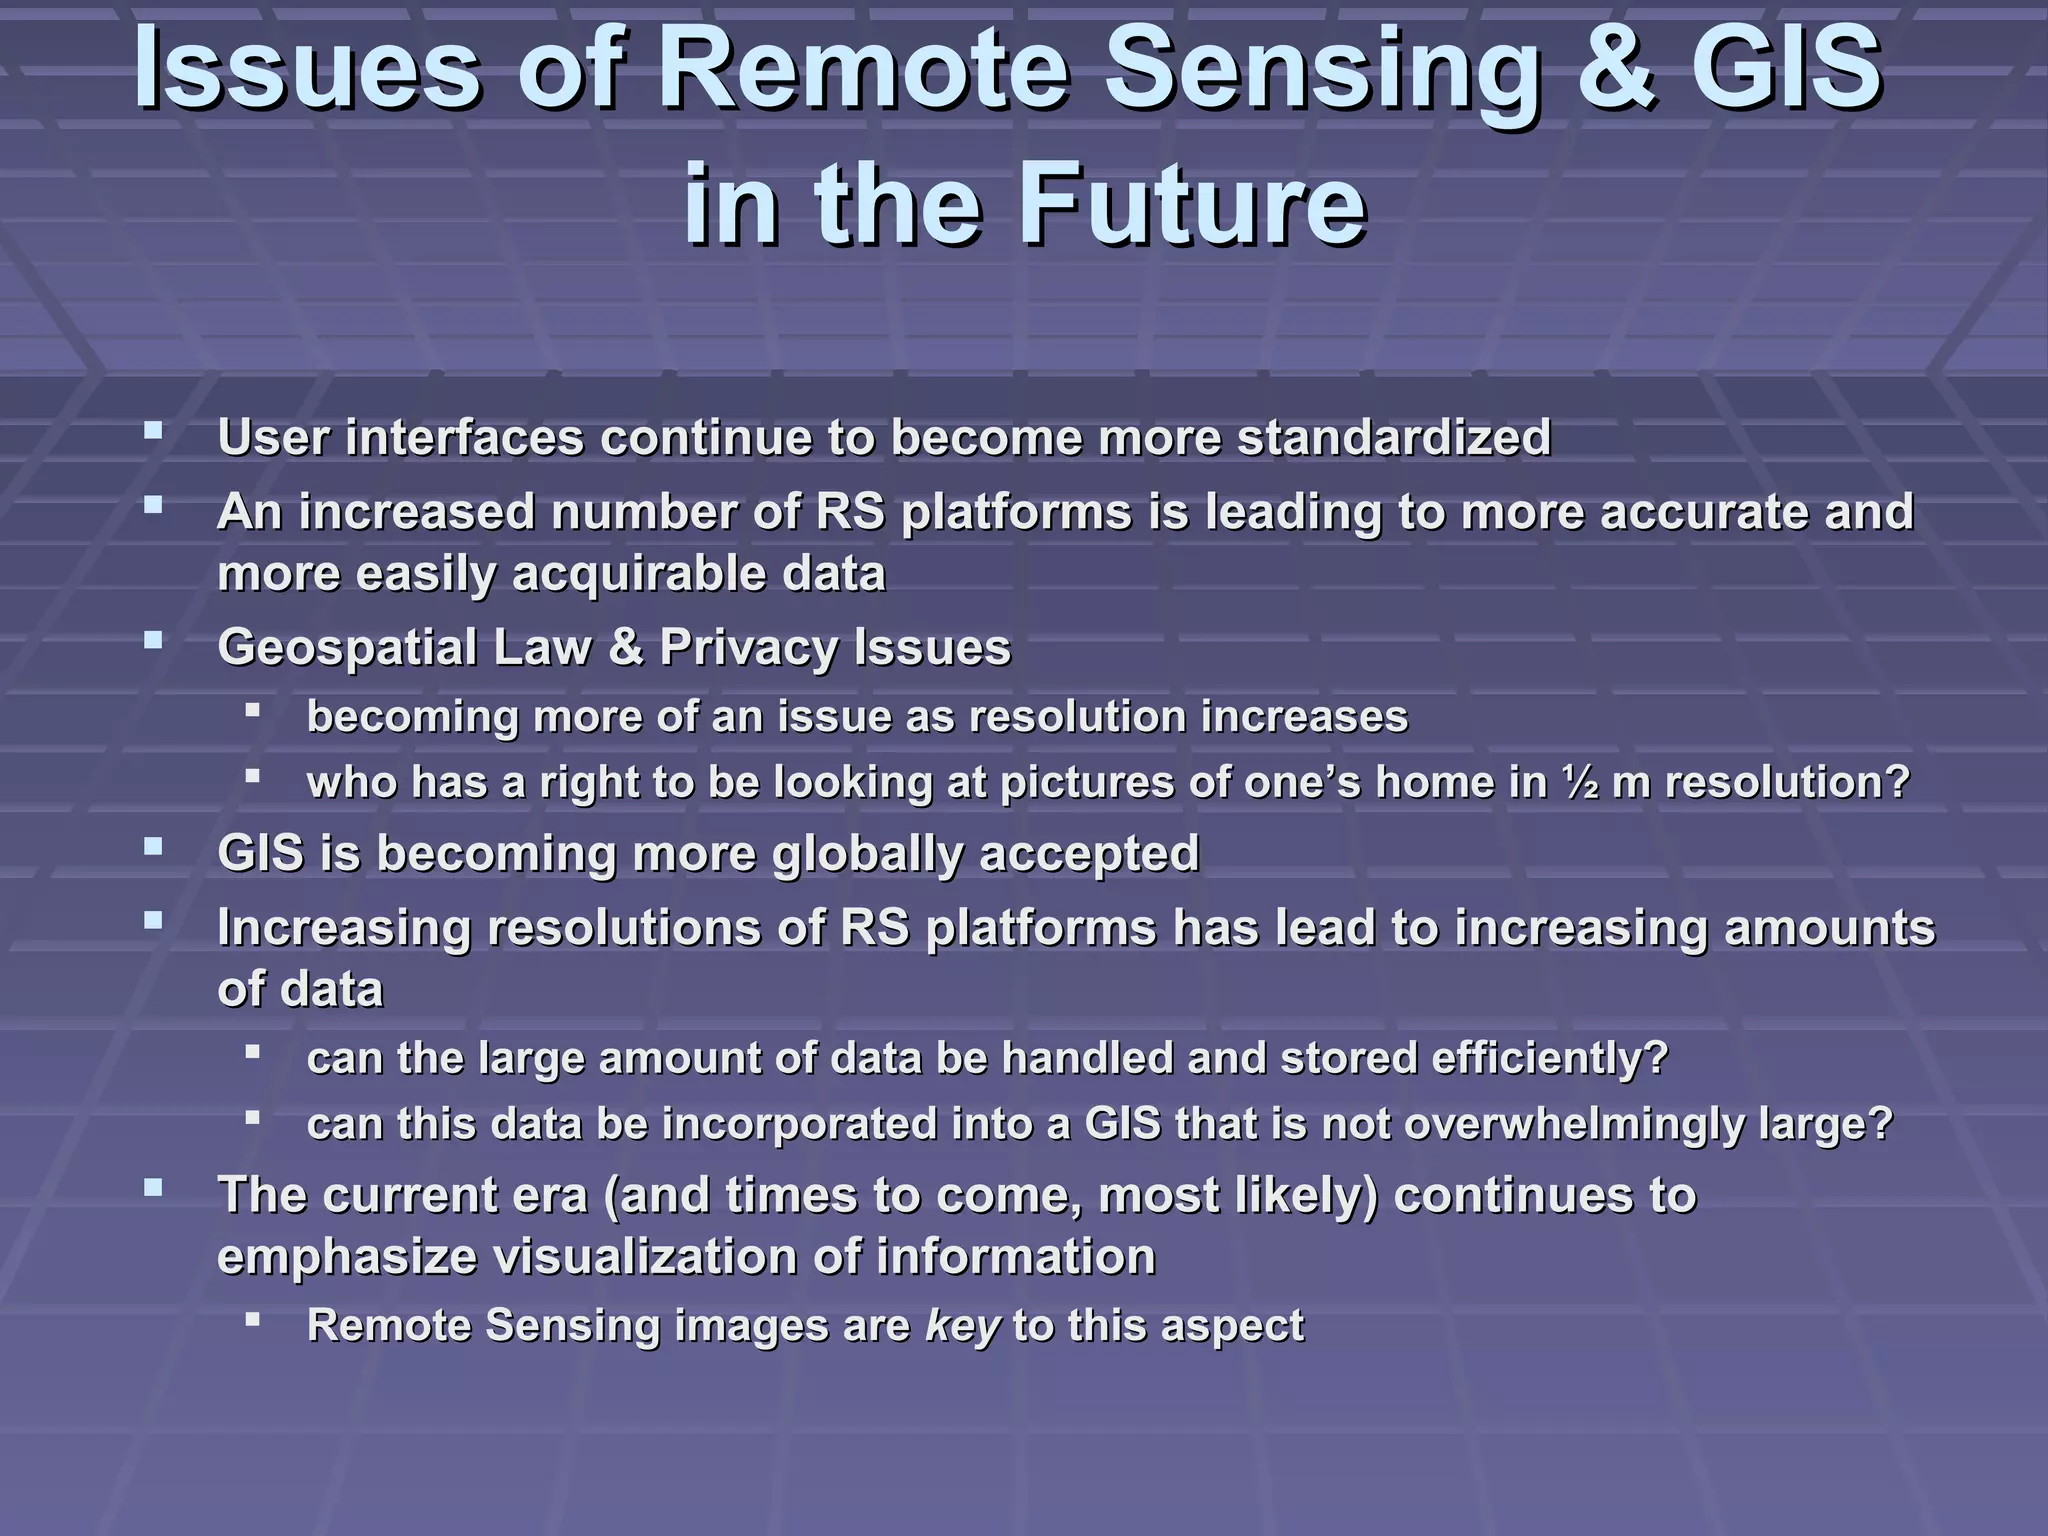
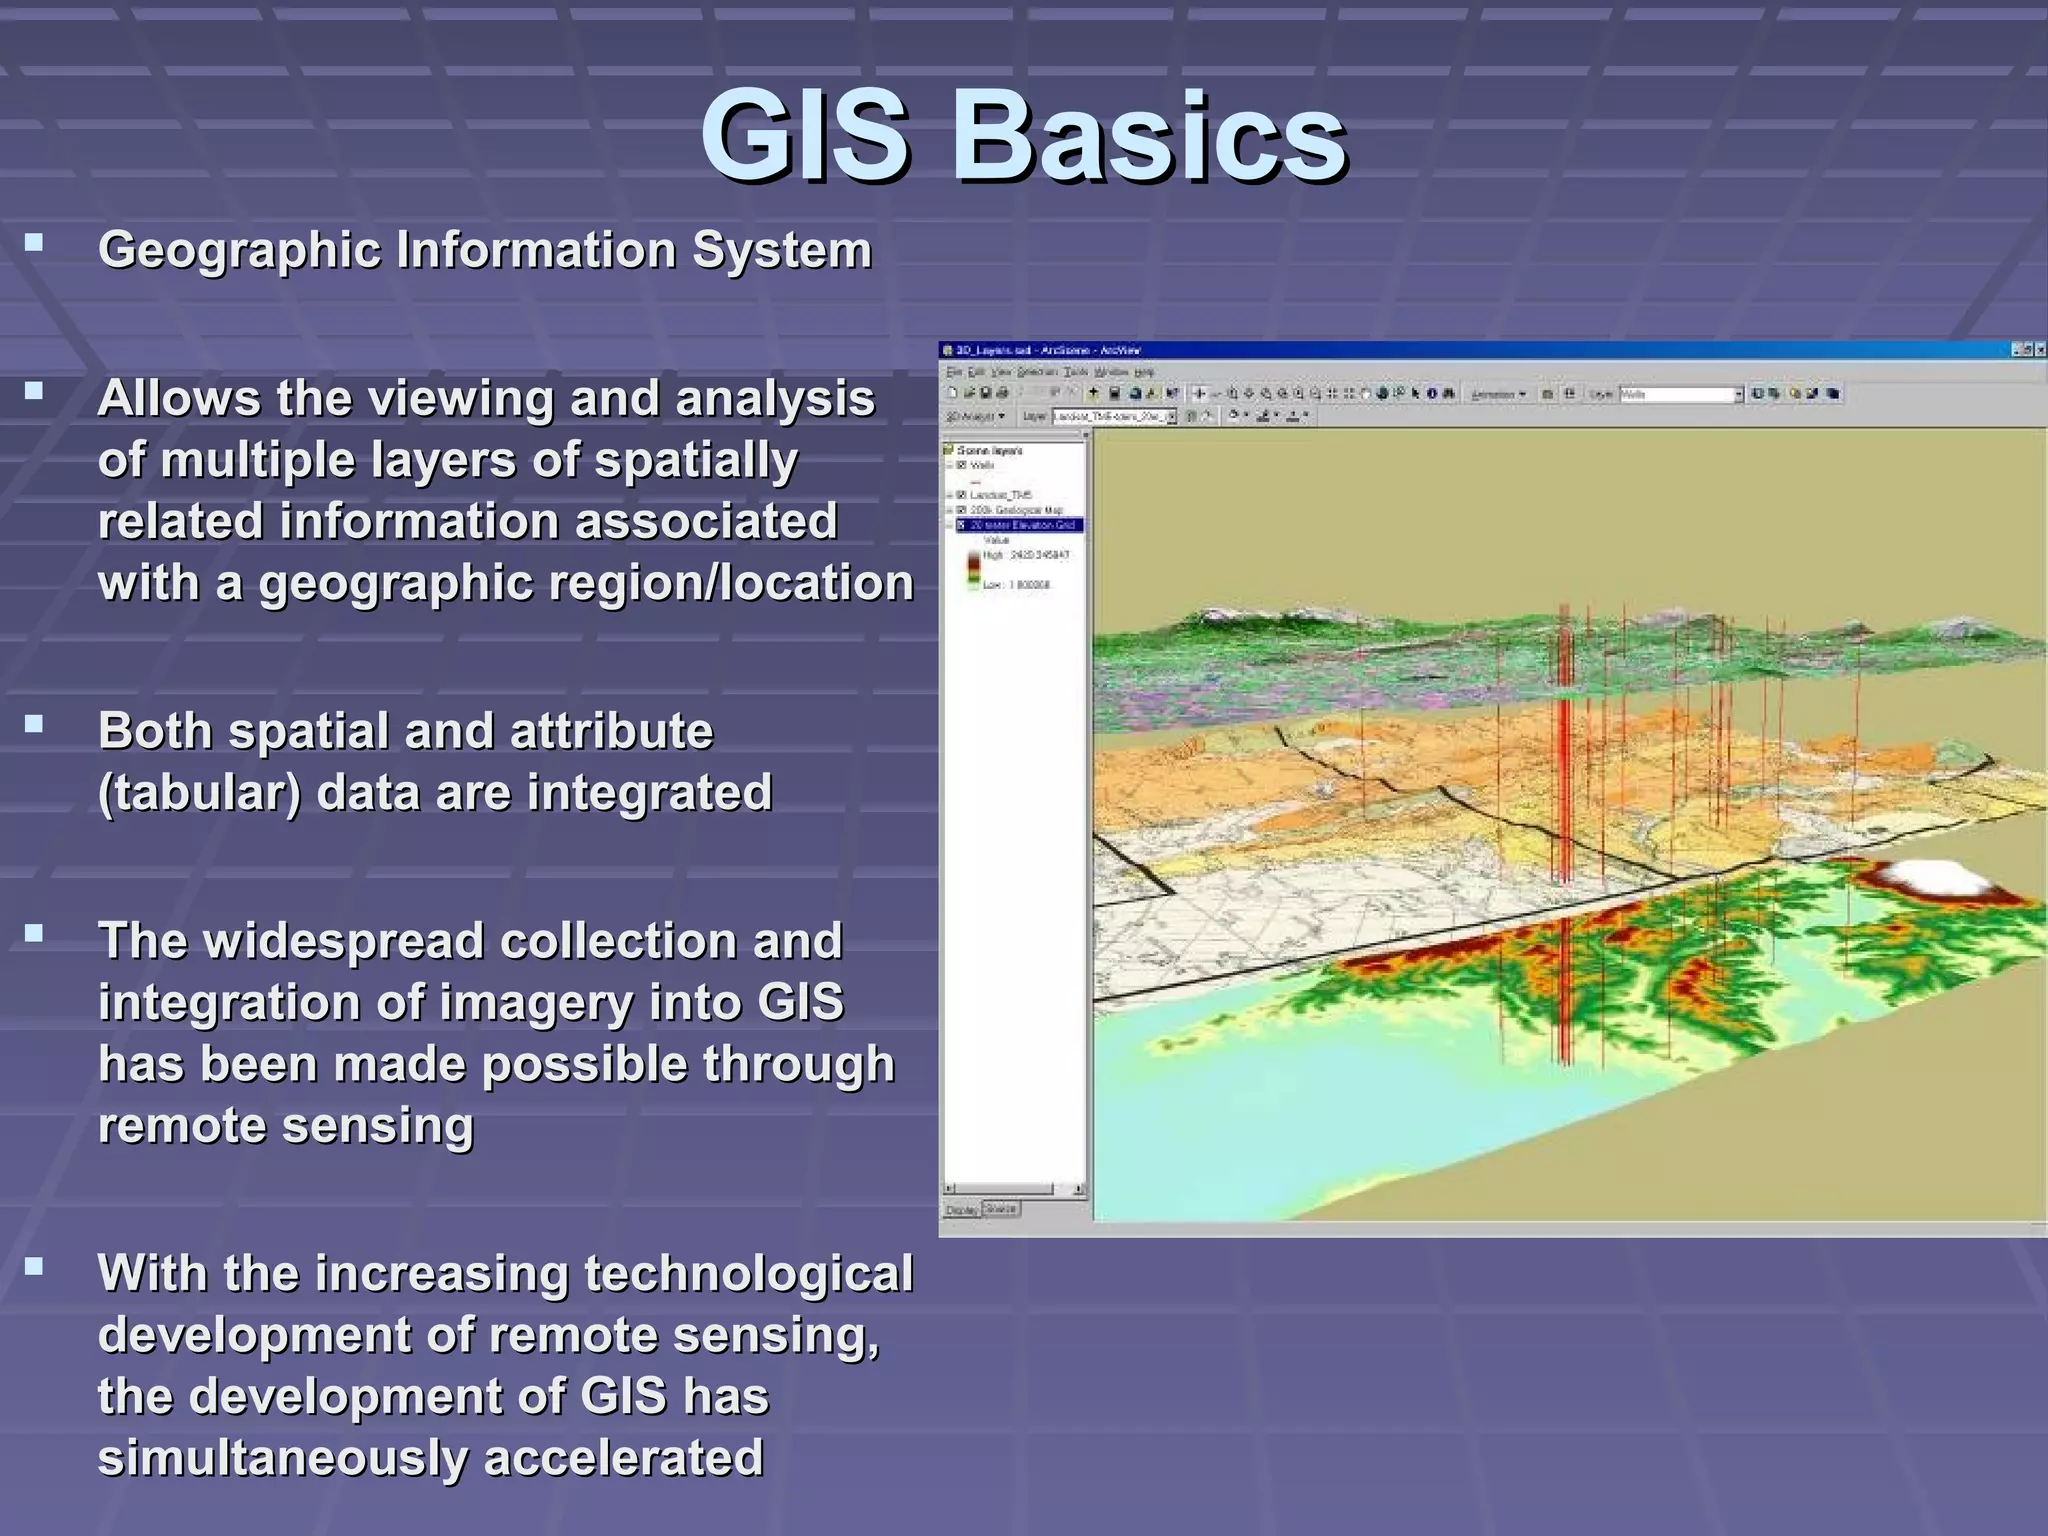
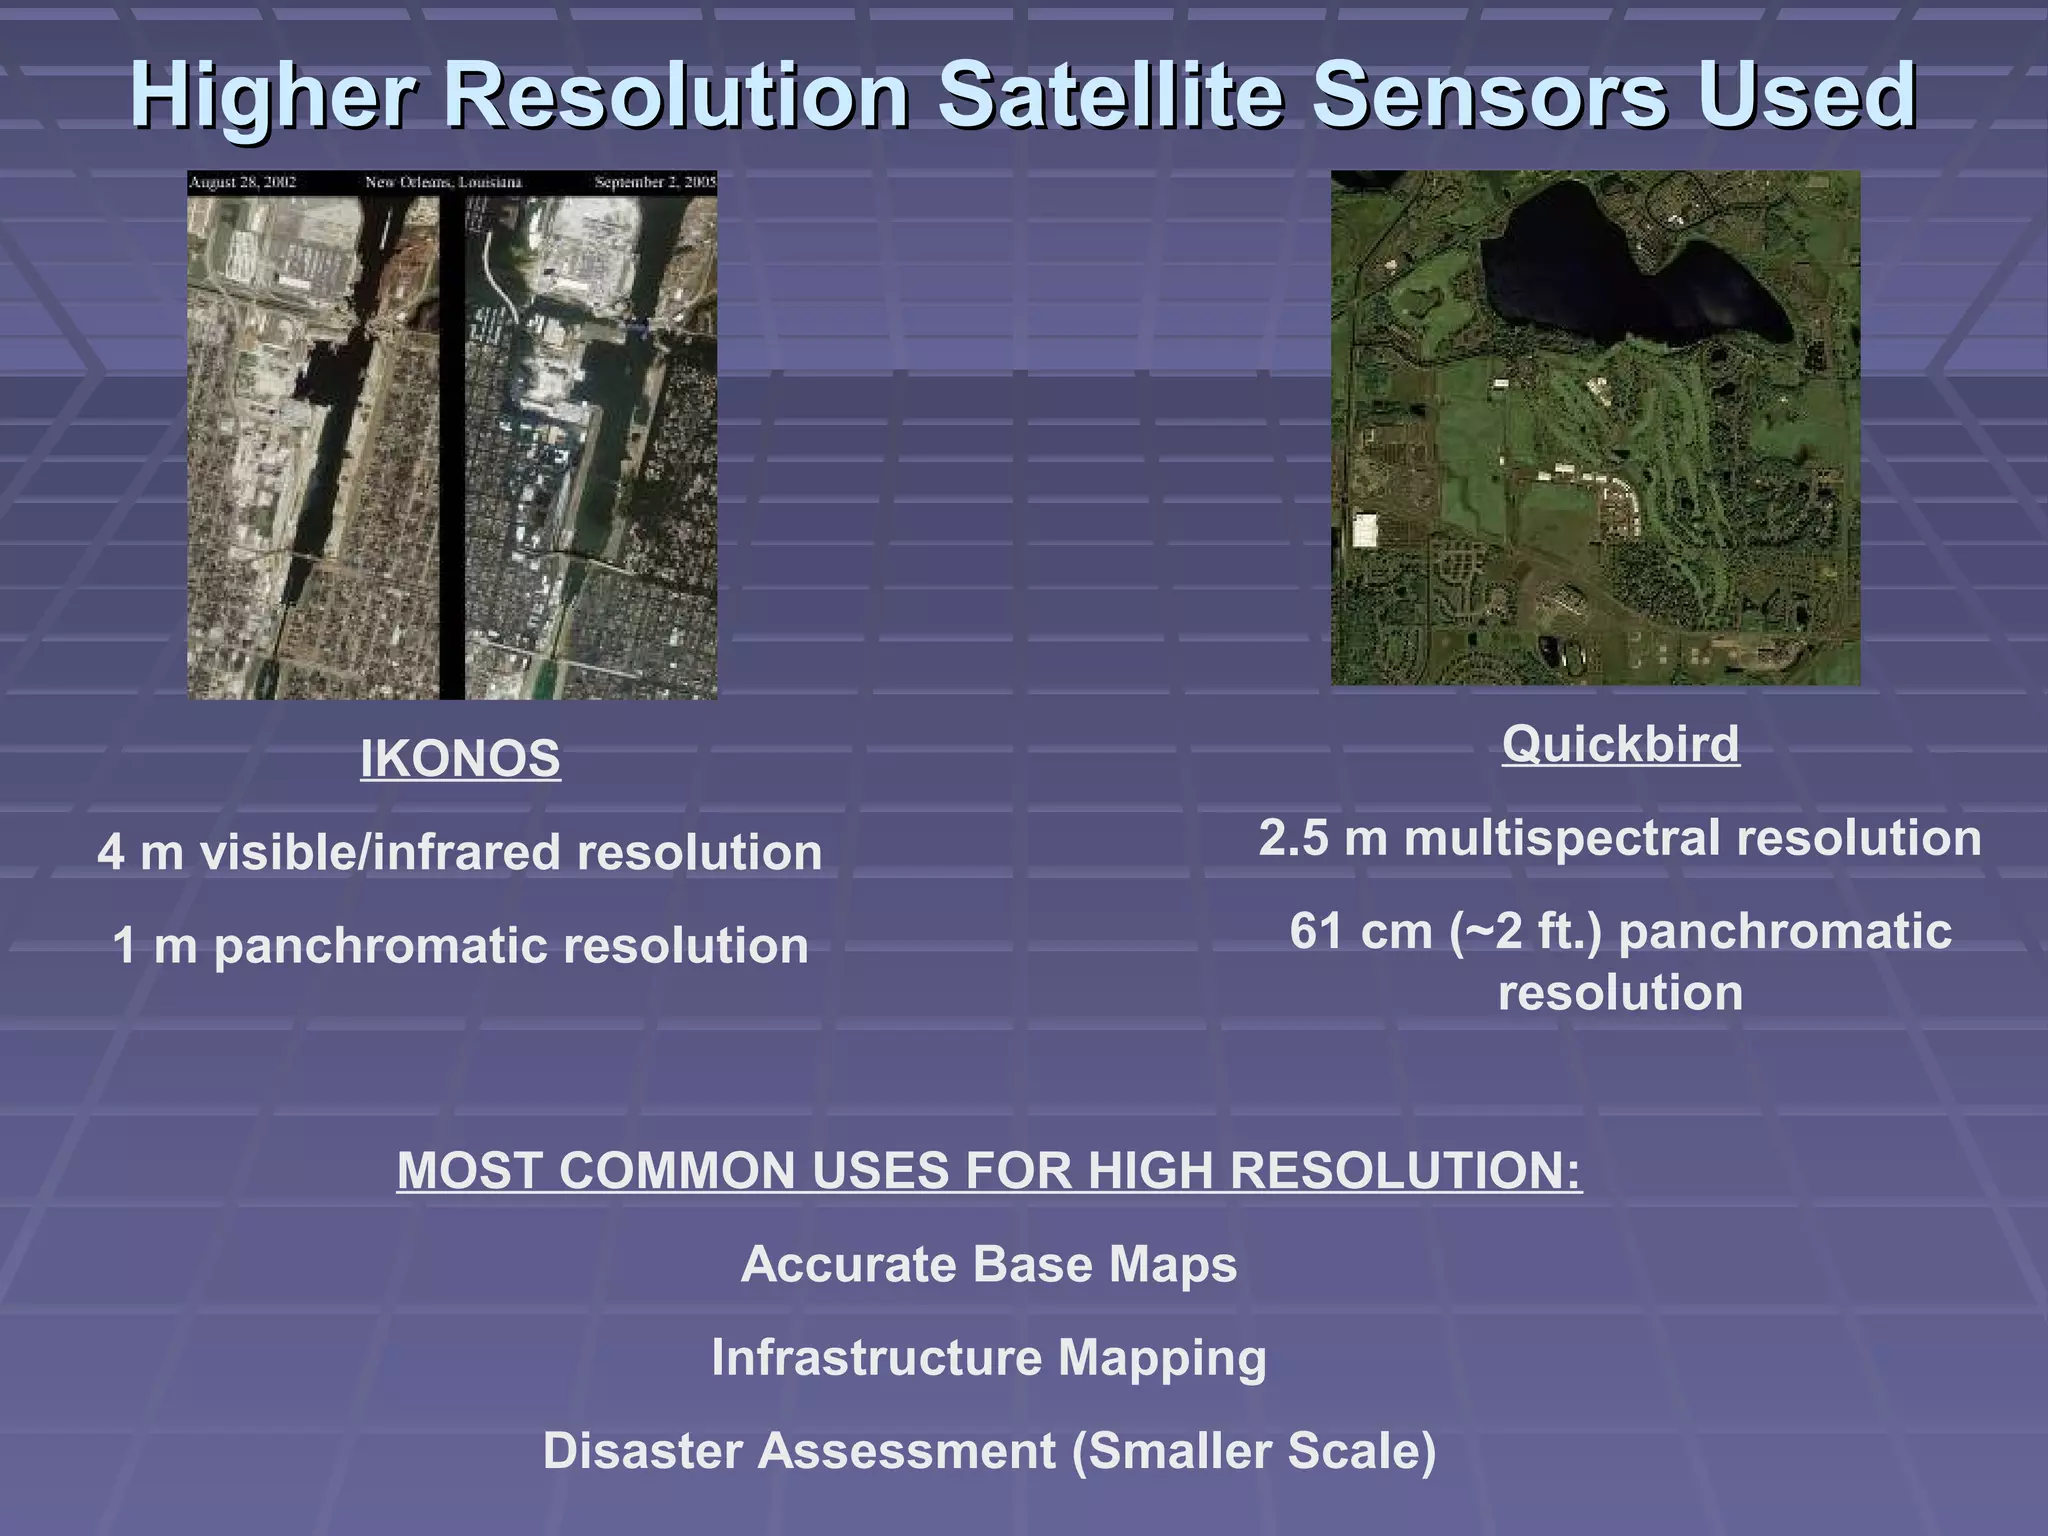
Remote Sensing & GIS


Michael Carmon
Abstract
Geographic Information Systems (GIS) are a new and blossoming concept, and
  continue to grow in complexity and utility thanks in large part to the
  proceeding and continual development of Remote Sensing. Remote
  Sensing plays a large role in the enhancement of any GIS, and in most
  cases, allows data to become much more relatable and useful for anyone. A
  GIS receives much of the data for its built-in layers from Remote Sensing
  platforms such as satellites, radars and airplanes. Passive sensors
  contribute to imagery and data for land cover mapping, change detection,
  snow monitoring, thermal changes and terrain modeling. Active sensors
  contribute heavily to data for extremely accurate terrain models known as
  Digital Elevation Models (DEMs). These large quantities of data can be geo-
  referenced and integrated into one large GIS, allowing a user to access a
  powerful amount of information at one time with relative ease. And as
  remote sensing technology continues to increase in resolution and power,
  the data base will enlarge and increase the potential power of users of a
  Geographic Information System.
Overview
 What is a GIS?

 The Importance of Remote Sensing in
  GIScience

 RS Methods Used in GIS Data Acquisition

 Digital Orthophotos & Satellite Imagery

 Radar Data: DEMs

 The Future of GIS and Remote Sensing
GIS Basics
 Geographic Information System

 Allows the viewing and analysis
   of multiple layers of spatially
   related information associated
   with a geographic region/location

 Both spatial and attribute
   (tabular) data are integrated

 The widespread collection and
   integration of imagery into GIS
   has been made possible through
   remote sensing

 With the increasing technological
   development of remote sensing,
   the development of GIS has
   simultaneously accelerated
The Importance of RS
   Large amounts of data needed, and Remote Sensing can provide it

   Reduces manual field work dramatically

   Allows retrieval of data for regions difficult or impossible to reach:
        Open ocean
        Hazardous terrain (high mountains, extreme weather areas, etc.)
        Ocean depths
        Atmosphere

   Allows for the collection of much more data in a shorter amount of
    time
        Leads to increased land coverage AND
        Increase ground resolution of a GIS

   Digital Imagery greatly enhances a GIS
        DIRECTLY: Imagery can serve as a visual aid
        INDIRECTLY: Can serves as a source to derive information such as…
            Land use/land cover
            Atmospheric emissions
            Vegetation
            Water bodies
            Cloud cover
            Change detection (including sea ice, coastlines, sea levels, etc.)
RS Methods in GIS

 Passive Sensors:
      Landsat TM
      AVHRR
      Spot
      MODIS
      IKONOS
      Quickbird


 Passive Systems: Air Photography (DOs)

 Active Sensors: Radar
    DEMs
Coarser Resolution Satellite Sensors Used


 LANDSAT Thematic Mapper                  MODIS

 Good for regional coverage          36 spectral bands

     30m MS resolution
15 m panchromatic resolution       Most Common Uses:
                                 Cloud/Aerosol Properties

    Most Common Use:                   Ocean Color

Land Cover/Land Use Mapping      Atmospheric Water Vapor
                               Sea/Atmospheric Temperatures
Higher Resolution Satellite Sensors Used


           IKONOS                                          Quickbird

4 m visible/infrared resolution                 2.5 m multispectral resolution

1 m panchromatic resolution                        61 cm (~2 ft.) panchromatic
                                                           resolution


            MOST COMMON USES FOR HIGH RESOLUTION:
                           Accurate Base Maps
                          Infrastructure Mapping
                  Disaster Assessment (Smaller Scale)
How data is extracted:


 Layers such as roads (yellow) and rivers (blue) can be easily seen
  from air/satellite photos
 This information is digitized (see next slide), separated into layers,
  and integrated into a GIS
Digitizing Data
   MANUAL
       Map is fixed to digitizer table
       Control Points are digitized
       Feature Boundaries are digitized in stream or point mode
       The layer is proofed and edited
       The layer is transformed/registered to a known system


   AUTOMATED SCANNERS
       Digitizing done automatically by a scanner
       There is a range of scanner qualities
       Most utilize the reflection/transmission of light to record data
       “Thresholding” allows for the determination of both line and point features from a hardcopy
        map
       Editing still required


   DIRECT DATA ENTRY
       Coordinate Geometry is used, with GPS playing a vital role
       This involves directly entering in coordinates measured in the field
       These coordinates can then be tagged with attribute data
       This data this then downloaded to a computer and incorporated into a GIS
Air Photos: DOs
   An orthophotograph is an aerial photograph that has been corrected to remove distortions
    caused by:
        Camera optics
        Tilt
        Elevation differences

   Digital Conversion (“Registration”)
        Must be converted to digital format before integration into a GIS
        Photograph is split into many pixels
        Distortion at each point must be calculated
        A photograph is considered registered when each pixel has its exact position (geographically) placed
         with the above distortions having been taken into account

   These registered air photos can then be used to extract data or as a base map for a GIS (or
    both)
Radar Data: DEMs
 Active sensors provide the
  most thorough, accurate and
  intricate model of topography
 Radar can reach places nearly
  impossible to survey manually
 Interferometric Synthetic
  Aperture Radar
    Two passes of a radar satellite
     are used
    Any phase difference of
     returned echoes yields
     information about the angle
     from which the echo was
     returned                          h is pixel height and phi is phase
    Allows for topographic            difference:
     information to be derived
                                          2π
                                       φ=    [ Bx sin θ − B y cos θ ]
                                           λ

                                          h = H − ρ (cos θ )
Source: http://www.sco.wisc.edu/maps/digitalelevation.php#GIS


This image was created by overlaying a 1m resolution DO on a
     DEM of the same area (both utilize the same projection)
Applications
 Change Detection
 Disaster Assessment
   Hurricane Katrina & Rita
   2004 Tsunami
 Atmospheric Modeling
   aerosols
   air pollution
   climate change
 Ocean
   topography
   currents
Future of GIS & RS: Worldview I


                                              Altitude: 496 km
                                              Orbit Type: Sun-Synchronous
                                              Swath width at nadir: 17.6 km
                                              Orbit Time: 94.6 minutes
                                              Panchromatic Imagery


   Launched in September 2007
   Provides ½ m resolution images (Houston, TX above)
   Images such as the one above will become increasingly common and will
    provide more accurate data for a GIS               More Worldview I Images
Issues of Remote Sensing & GIS
          in the Future
 User interfaces continue to become more standardized
 An increased number of RS platforms is leading to more accurate and
  more easily acquirable data
 Geospatial Law & Privacy Issues
     becoming more of an issue as resolution increases
     who has a right to be looking at pictures of one’s home in ½ m resolution?
 GIS is becoming more globally accepted
 Increasing resolutions of RS platforms has lead to increasing amounts
   of data
     can the large amount of data be handled and stored efficiently?
     can this data be incorporated into a GIS that is not overwhelmingly large?
 The current era (and times to come, most likely) continues to
   emphasize visualization of information
     Remote Sensing images are key to this aspect
Sources
 Allen, C. “An Interferometric Technique for Synthetic
    Aperture Ground-Penetrating Radar.” Geoscience and
    Remote Sensing Symposium. 4 (1996): 2033-2035.
   Bolstad, Paul. Fundamentals of GIS, 2nd ed. Atlas Books,
    2005.
   Environmental Systems Research Institute (ESRI):
    http://www.esri.com
   Lillesand, Thomas M., Ralph W. Kiefer and Jonathan W.
    Chipman. Remote Sensing and Image Interpretation, 5th
    ed. Wiley, New York, 2004.
   NASA: http://www.nasa.gov
   http://www.ccrs.nrcan.gc.ca/glossary/index_e.php?
    id=3054
   Sattellite Imaging Corps: http://www.satimagingcorp.com
   United States Geological Survey: http://www.usgs.gov

Carmon remote sensinggis

  • 1.
    Remote Sensing &GIS Michael Carmon
  • 2.
    Abstract Geographic Information Systems(GIS) are a new and blossoming concept, and continue to grow in complexity and utility thanks in large part to the proceeding and continual development of Remote Sensing. Remote Sensing plays a large role in the enhancement of any GIS, and in most cases, allows data to become much more relatable and useful for anyone. A GIS receives much of the data for its built-in layers from Remote Sensing platforms such as satellites, radars and airplanes. Passive sensors contribute to imagery and data for land cover mapping, change detection, snow monitoring, thermal changes and terrain modeling. Active sensors contribute heavily to data for extremely accurate terrain models known as Digital Elevation Models (DEMs). These large quantities of data can be geo- referenced and integrated into one large GIS, allowing a user to access a powerful amount of information at one time with relative ease. And as remote sensing technology continues to increase in resolution and power, the data base will enlarge and increase the potential power of users of a Geographic Information System.
  • 3.
    Overview  What isa GIS?  The Importance of Remote Sensing in GIScience  RS Methods Used in GIS Data Acquisition  Digital Orthophotos & Satellite Imagery  Radar Data: DEMs  The Future of GIS and Remote Sensing
  • 4.
    GIS Basics  GeographicInformation System  Allows the viewing and analysis of multiple layers of spatially related information associated with a geographic region/location  Both spatial and attribute (tabular) data are integrated  The widespread collection and integration of imagery into GIS has been made possible through remote sensing  With the increasing technological development of remote sensing, the development of GIS has simultaneously accelerated
  • 5.
    The Importance ofRS  Large amounts of data needed, and Remote Sensing can provide it  Reduces manual field work dramatically  Allows retrieval of data for regions difficult or impossible to reach:  Open ocean  Hazardous terrain (high mountains, extreme weather areas, etc.)  Ocean depths  Atmosphere  Allows for the collection of much more data in a shorter amount of time  Leads to increased land coverage AND  Increase ground resolution of a GIS  Digital Imagery greatly enhances a GIS  DIRECTLY: Imagery can serve as a visual aid  INDIRECTLY: Can serves as a source to derive information such as…  Land use/land cover  Atmospheric emissions  Vegetation  Water bodies  Cloud cover  Change detection (including sea ice, coastlines, sea levels, etc.)
  • 6.
    RS Methods inGIS  Passive Sensors:  Landsat TM  AVHRR  Spot  MODIS  IKONOS  Quickbird  Passive Systems: Air Photography (DOs)  Active Sensors: Radar  DEMs
  • 7.
    Coarser Resolution SatelliteSensors Used LANDSAT Thematic Mapper MODIS Good for regional coverage 36 spectral bands 30m MS resolution 15 m panchromatic resolution Most Common Uses: Cloud/Aerosol Properties Most Common Use: Ocean Color Land Cover/Land Use Mapping Atmospheric Water Vapor Sea/Atmospheric Temperatures
  • 8.
    Higher Resolution SatelliteSensors Used IKONOS Quickbird 4 m visible/infrared resolution 2.5 m multispectral resolution 1 m panchromatic resolution 61 cm (~2 ft.) panchromatic resolution MOST COMMON USES FOR HIGH RESOLUTION: Accurate Base Maps Infrastructure Mapping Disaster Assessment (Smaller Scale)
  • 9.
    How data isextracted:  Layers such as roads (yellow) and rivers (blue) can be easily seen from air/satellite photos  This information is digitized (see next slide), separated into layers, and integrated into a GIS
  • 10.
    Digitizing Data  MANUAL  Map is fixed to digitizer table  Control Points are digitized  Feature Boundaries are digitized in stream or point mode  The layer is proofed and edited  The layer is transformed/registered to a known system  AUTOMATED SCANNERS  Digitizing done automatically by a scanner  There is a range of scanner qualities  Most utilize the reflection/transmission of light to record data  “Thresholding” allows for the determination of both line and point features from a hardcopy map  Editing still required  DIRECT DATA ENTRY  Coordinate Geometry is used, with GPS playing a vital role  This involves directly entering in coordinates measured in the field  These coordinates can then be tagged with attribute data  This data this then downloaded to a computer and incorporated into a GIS
  • 11.
    Air Photos: DOs  An orthophotograph is an aerial photograph that has been corrected to remove distortions caused by:  Camera optics  Tilt  Elevation differences  Digital Conversion (“Registration”)  Must be converted to digital format before integration into a GIS  Photograph is split into many pixels  Distortion at each point must be calculated  A photograph is considered registered when each pixel has its exact position (geographically) placed with the above distortions having been taken into account  These registered air photos can then be used to extract data or as a base map for a GIS (or both)
  • 12.
    Radar Data: DEMs Active sensors provide the most thorough, accurate and intricate model of topography  Radar can reach places nearly impossible to survey manually  Interferometric Synthetic Aperture Radar  Two passes of a radar satellite are used  Any phase difference of returned echoes yields information about the angle from which the echo was returned h is pixel height and phi is phase  Allows for topographic difference: information to be derived 2π φ= [ Bx sin θ − B y cos θ ] λ h = H − ρ (cos θ )
  • 13.
    Source: http://www.sco.wisc.edu/maps/digitalelevation.php#GIS This imagewas created by overlaying a 1m resolution DO on a DEM of the same area (both utilize the same projection)
  • 14.
    Applications  Change Detection Disaster Assessment  Hurricane Katrina & Rita  2004 Tsunami  Atmospheric Modeling  aerosols  air pollution  climate change  Ocean  topography  currents
  • 15.
    Future of GIS& RS: Worldview I Altitude: 496 km Orbit Type: Sun-Synchronous Swath width at nadir: 17.6 km Orbit Time: 94.6 minutes Panchromatic Imagery  Launched in September 2007  Provides ½ m resolution images (Houston, TX above)  Images such as the one above will become increasingly common and will provide more accurate data for a GIS More Worldview I Images
  • 16.
    Issues of RemoteSensing & GIS in the Future  User interfaces continue to become more standardized  An increased number of RS platforms is leading to more accurate and more easily acquirable data  Geospatial Law & Privacy Issues  becoming more of an issue as resolution increases  who has a right to be looking at pictures of one’s home in ½ m resolution?  GIS is becoming more globally accepted  Increasing resolutions of RS platforms has lead to increasing amounts of data  can the large amount of data be handled and stored efficiently?  can this data be incorporated into a GIS that is not overwhelmingly large?  The current era (and times to come, most likely) continues to emphasize visualization of information  Remote Sensing images are key to this aspect
  • 17.
    Sources  Allen, C.“An Interferometric Technique for Synthetic Aperture Ground-Penetrating Radar.” Geoscience and Remote Sensing Symposium. 4 (1996): 2033-2035.  Bolstad, Paul. Fundamentals of GIS, 2nd ed. Atlas Books, 2005.  Environmental Systems Research Institute (ESRI): http://www.esri.com  Lillesand, Thomas M., Ralph W. Kiefer and Jonathan W. Chipman. Remote Sensing and Image Interpretation, 5th ed. Wiley, New York, 2004.  NASA: http://www.nasa.gov  http://www.ccrs.nrcan.gc.ca/glossary/index_e.php? id=3054  Sattellite Imaging Corps: http://www.satimagingcorp.com  United States Geological Survey: http://www.usgs.gov