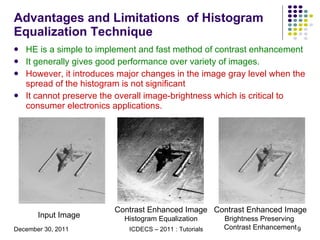
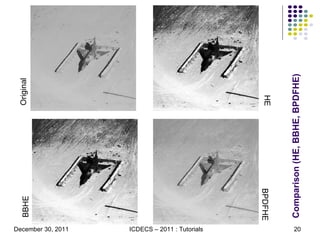
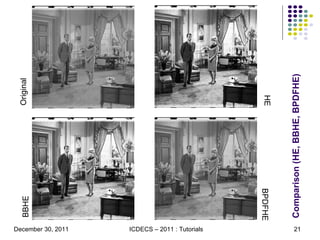
The document discusses techniques for contrast enhancement of digital images through histogram processing. It describes histogram equalization, which increases contrast by spreading out the most frequent intensity values. Limitations include changes to image brightness. Bi-histogram and multi-histogram equalization partition histograms to minimize brightness changes. Brightness preserving dynamic fuzzy histogram equalization further improves brightness preservation through fuzzy histogram computation, dynamic equalization of histogram partitions, and normalization of image brightness. It provides objective metrics to evaluate contrast enhancement and brightness preservation capabilities of these techniques.
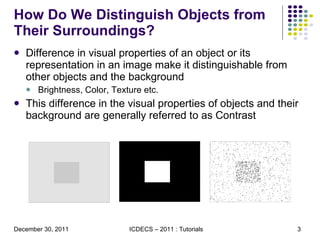
![Histogram Processing for Contrast Enhancement In a poorly contrasted image a large number of pixels occupy only a small portion of the available range of intensities. Through histogram modification we reassign each pixel with a new intensity value so that the dynamic range of gray levels is increased. Common histogram modification techniques [1] Histogram Equalization (HE) Modifications: Locally Adaptive Histogram Equalization, Bi-histogram Equalization and Multi-histogram Equalization Histogram Specification Histogram Hyperbolization](https://image.slidesharecdn.com/icdecs2011-13254190092261-phpapp01-120101060104-phpapp01/85/Icdecs-2011-5-320.jpg)
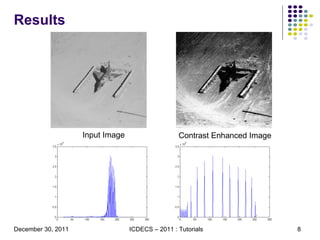
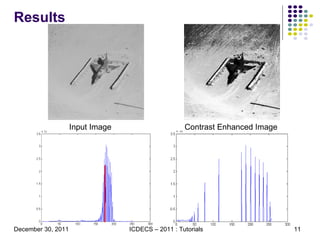
![Histogram Equalization [1] Histogram equalization (HE) is a technique of adjusting the gray scale of the image such that the gray level histogram of the input image is mapped into a uniform histogram. The assumption here is that the information conveyed by an image is related to the probability of occurrence of gray levels in the image. Procedure: Consider a grayscale image with dimensions MxN Compute histogram H for the gray scales. Where value H(i) represents the frequency of occurrence of the i th gray level in the image. Compute cumulative frequency H cf (i) of the histogram. Then the equalized histogram EqH is obtained as Here the EqH contains the new mapping of gray values . In the input image replace the each gray value i, by EqH(i) to obtain the equalized image.](https://image.slidesharecdn.com/icdecs2011-13254190092261-phpapp01-120101060104-phpapp01/85/Icdecs-2011-7-320.jpg)
![Bi-histogram Equalization[2] Bi-histogram equalization techniques partition histograms in two sub-histograms and equalize them independently. These techniques have been proposed to minimize the change in mean image brightness aftre histogram equalization Several image parameters such as median, mean gray level or some sort of automatically selected grayscale threshold are used to partitioning of the histogram. Procedure: Compute histogram H for the gray scales. Where value H(i) represents the frequency of occurrence of the i th gray level in the image. Split the histogram in to two sub-histograms Equalize the two sub-histograms independently . Let EqH contain the new mapping of gray values obtained after equalization. In the input image replace the each gray value i, by EqH(i) to obtain the equalized image.](https://image.slidesharecdn.com/icdecs2011-13254190092261-phpapp01-120101060104-phpapp01/85/Icdecs-2011-10-320.jpg)
![Multi-histogram Equalization [7] Multi-histogram equalization techniques partition histograms in multiple sub-histograms and equalize them independently. These techniques have been proposed to further improve the mean image brightness preserving capabilities of the aftre histogram equalization Several histogram features as local peak or valley points act as markers for partitioning of the histogram. Thus valley portions between two consecutive peaks or peaks between two consecutive valley point form the sub-histograms for equalization Procedure: Compute histogram H for the gray scales. Where value H(i) represents the frequency of occurrence of the i th gray level in the image. Split the histogram in to multiple sub-histograms Equalize the each sub-histogram independently . Let EqH contain the new mapping of gray values obtained after equalization. In the input image replace the each gray value i, by EqH(i) to obtain the equalized image.](https://image.slidesharecdn.com/icdecs2011-13254190092261-phpapp01-120101060104-phpapp01/85/Icdecs-2011-12-320.jpg)
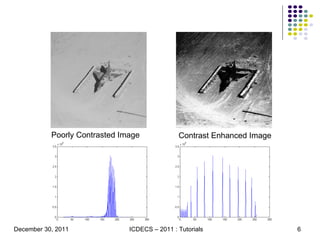
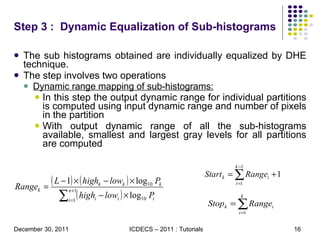
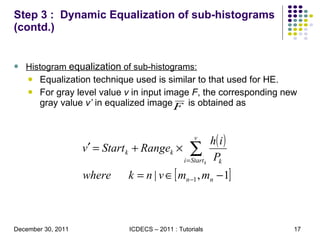
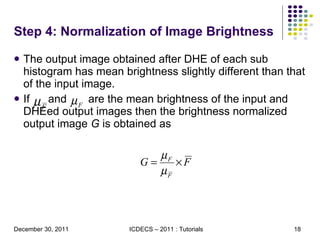
![Brightness Preserving Dynamic Fuzzy Histogram Equalization[10] The BPDFHE technique as shown in Fig 2 comprises of four functional steps Fuzzy histogram computation with a suitable membership function Partitioning of the histogram to create sub-histograms, each comprising of a valley portion between two consecutive histogram peaks Dynamic equalization of the histogram partitions Normalization of image brightness to match mean image brightness of input and output images The detailed description of each of the functional steps is given further in the presentation. Fuzzy Histogram Computation Partitioning of the Histogram Dynamic Equalization of the Histogram Partitions Normalization of Image Brightness Low Contrast Image Contrast Enhanced Image BPDFHE Stages](https://image.slidesharecdn.com/icdecs2011-13254190092261-phpapp01-120101060104-phpapp01/85/Icdecs-2011-13-320.jpg)
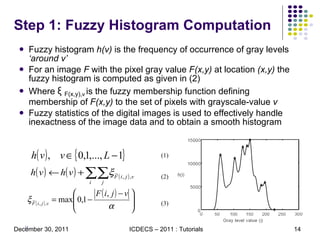
![Step 2: Histogram Partitioning The fuzzy histogram now obtained is partitioned to obtain sub histograms which are to be dynamically equalized The histogram partitioning involves two steps Local maxima detection: located using the first and second order derivatives of the histogram Creating partitions: Each valley portion between two consecutive local maxima is considered as a partition. Let {m 1 , m 2 , ··· m n } be the n local maxima points detected. Then for a histogram with spread [F min , F max ] the n+1 sub-histograms obtained after partitioning are { [F min ,, m 1 ], [m 1 , m 2 ], ··· [m n ,F max ] }](https://image.slidesharecdn.com/icdecs2011-13254190092261-phpapp01-120101060104-phpapp01/85/Icdecs-2011-15-320.jpg)
![This is the measure of closeness of mean luminance of two images being compared. For the pair of reference image F and enhanced image G, having the mean brightness μ F and μ G respectively, the LD measure Q is given below. Here LD measure Q image is computed as a mean of local LD values Q(x,y) computed at every pixel 7x7 location considering the neighborhood surrounding it . Luminance Distortion[11] (9) (10) TABLE I: LUMINANCE DISTORTION * More results available in [10] and [13] 0.9950 --- 0.9199 5.2.08 BPDFHE BBHE HE Image ID](https://image.slidesharecdn.com/icdecs2011-13254190092261-phpapp01-120101060104-phpapp01/85/Icdecs-2011-23-320.jpg)
![Contrast from Fuzzy- GLCM [12] This measure evaluates the local contrast in image. Fuzzy co-occurrence matrix on image is determined with pyramidal membership function By averaging four symmetrical co-occurrence matrices computed with different values of θ , we compute rotational invariant FGLCM ( M’ ) The rotational invariant FGLCM ( M’ ) is normalized ( M’ norm ) and contrast is determined . TABLE II: CONTRAST FROM FUZZY CO -OCCURRENCE MATRIX * * More results available in [10] and [13] 301.0 Original 348.9 --- 888.6 5.2.08 BPDFHE BBHE HE Image ID](https://image.slidesharecdn.com/icdecs2011-13254190092261-phpapp01-120101060104-phpapp01/85/Icdecs-2011-24-320.jpg)
![Brightness Preserving Contrast Enhancement in Color Images [13] The brightness preserving contrast enhancement process uses Brightness Preserving Dynamic Fuzzy Histogram Equalization for contrast enhancement Images are processed in CIE L*a*b* color space where contrast enhancement is performed on the L* channel while keeping chroma information unaltered The BPDFHE technique manipulates image histogram to redistribute gray-level values in the valley portions between two consecutive histogram peaks and keep histogram peaks unaffected Color Space Conversion (RGB to CIEL*a*b*) Contrast Enhancement in L* Channel Color Space Conversion (CIEL*a*b* to RGB) Contrast Enhanced Color Image Low Contrast Color Image](https://image.slidesharecdn.com/icdecs2011-13254190092261-phpapp01-120101060104-phpapp01/85/Icdecs-2011-25-320.jpg)
![Some State of the Art Bi-histogram Equalization Techniques: Contrast Enhancement Using Brightness Preserving Bi-Histogram Equalization[2] Minimum Mean Brightness Error Bi-Histogram Equalization in Contrast Enhancement[3] Image Enhancement Based On Equal Area Dualistic Sub-Image Histogram Equalization Method[4] Contrast enhancement using recursive MeanSeparate histogram equalization for scalable brightness preservation[5] Multi-histogram Equalization Techniques Multi-Histogram Equalization Methods for Contrast Enhancement and Brightness Preserving[6] A Dynamic Histogram Equalization for Image Contrast Enhancement[7] Brightness Preserving Dynamic Histogram Equalization for Image Contrast Enhancement[8] Brightness Preserving Histogram Equalization with Maximum Entropy: A Variational Perspective[9] Brightness Preserving Dynamic Fuzzy Histogram Equalization[10]](https://image.slidesharecdn.com/icdecs2011-13254190092261-phpapp01-120101060104-phpapp01/85/Icdecs-2011-27-320.jpg)
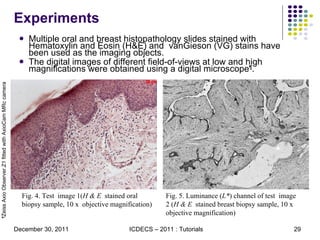
![Application of Brightness Preserving Contrast Enhancement Techniques Digital Pathology[12] Digital pathology is an image-based environment that enables acquisition, management and interpretation of the information generated from a digitized glass slide. Brightfield microscopy , commonly used in pathological investigations produces low contrast images for most biological samples as few absorb light to a large extent. Thus, tissue staining is used for introduction of contrast. Nevertheless a majority of the images in digital pathology require adjustments to optimize brightness, contrast, and image visibility. Here we present study on application of Brightness Preserving Dynamic Fuzzy Histogram Equalization (BPDFHE) technique in digital pathology to achieve balance between two important attributes of the image quality contrast and image brightness.](https://image.slidesharecdn.com/icdecs2011-13254190092261-phpapp01-120101060104-phpapp01/85/Icdecs-2011-28-320.jpg)
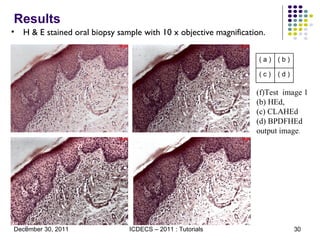
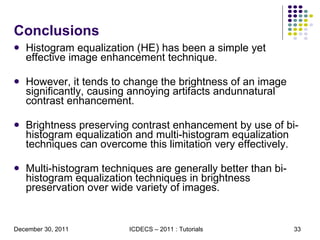
![Results H & E stained breast biopsy sample with 10 x objective magnification. Fig. 7. Test image 2 (b) HEd, (c) CLAHEd [] (d) BPDFHEd output image . ( a ) ( b ) ( c ) ( d )](https://image.slidesharecdn.com/icdecs2011-13254190092261-phpapp01-120101060104-phpapp01/85/Icdecs-2011-31-320.jpg)
![Thank You! [email_address] Hrushikesh Garud](https://image.slidesharecdn.com/icdecs2011-13254190092261-phpapp01-120101060104-phpapp01/85/Icdecs-2011-37-320.jpg)