Downloaded 283 times

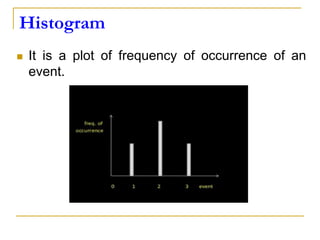
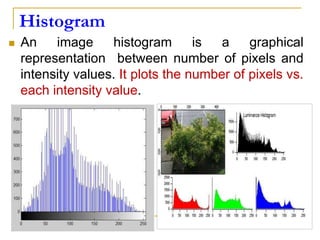
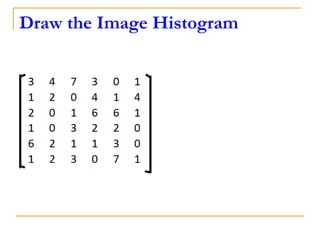
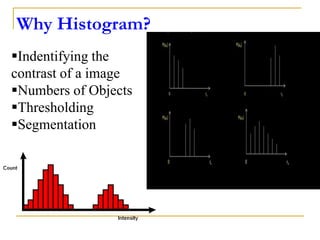
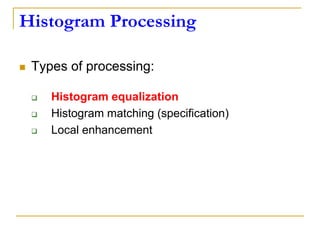
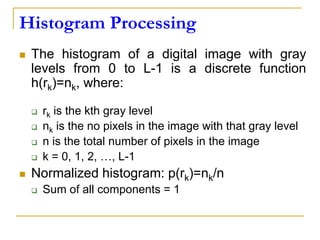
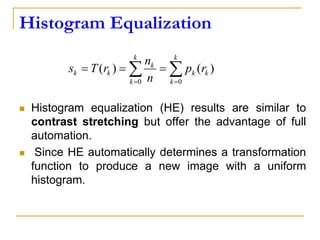
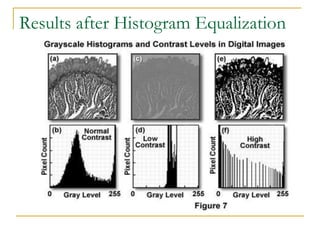
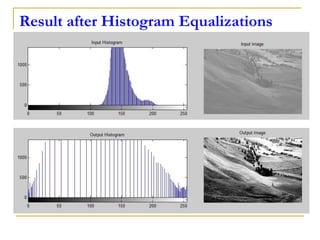
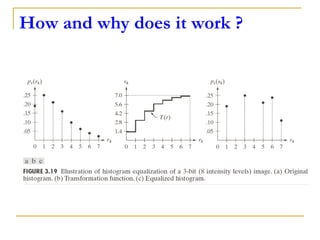
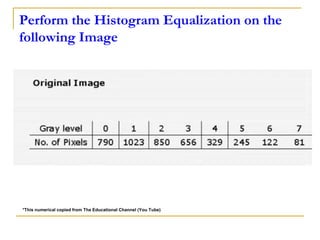


This document discusses image histogram equalization. It begins by defining an image histogram as a graphical representation of the number of pixels at each intensity value. Histogram equalization automatically determines a transformation function to produce a new image with a uniform histogram and increased contrast. This technique works by mapping the intensity values of the input image to a new range of values such that the histogram of the output image is uniform. The document provides an example of performing histogram equalization on an image and assigns related homework on digital image processing applications.