This document compares and analyzes several histogram equalization techniques for image enhancement:
1) Contrast Limited Adaptive Histogram Equalization (CLAHE) divides an image into contextual regions and applies histogram equalization to each region separately, limiting contrast.
2) Dualistic Sub-image Histogram Equalization (DSIHE) decomposes an image into two equal-area sub-images based on the probability density function, equalizes each sub-image, and combines the results.
3) Dynamic Histogram Equalization (DHE) partitions an image histogram based on local minima, allocates a gray scale range to each partition, and applies histogram equalization to each partition within its allocated range.
![ISSN : 2230-7109(Online) | ISSN : 2230-9543(Print) IJECT Vol. 2, Issue 1, March 2011
Histogram Equalization Techniques For
Image Enhancement
1
Rajesh Garg, 2Bhawna Mittal, 3Sheetal Garg
H.I.T., Sonepat, Haryana, India
1,2
3
S.M.Hindu Sr.Sec.School, Sonepat, Haryana, India
Abstract
Various enhancement schemes are used for enhancing an
image which includes gray scale manipulation, filtering and
Histogram Equalization (HE). Histogram equalization is one
of the well known imaget enhancement technique. It became
a popular technique for contrast enhancement because this
method is simple and effective. In the latter case, preserving
the input brightness of the image is required to avoid the
generation of non-existing artifacts in the output image.
Although these methods preserve the input brightness on the Fig.1: Image enhancement
output image with a significant contrast enhancement, they
may produce images with do not look as natural as the input B. Adaptive Histogram Equalization method
ones. The basic idea of HE method is to re-map the gray levels This is an extension to traditional Histogram Equalization
of an image. HE tends to introduce some annoying artifacts technique. It enhances the contrast of images by transforming
and unnatural enhancement. To overcome these drawbacks the values in the intensity image I. Unlike HISTEQ, it operates
different brightness preserving techniques are used which on small data regions (tiles), rather than the entire image. Each
are covered in the literature survey. Comparative analysis of tile's contrast is enhanced, so that the histogram of the output
different enhancement techniques will be carried out. This region approximately matches the specified histogram. The
comparison will be done on the basis of subjective and objective neighboring tiles are then combined using bilinear interpolation
parameters. Subjective parameters are visual quality and in order to eliminate artificially induced boundaries.
computation time and objective parameters are Peak signal- The contrast, especially in homogeneous areas, can be limited
to-noise ratio (PSNR), Mean squared error (MSE), Normalized in order to avoid amplifying the noise which might be present
Absolute Error (NAE), Normalized Correlation, Error Color and in the image.
Composite Peak Signal to Noise Ratio (CPSNR).
C. Dualistic sub-image histogram equalization method
Keywords This is a novel histogram equalization technique in which the
Contrast enhancement, Histogram equalization, PSNR, MSE, original image is decomposed into two equal area sub-images
NAE, CPSNR, Visual quality. based on its gray level probability density function.
Then the two sub-images are equalized respectively. At last, we
I. Introduction get the result after the processed sub-images are composed
Out of the five senses – sight, hearing, touch, smell and taste into one image. In fact, the algorithm can not only enhance
– which humans use to perceive their environment, sight is the image visual information effectively, but also constrain the
the most powerful. Receiving and analyzing images forms a original image's average luminance from great shift. This makes
large part of the routine cerebral activity of human beings it possible to be utilized in video system directly.
throughout their waking lives. In fact, more than 99% of the
activity of the human brain is involved in processing images C. Dynamic histogram equalization for image contrast
from the visual cortex. A visual image is rich in information. enhancement
Confucius said, “A picture is worth a thousand words.” [1] Image It employs a partitioning operation over the input histogram
Enhancement is simple and most appealing area among all to chop it into some sub histograms so that they have no
the digital image processing techniques. The main purpose of dominating component in them. Then each sub-histogram goes
image enhancement is to bring out detail that is hidden in an through HE and is allowed to occupy a specified gray level range
image or to increase contrast in a low contrast image. Whenever in the enhanced output image. Thus, a better overall contrast
an image is converted from one form to other such as digitizing enhancement is gained by DHE with controlled dynamic range
the image some form of degradation occurs at output. of gray levels and eliminating the possibility of the low histogram
components being compressed that may cause some part of
A. Image Enhancement the image to have washed out appearance.
Image enhancement is among the simplest and most appealing
areas of digital image processing. Basically, the idea behind II. Background
enhancement techniques is to bring out detail that is obscured, One of the first applications of digital images was in the
or simply to highlight certain features of interest in an image. newspaper industry, when pictures were first sent by submarine
A familiar example of enhancement is shown in Fig.1 in which cable between London and New York. Introduction of the
when we increase the contrast of an image and filter it to remove Bartlane cable picture transmission system in the early 1920s
the noise "it looks better." It is important to keep in mind that reduced the time required to transport a picture across the
enhancement is a very subjective area of image processing. Atlantic from more than a week to less than three hours.
Improvement in quality of these degraded images can be Specialized printing equipment coded pictures for cable
achieved by using application of enhancement techniques. transmission and then reconstructed them at the receiving end.
w w w. i j e c t. o r g International Journal of Electronics & Communication Technology 107](https://image.slidesharecdn.com/histogramequalization-121230051603-phpapp02/75/Histogram-equalization-1-2048.jpg)
![IJECT Vol. 2, Issue 1, March 2011 ISSN : 2230-7109(Online) | ISSN : 2230-9543(Print)
Some of the initial problems [2] in improving the visual quality B. Equal area Dualistic sub-image histogram equalization
of these early digital pictures were related to the selection of method:
printing procedures and the distribution of intensity levels. Algorithm Steps:
Although the methods just cited involve digital images, they Suppose image X is segmented by a section with gray level
are not considered digital image processing results in the of X=Xe and the two sub-images are Xl and Xu, so we have
context of our definition because computers were not involved
in their creation. Thus, the history of digital image processing ִ
X=XlU XU. Here X L=
is intimately tied to the development of the digital computer. In
fact, digital images require so much storage and computational … (1)
power that progress in the field of digital image processing has It is obvious that sub image XL is composed by gray level of
been dependent on the development of digital computers and {X 0,X1,……… Xe-1}, while sub image X U is composed of
of supporting technologies that include data storage, display, {Xe,Xe+1,………….Xl-1}. The aggregation of the original images’ gray
and transmission. level distribution probability is decomposed into {p0,p1,………
pe-1}
III. Implementation and {pe,pe+1,………….pl-1} correspondingly. The corresponding
Compare all these techniques on the basis of performance cumulative distribution function will be
parameters in objective and subjective manner. These are
the merits on the bases of that I will compare above defined CL ( X k) = , k = 0 ,1 , … … . e-1... (2)
techniques.
CU (Xk) = , k=e,e+1,….. L-1
A. Contrast Limited Adaptive Histogram Equalization Based on the cumulative distribution function, the transform
method: functions of the two sub images’ histogram are equalized
Algorithm Steps: below.
1. Obtain all the inputs: Image, Number of regions in row and F L( X k) = X 0+ ( X e-1- X 0) c ( X k) , k = 0 , 1 , … . e - 1 … (3)
column directions, Number of bins for the histograms used
in building image transform function (dynamic range), Clip FU(Xk)=Xe+(Xl-1-Xe)c(Xk), k=e,e+1,………..L-1
limit for contrast limiting (normalized from 0 to 1)
2. Pre-process the inputs: Determine real clip limit from At last result of dualistic sub image histogram is obtained after
the normalized value if necessary, pad the image before the two equalized sub images are composed into one image.
splitting it into regions Suppose Y denotes the processed image then
3. Process each contextual region (tile) thus producing gray ִ
Y={Y(i,j)}= f L (X L ) U f U (X U ) …. (4)
level mappings: Extract a single image region, make a
histogram for this region using the specified number of
bins, clip the histogram using clip limit, create a mapping
(transformation function) for this region
4. Interpolate gray level mappings in order to assemble final
CLAHE image: Extract cluster of four neighbouring mapping
functions, process image region partly overlapping each
of the mapping tiles, extract a single pixel, apply four
mappings to that pixel, and interpolate between the results
to obtain the output pixel; repeat over the entire image.
Fig.3: Flow chart for DSIHE
Fig.2: Flow chart for CLAHE
108 International Journal of Electronics & Communication Technology w w w. i j e c t. o r g](https://image.slidesharecdn.com/histogramequalization-121230051603-phpapp02/75/Histogram-equalization-2-2048.jpg)
![ISSN : 2230-7109(Online) | ISSN : 2230-9543(Print) IJECT Vol. 2, Issue 1, March 2011
C. Dynamic histogram equalization for image contrast 3. Contrast:
enhancement: Contrast defines the difference between lowest and highest
Algorithm Steps: intensity level. Higher the value of contrast means more
1. Histogram Partition : DHE partitions the histogram based on difference between lowest and highest intensity level.
local minima. At first, it applies a one-dimensional smoothing
filter of size 1 x 3 on the histogram to get rid of insignificant 4. Visual Quality
minima. Then it makes partitions (sub-histograms) taking the By looking at the enhanced image, one can easily determine
portion of histogram that falls between two local minima (the the difference between the input image and the enhanced
first and the last non-zero histogram components are considered image and hence, performance of the enhancement technique
as minima). Mathematically, if m0, m1, …, mn are (n+1) gray is evaluated.
levels (GL) that correspond to (n+1) local minima in the image
histogram, then the first sub-histogram will take the histogram
components of the GL range [m0, m1], the second one will take
[m1+1, m2] and so on.These histogram partitioning helps to
prevent some parts of the histogram from being dominated
by others.
2. Gray Scale Allocation: For each sub-histogram, DHE allocates
a particular range of GLs over which it may span in output
image histogram. This is decided mainly based on the ratio of
the span of gray levels that the sub-histograms occupy in the
input image histogram.
Here the straightforward approach is
Spani= mi-mi-1
rangei=
where, spani = dynamic GL range used by sub-histogram i in
input image.
mi = ith local minima in the input image histogram.
rangei = dynamic gray level range for sub-histogram i in output
image.
The order of gray levels allocated for the sub-histograms in
output image histogram are maintained in the same order as
they are in the input image, i.e., if sub-histogram i is allocated
the gray levels from [istart, iend], then istart = (i-1)end + 1 and iend=
istart + rangei. For the first sub-histogram, j, jstart = r0.
3. Histogram Equalization : Conventional HE is applied to each
sub-histogram, but its span in the output image histogram
is allowed to confine within the allocated GL range that is
designated to it. Therefore, any portion of the input image
histogram is not allowed to dominate in HE.
D. Metrics for Gray Scale Images: Fig. 4: Flow chart for DHE
1. Peak-signal-to-noise-ratio (PSNR): IV. Tool to be used:
PSNR is the evaluation standard of the reconstructed image In this thesis for implementation of techniques MATLAB 7.0.2
quality, and is important measurement feature. PSNR is version is used. In that image processing toolbox is used.
measured in decibels (dB) and is given by: MATLAB® is a high-performance language for technical
2 computing.
PSNR = 10log 255 MSE
V. Experimental Results
where the value 255 is maximum possible value that can To verify the efficacy of the proposed method, obtained after
be attained by the image signal. Mean square error (MSE) is following the Different enhancement Algorithms for gray scale
defined as Where M*N is the size of the original image. Higher images. After the comparison tables, a graphical representation
the PSNR value is, better the reconstructed image is. has also been done for a quick analysis of results. All the
techniques have been tested for all the assumed standard test
2. Absolute mean brightness error (AMBE): images.In this paper three techniques are used for Gray Scale
It is the Difference between original and enhanced image and Image enhancement which are CLAHE, DSIHE and DHE.
is given as
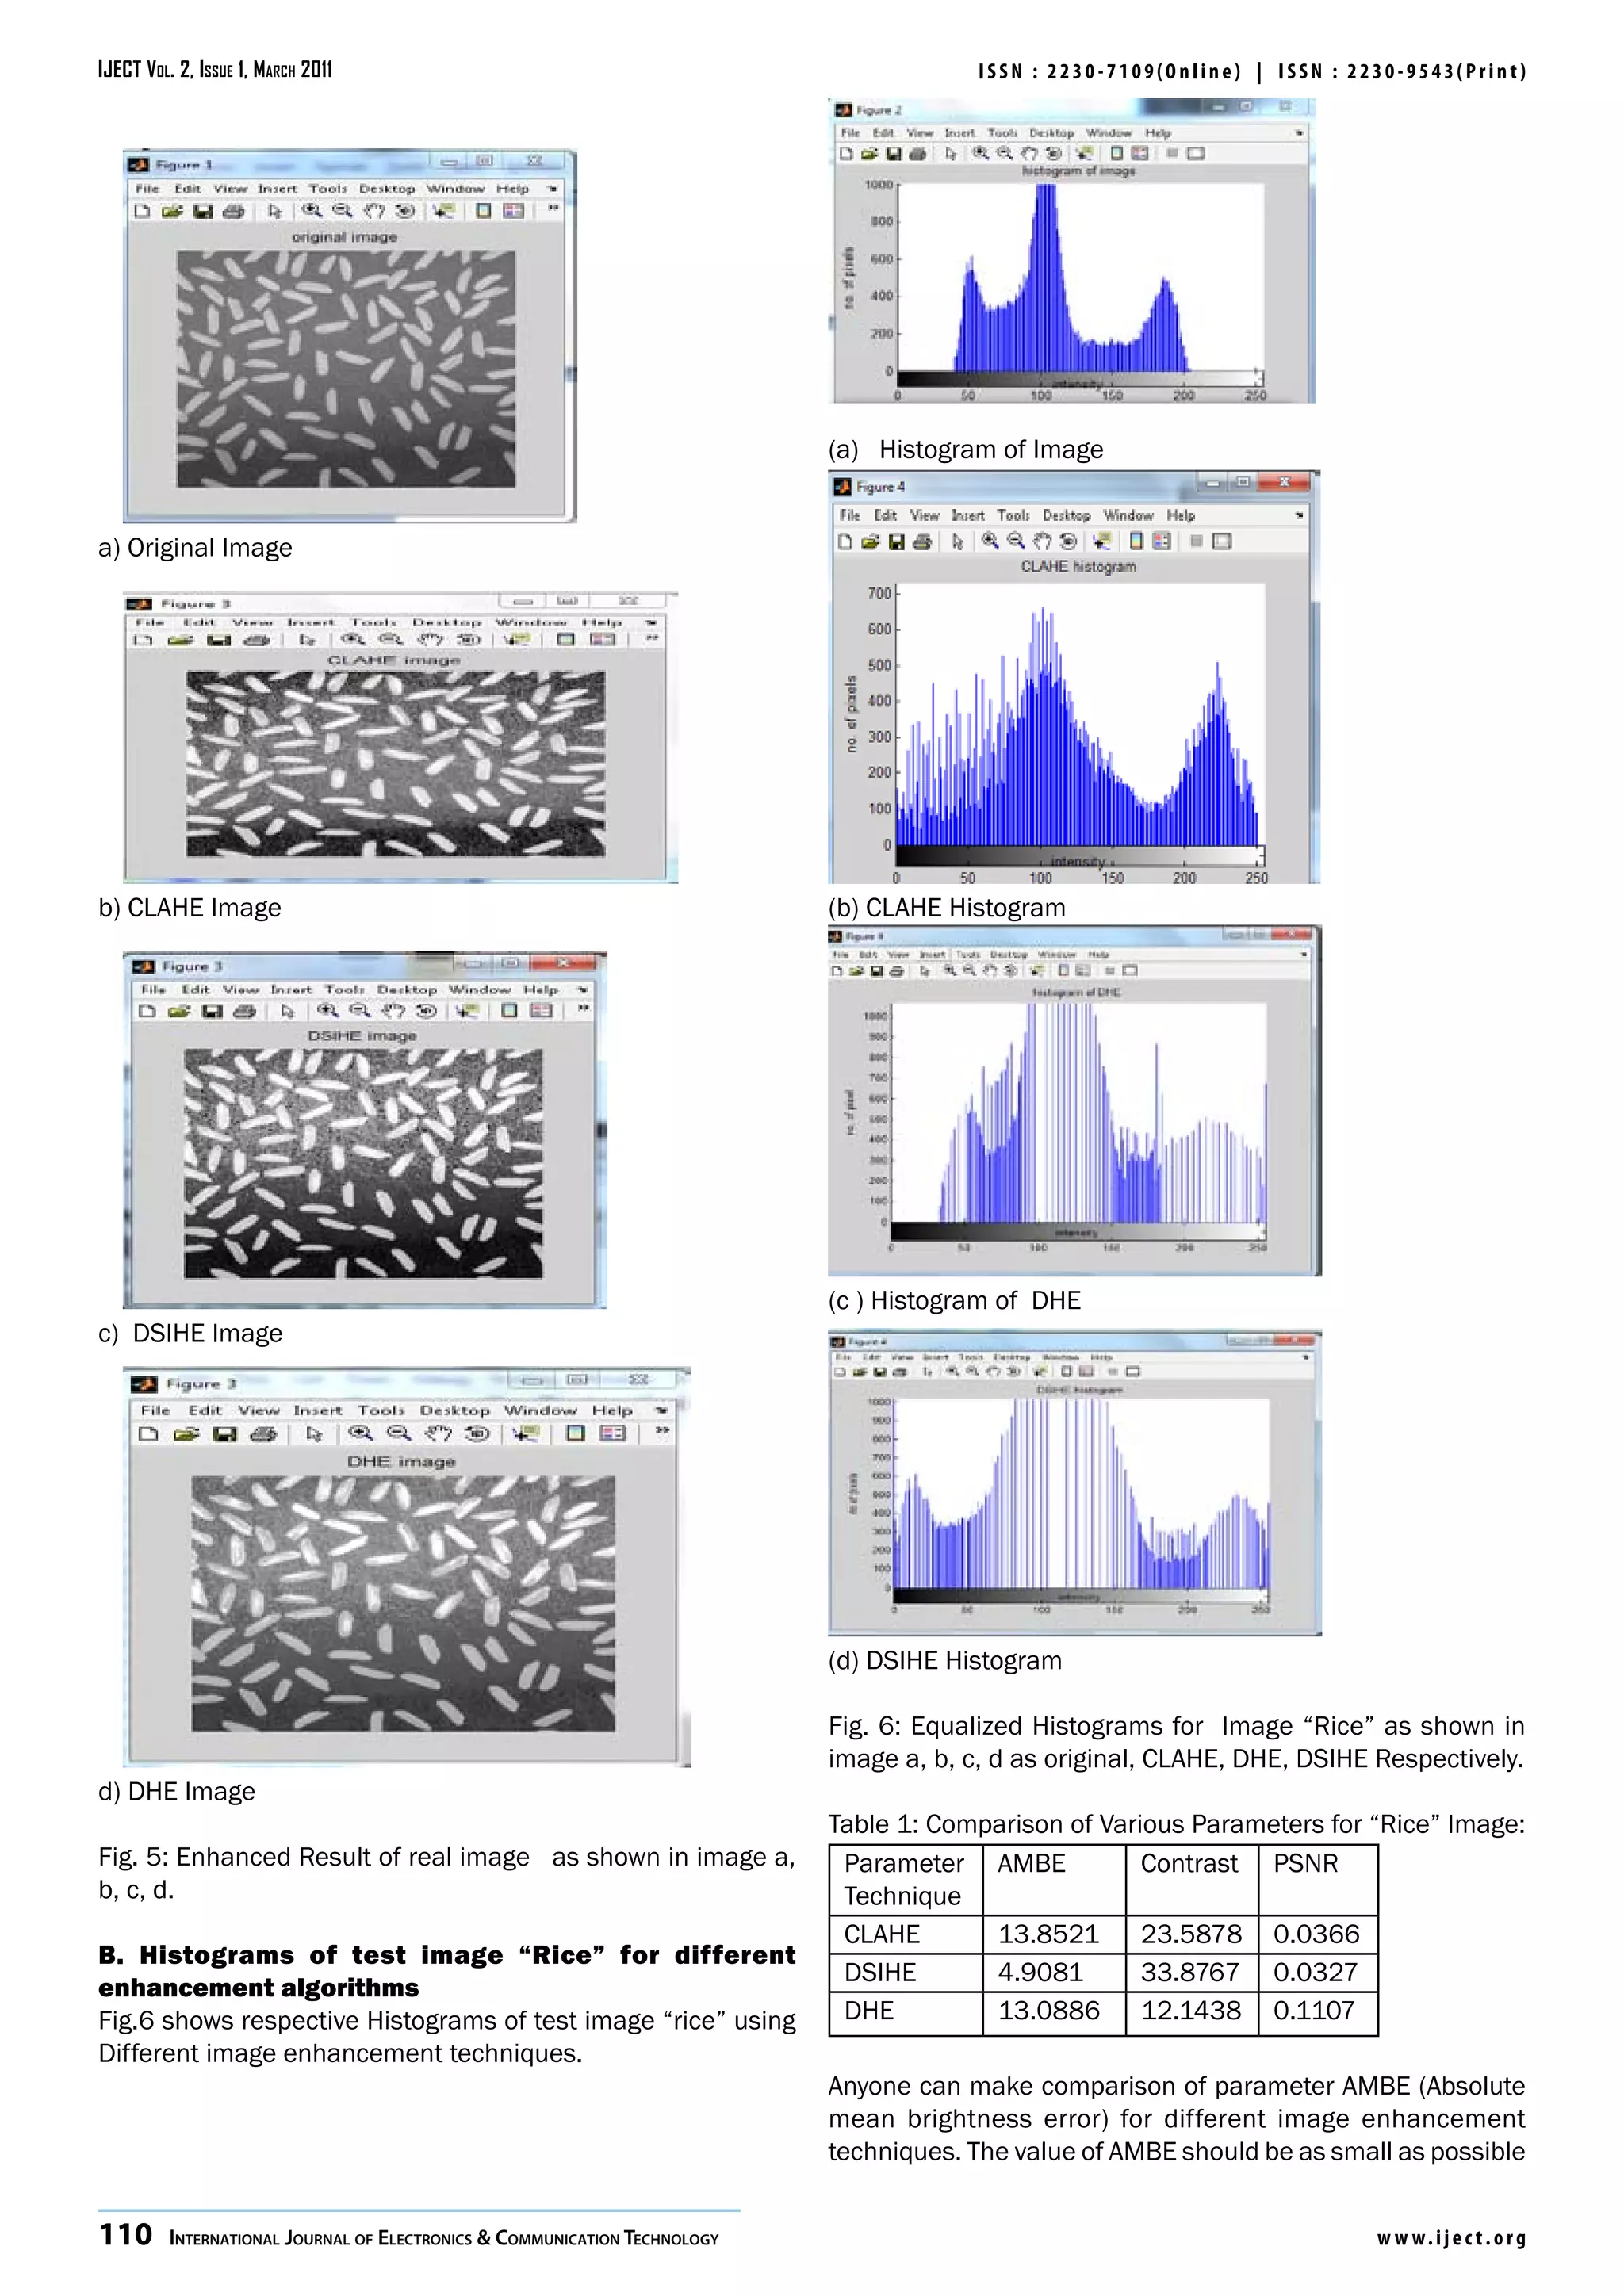
A. Results of test image “Rice”
AMBE= Fig.5 shows the visual quality of real image “Rice” and the
Where E(x)= average intensity of input image E(y)=average enhanced image using three different image enhancement
intensity of enhanced image techniques. The performances of these techniques are
evaluated in terms of PSNR, AMBE and Contrast.
w w w. i j e c t. o r g International Journal of Electronics & Communication Technology 109](https://image.slidesharecdn.com/histogramequalization-121230051603-phpapp02/75/Histogram-equalization-3-2048.jpg)
![ISSN : 2230-7109(Online) | ISSN : 2230-9543(Print) IJECT Vol. 2, Issue 1, March 2011
which indicates that difference between original and enhanced Proceedings.
image should be minimum. Therefore in terms of AMBE, DSIHE [9] Md. Foisal Hossain, Mohammad Reza Alsharif, “Image
technique gives best results as AMBE is taken in negative. Enhancement Based on Logarithmic Transform Coefficient
Now considering PSNR, CLAHE gives better output as it is cleared and Adaptive Histogram Equalization”, 2007 International
from the formula that PSNR should be as high as possible so Conference on Convergence Information Technology, IEEE
that noise content should be lower than signal content. 2007.
[10] J. Alex Stark “Adaptive Image Contrast Enhancement
VI. Conclusion and Future Scope Using Generalizations of Histogram Equalization”, IEEE
In this Paper, a frame work for image enhancement based Transactions on Image Processing, Vol. 9, No. 5, May
on prior knowledge on the Histogram Equalization has been 2000.
presented. Many image enhancement schemes like Contrast [11] Wang Yuanji. Li Jianhua, Lu E, Fu Yao, Jiang Qinzhong,
limited Adaptive Histogram Equalization (CLAHE), Equal area “Image Quality Evaluation Based On Image Weighted
dualistic sub-image histogram equalization (DSIHE), Dynamic Separating Block Peak Signal To Noise Ratio”, IEEE Int.
Histogram equalization (DHE) Algorithm has been implemented Conf. Neural Networks & Signal Processing, Nanjing,
and compared. The Performance of all these Methods has been China, December 14-17, 2003.
analyzed and a number of Practical experiments of real time [12] Rafael C. Gonzalez, Richard E. Woods, “Digital Image
images have been presented. From the experimental results, it Processing”, 2nd edition, Prentice Hall, 2002.
is found that all the three techniques yields Different aspects for [13] Stephen M. Pizer, R. Eugene Johnston, James P. Ericksen,
different parameters. In future, for the enhancement purpose Bonnie C. Yankaskas, Keith E. Muller, “Contrast-Limited
more images can be taken from the different application fields Adaptive Histogram Equalization Speed and Effectiveness”,
so that it becomes clearer that for which application which ”, IEEE Int. Conf. Neural Networks & Signal Processing,
particular technique is better both for Gray Scale Images and Nanjing, China, December 14-17, 2003.
colour Images. Particularly, for colour images there are not [14] Rafael C. Gonzalez, Richard E. Woods, “Digital Image
many performances measurement parameter considered. Processing”, 2nd edition, Prentice Hall, 2002.
So, new parameters can be considered for the evaluation of [15] A. K. Jain, “Fundamentals of Digital Image Processing”.
enhancement techniques. New colour models can also be Englewood Cliffs, NJ: Prentice-Hall, 1991.
chosen for better comparison purpose. Optimization of various [16] A. Zagzebski, “Essentials of Ultrasound Physics”. St. Louis,
enhancement techniques can be done to reduce computational Missouri: Mosby, 1996.
complexity as much as possible.
Rajesh Garg received his B.E. degree in
References Electronics & Comm. from Hindu College of
[1] S. Lau, “Global image enhancement using local engineering, Sonipat, Haryana, in 2006 and
information,” Electronics Letters, vol. 30, pp. 122–123, pursuing the M-Tech. (part-time) degree in
Jan. 1994. Electronics & Comm. From M.M. University,
[2] J. Zimmerman, S. Pizer, E. Staab, E. Perry, W. McCartney, Mullna (Ambala). Presently, he is engaged
B. Brenton, “Evaluation of the effectiveness of adaptive in teaching, as a lecturer in Electronics &
histogram equalization for contrast enhancement,” IEEE Comm. Department in Hindu institute of
Transactions on Medical Imaging, pp. 304-312, 1988. Technology, Sonepat since 2006.
[3] Yu Wan, Qian Chen, Bao-Min Zhang, “Image enhancement
based on equal area dualistic sub-image histogram
equalization method,” IEEE Transactions Consumer Bhawna Mittal received her B.E. degree
Electron., vol. 45, no. 1, pp. 68-75, 1999. in Electronics & Comm. from North
[4] Yeong-Taeg Kim, “Contrast enhancement using brightness Maharashtra University in 1998 and
preserving bi-histogram equalization,” IEEE Trans. M-Tech. (part-time) degree in Electronics &
Consumer Electronics, vol. 43, no. 1, pp. 1-8, 1997. Comm. from Rajasthan University, Udaipur
[5] M. Abdullah-Al-Wadud, Md. Hasanul Kabir, M. Ali Akber in 2007. She was teaching as lecturer
Dewan, Oksam Chae, “A dynamic histogram equalization in S.J.P.P.,Damla in 1999 to 2000.From
for image contrast enhancement”, IEEE Transactions. 2000 onwards she worked as a Lecturer
Consumer Electron., vol. 53, no. 2, pp. 593- 600, May in Electronics & Comm. Department at
2007. Hindu institute of Technology, Sonepat then promoted as Sr.
[6] K. Wongsritong, K. Kittayaruasiriwat, F. Cheevasuvit, Lecturer in Electronics & Comm. Department at Hindu institute
K. Dejhan, A. Somboonkaew, “Contrast enhancement of Technology, Sonepat in 2007.Presently,she is engaged in all
using multipeak histogram equalization with brightness the academic activities of the institute.
preserving”, Circuit and System, 1998, IEEE APCCAS
1998. The 1998 IEEE Asia-Pacific Conference on 24-27 Sheetal Garg received her B.Sc. degree
Nov. 1998, pp. 455-458, 1998. in Computer Science from G.V.M. Girls
[7] Y. Wang, Q. Chen, B. Zhang, Soong-Der Chen, and Abd. College, Sonipat, Haryana, in 2002 and
Rahman Ramli, “Minimum mean brightness error bi- M.C.A degree from Kurukshetra University,
histogram equalization in contrast enhancement”, IEEE Kurukshetra in 2005. Presently, she
Transactions Consumer Electron. vol. 49, no. 4, pp. 1310- is engaged in teaching, as a lecturer
1319, Nov. 2003. in Computer Science Department in
[8] WANG Zhiming, TAO Jianhua, “A Fast Implementation of S.M.Hindu Sr.Sec.School, Sonepat since
Adaptive Histogram Equalization”, IEEE 2006, ICSP 2006 2005.
w w w. i j e c t. o r g International Journal of Electronics & Communication Technology 111](https://image.slidesharecdn.com/histogramequalization-121230051603-phpapp02/75/Histogram-equalization-5-2048.jpg)