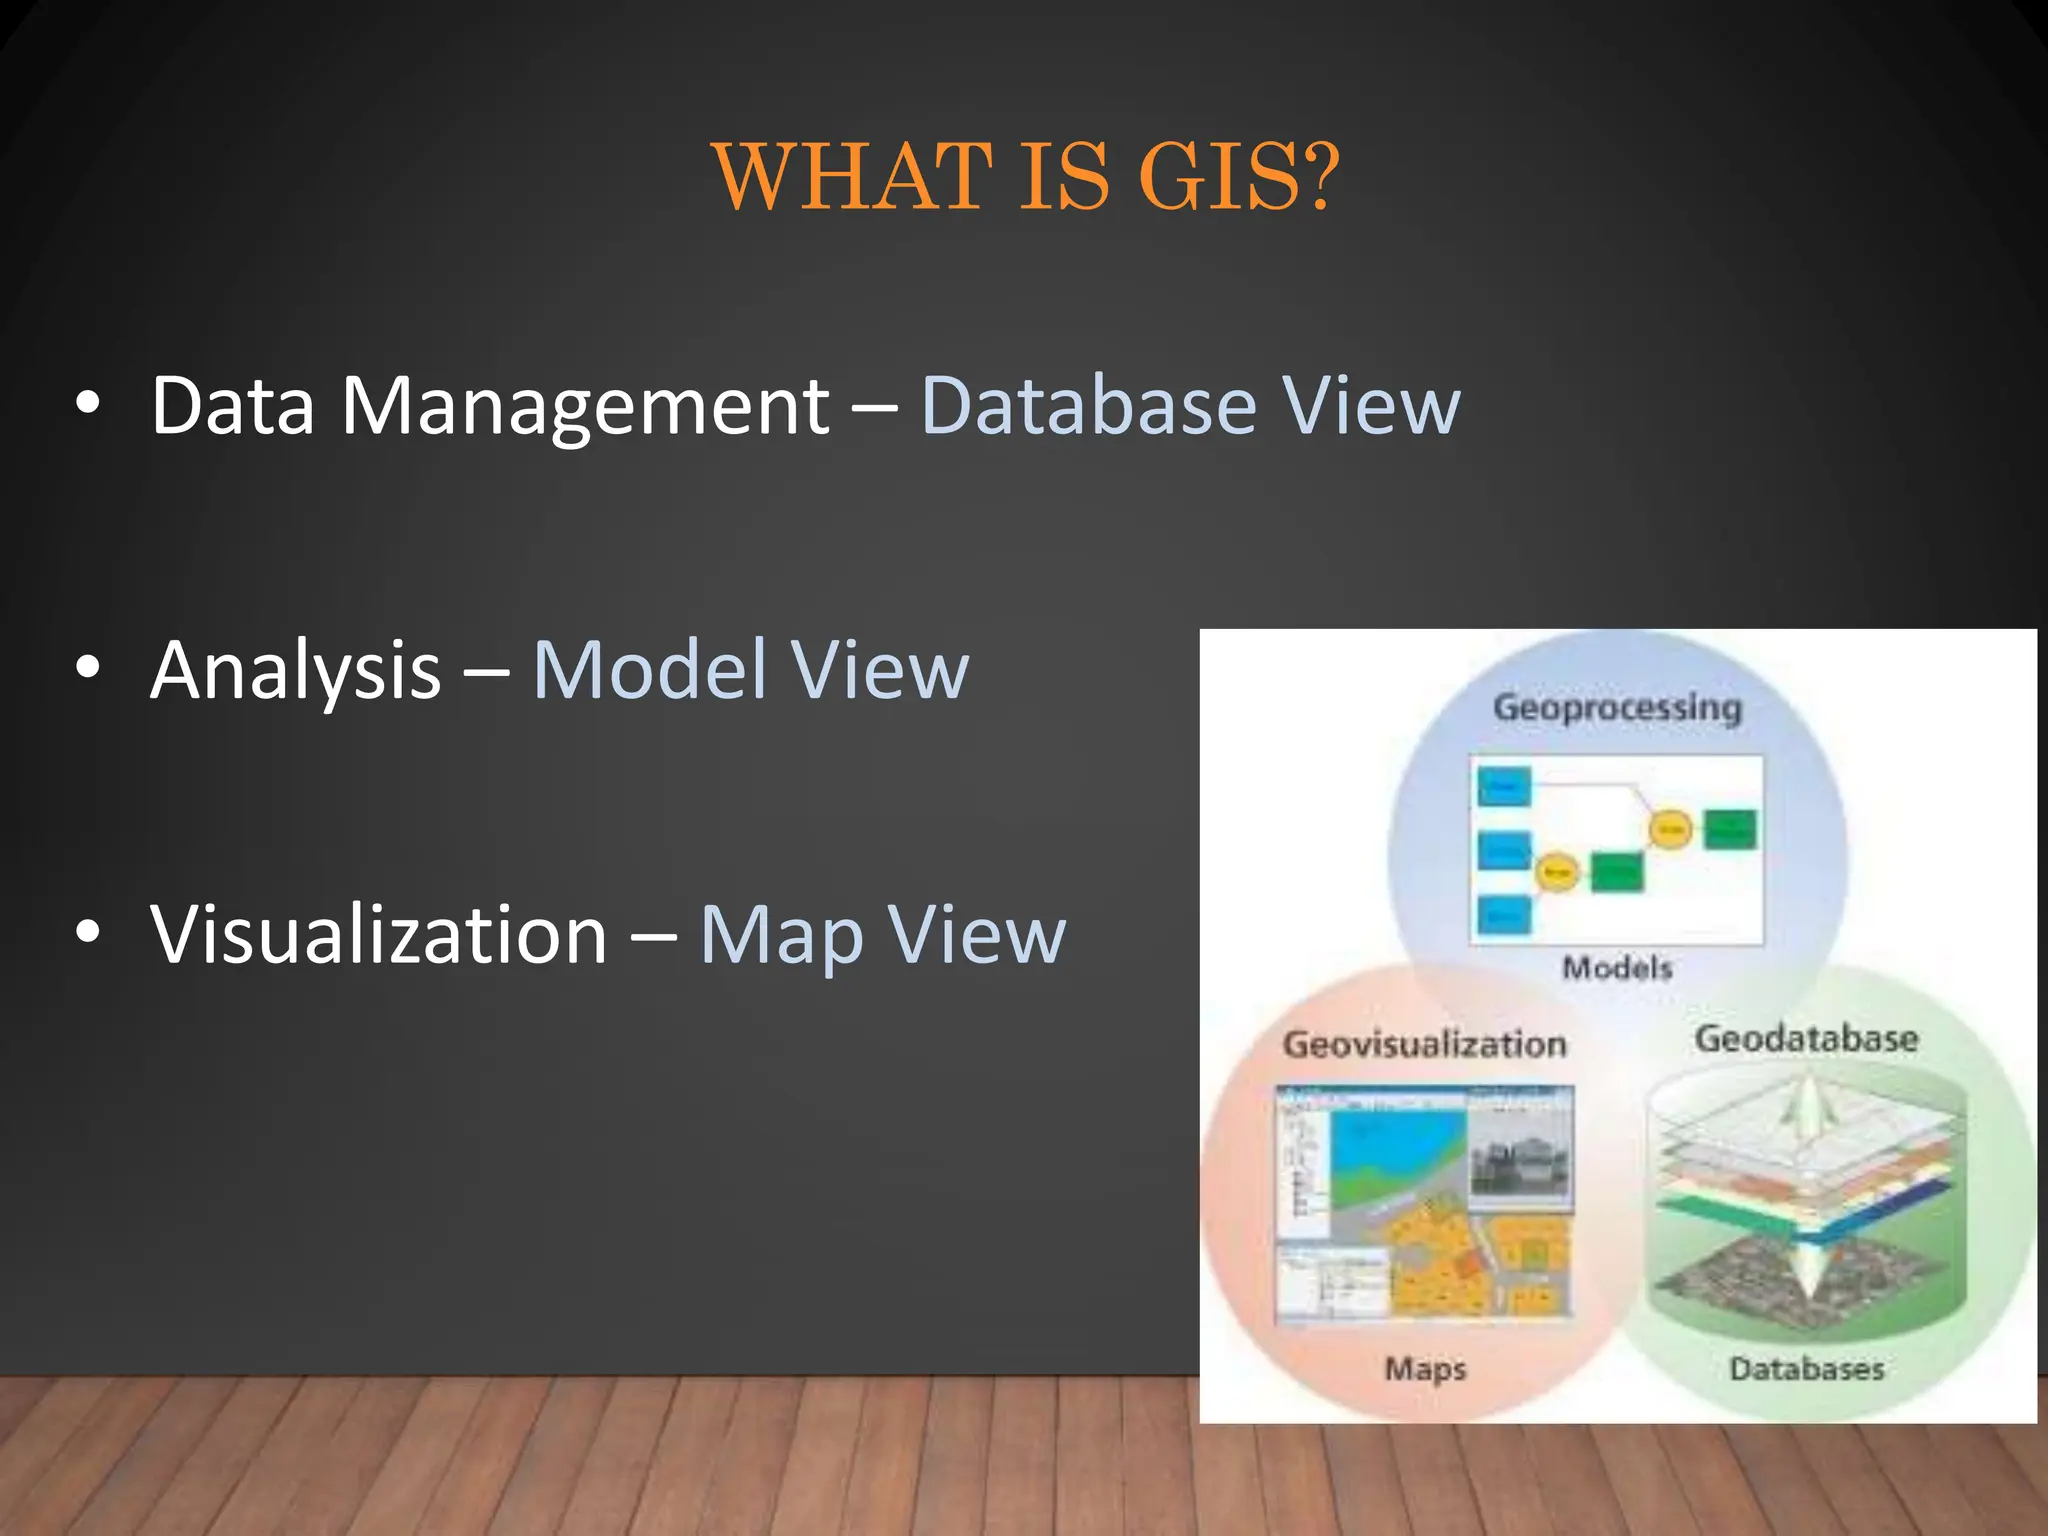
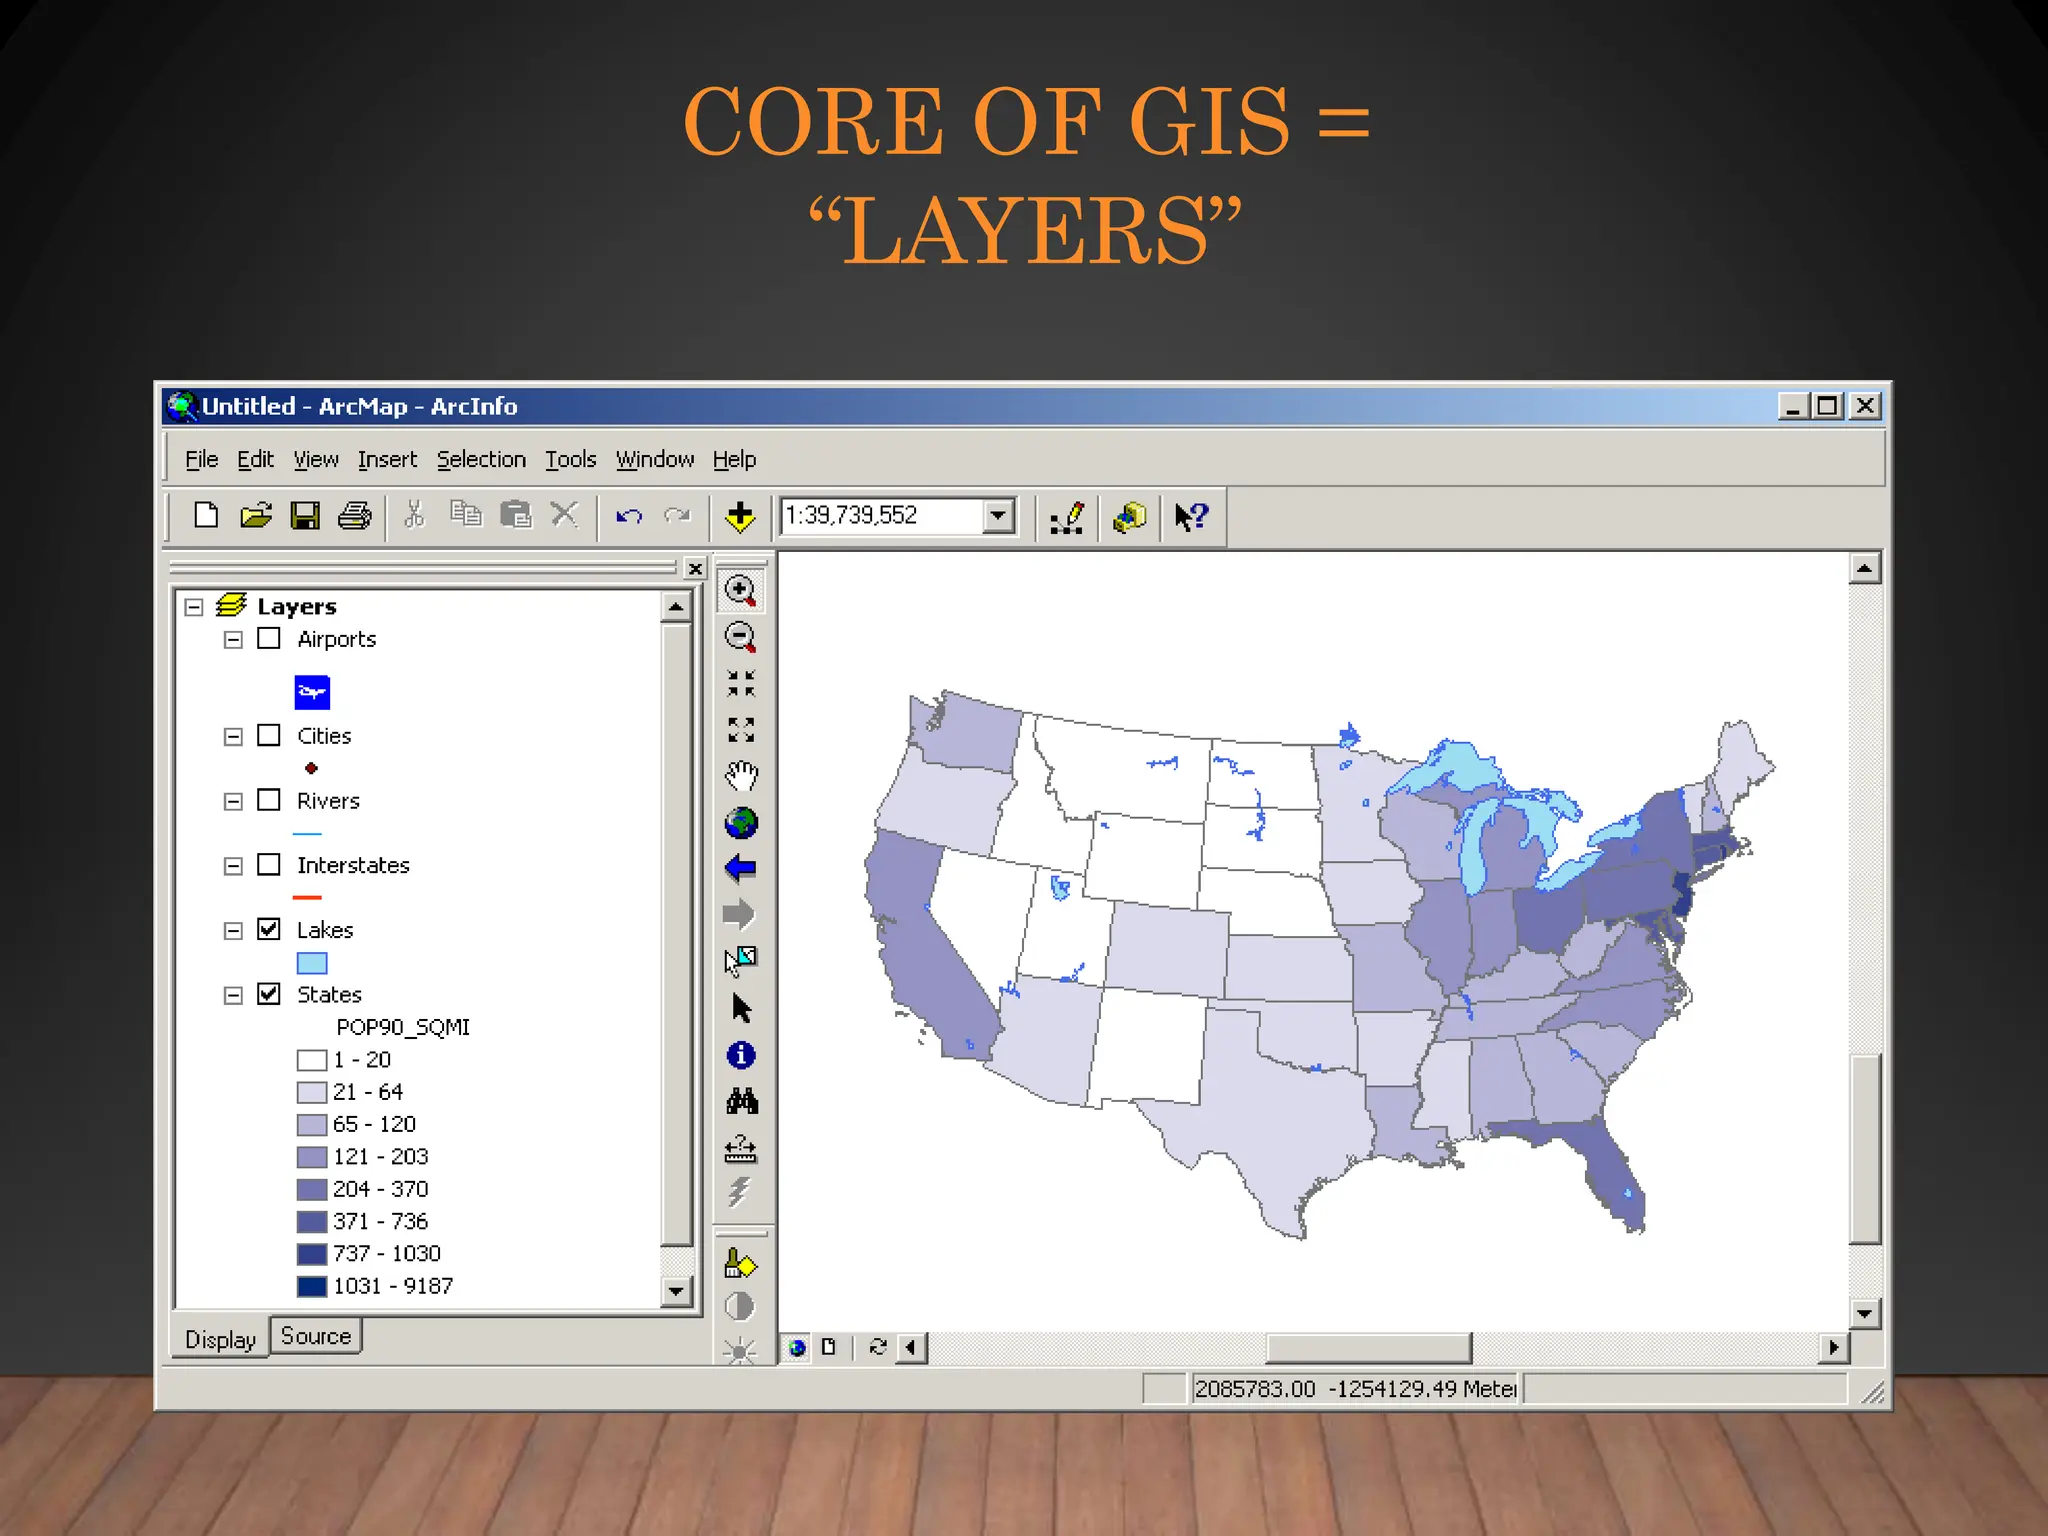
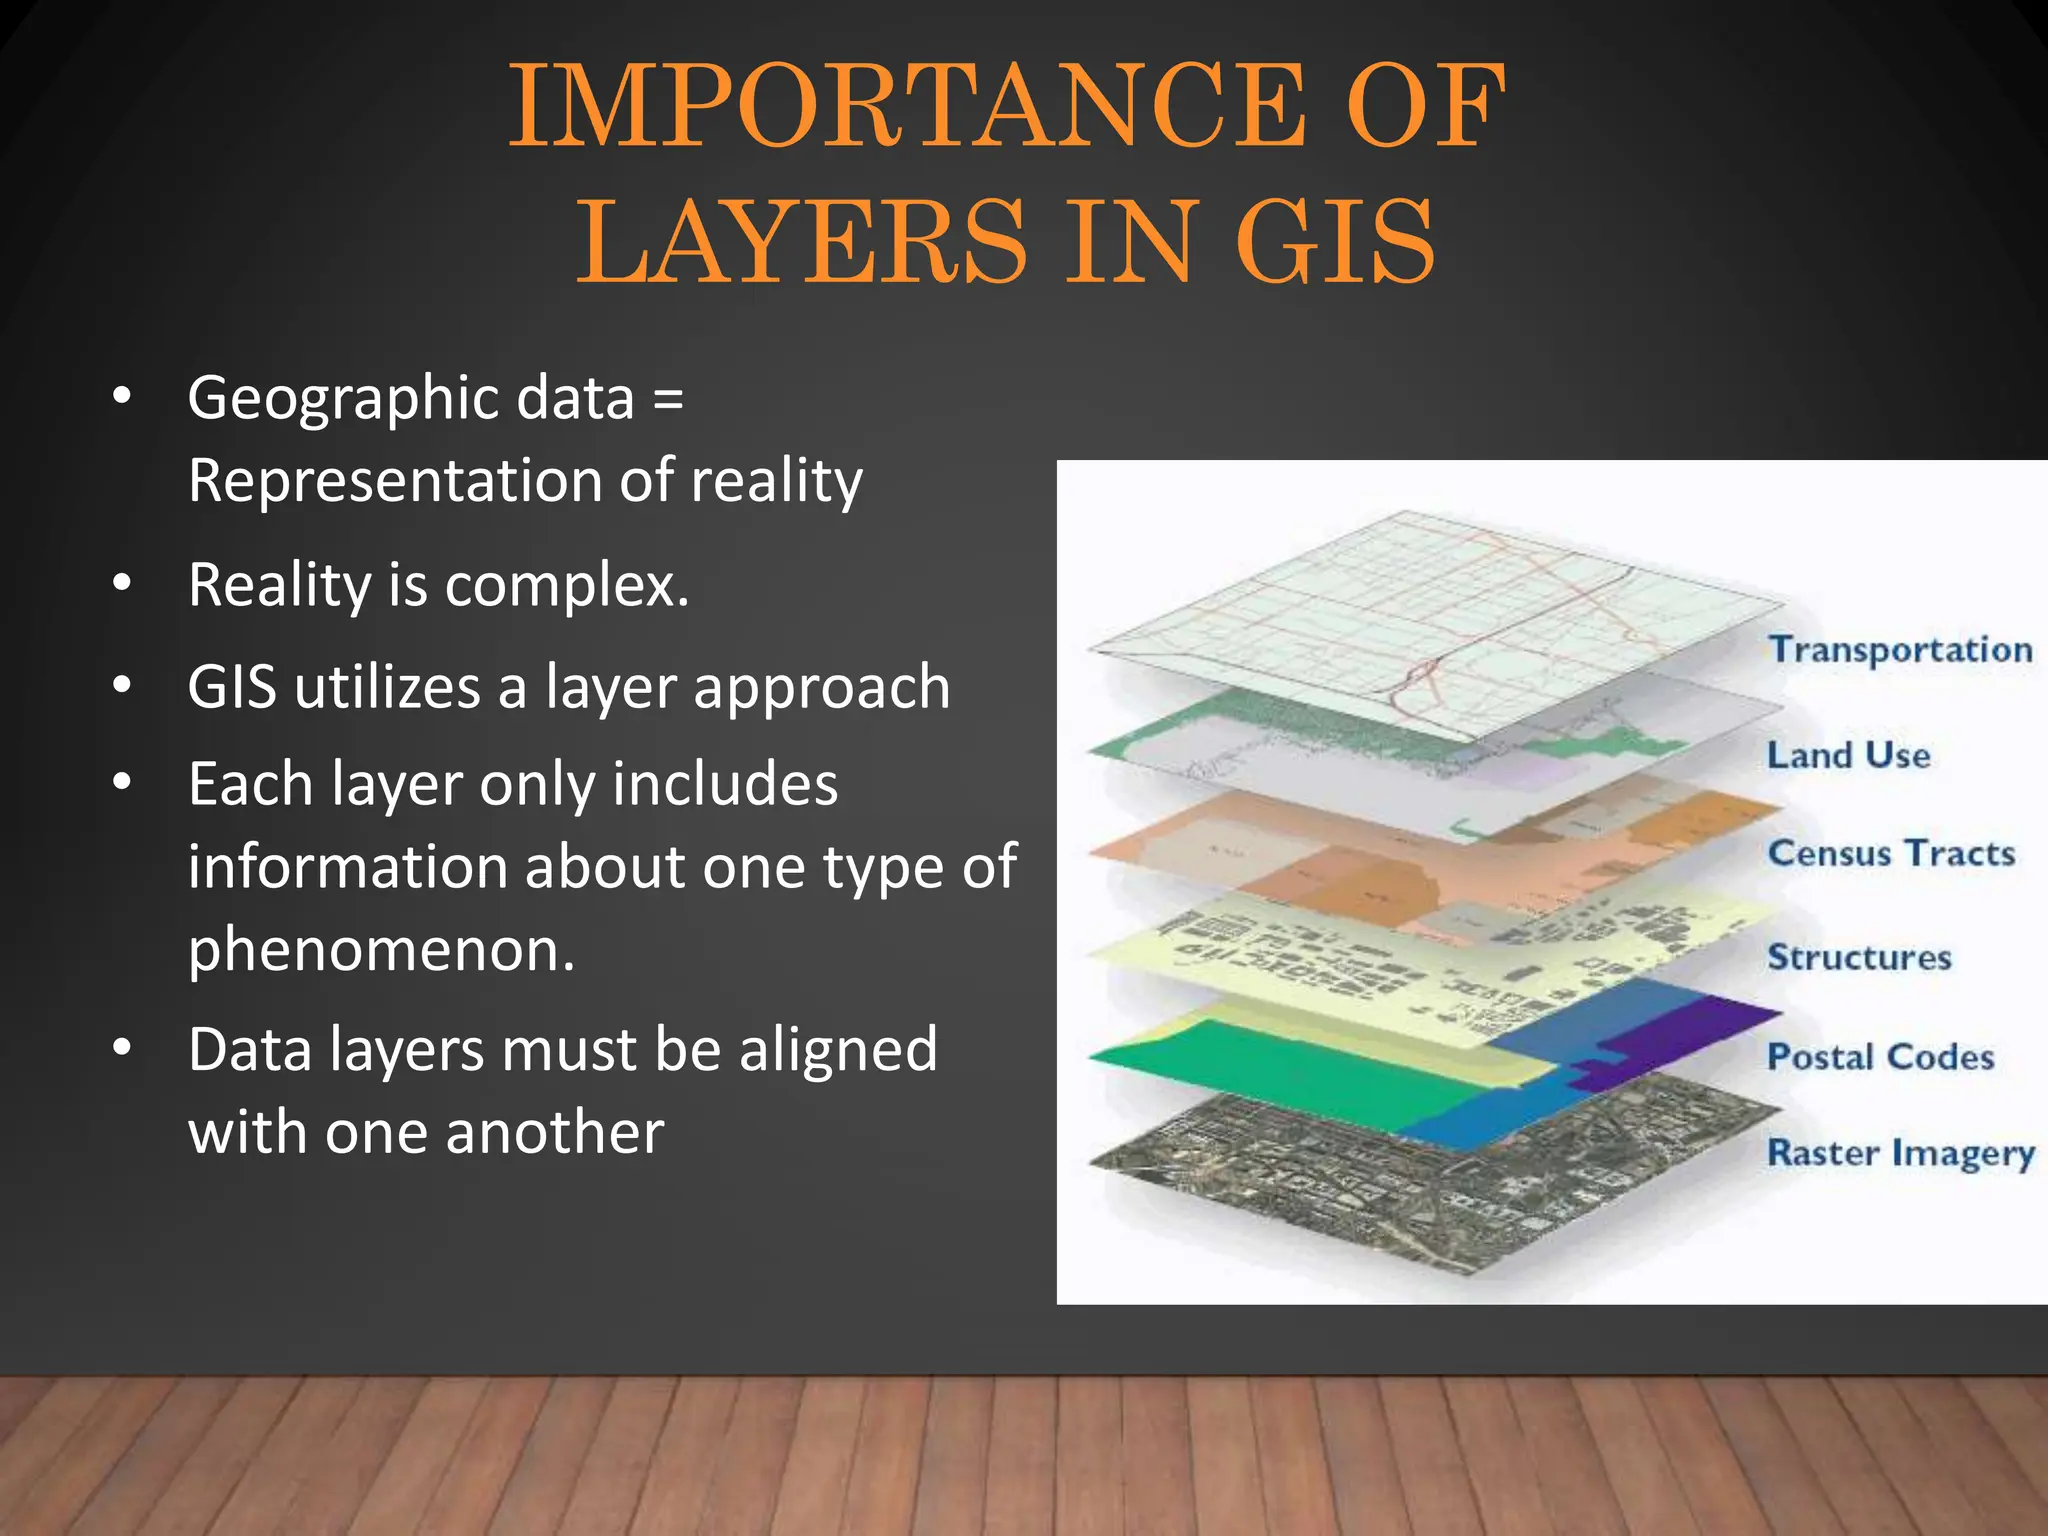
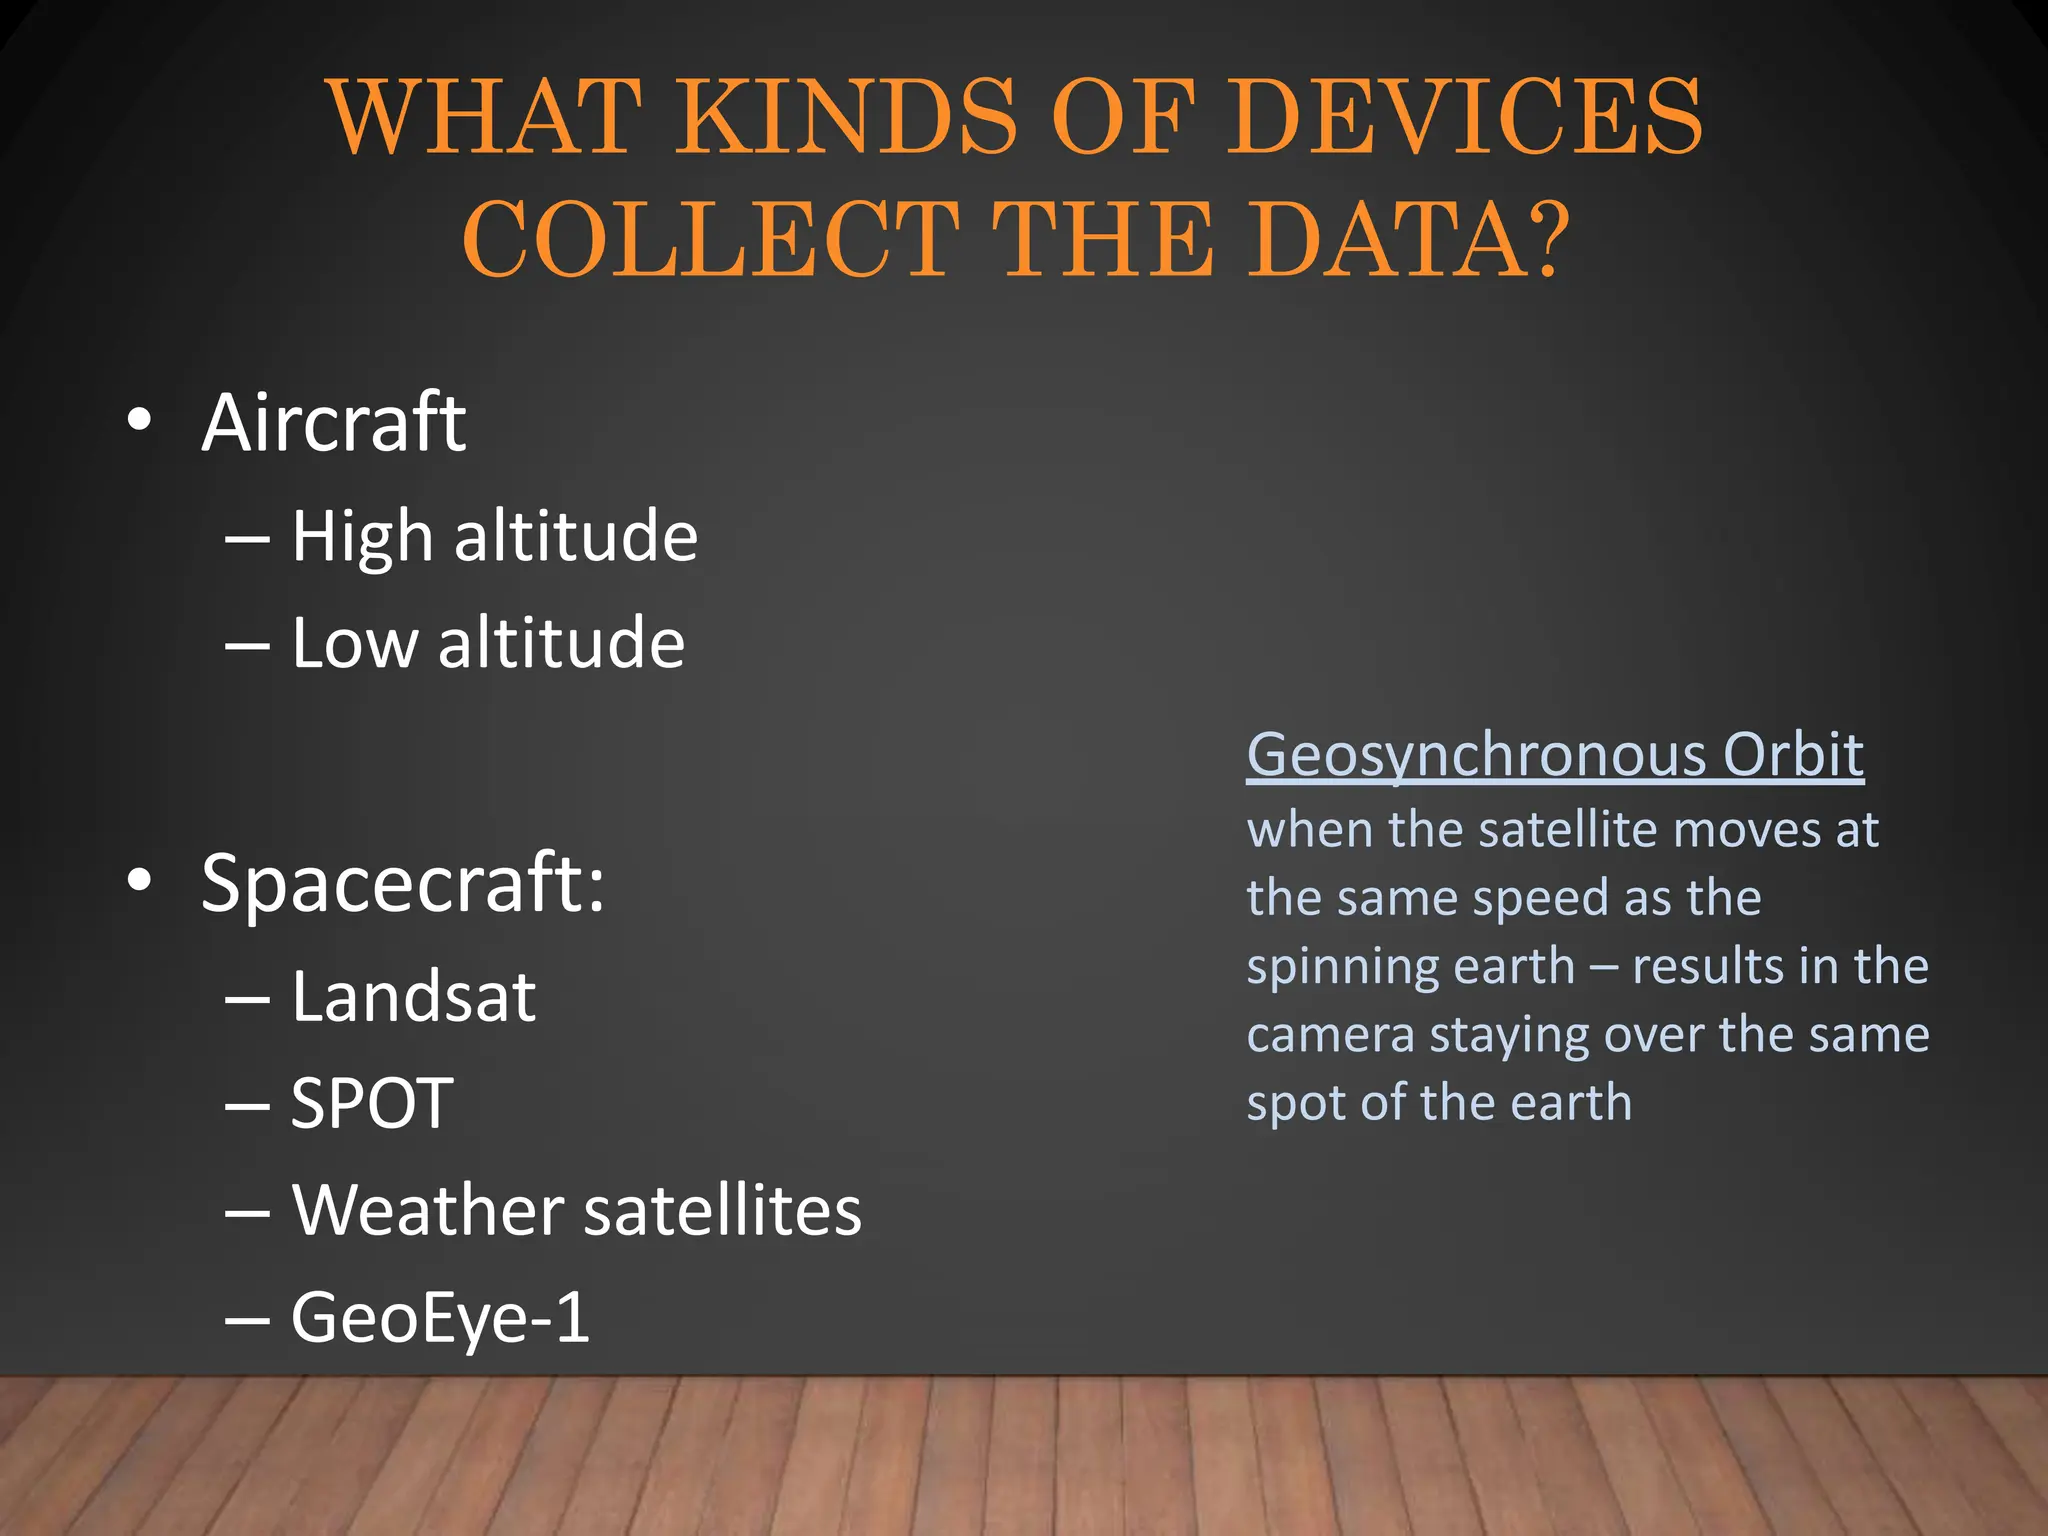
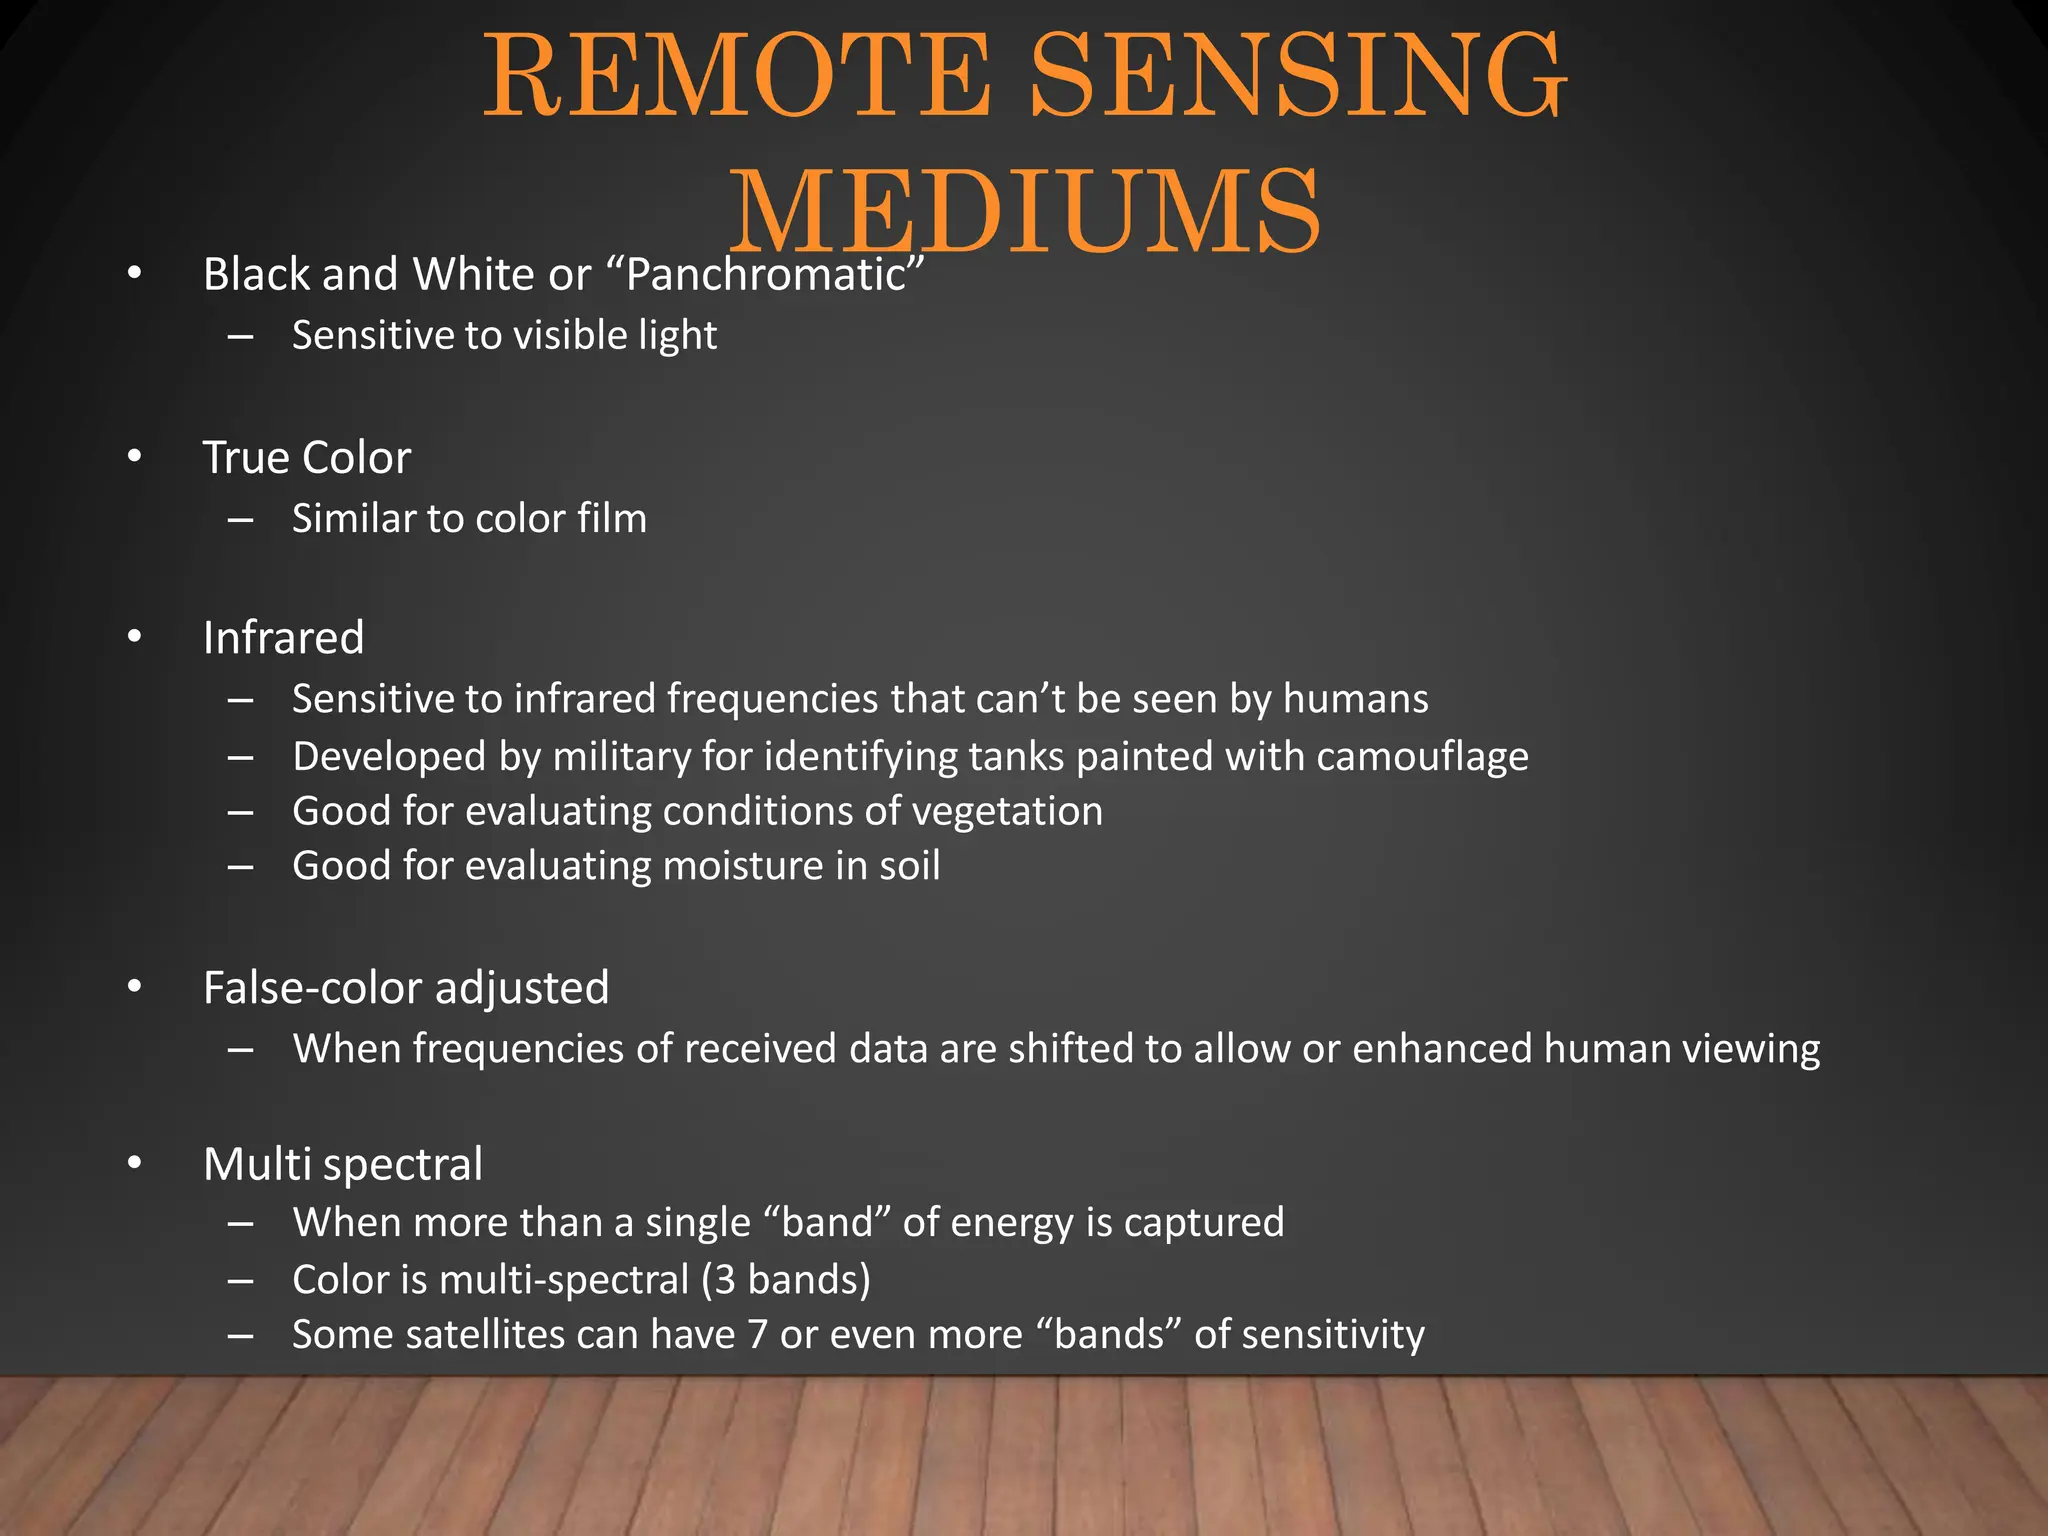
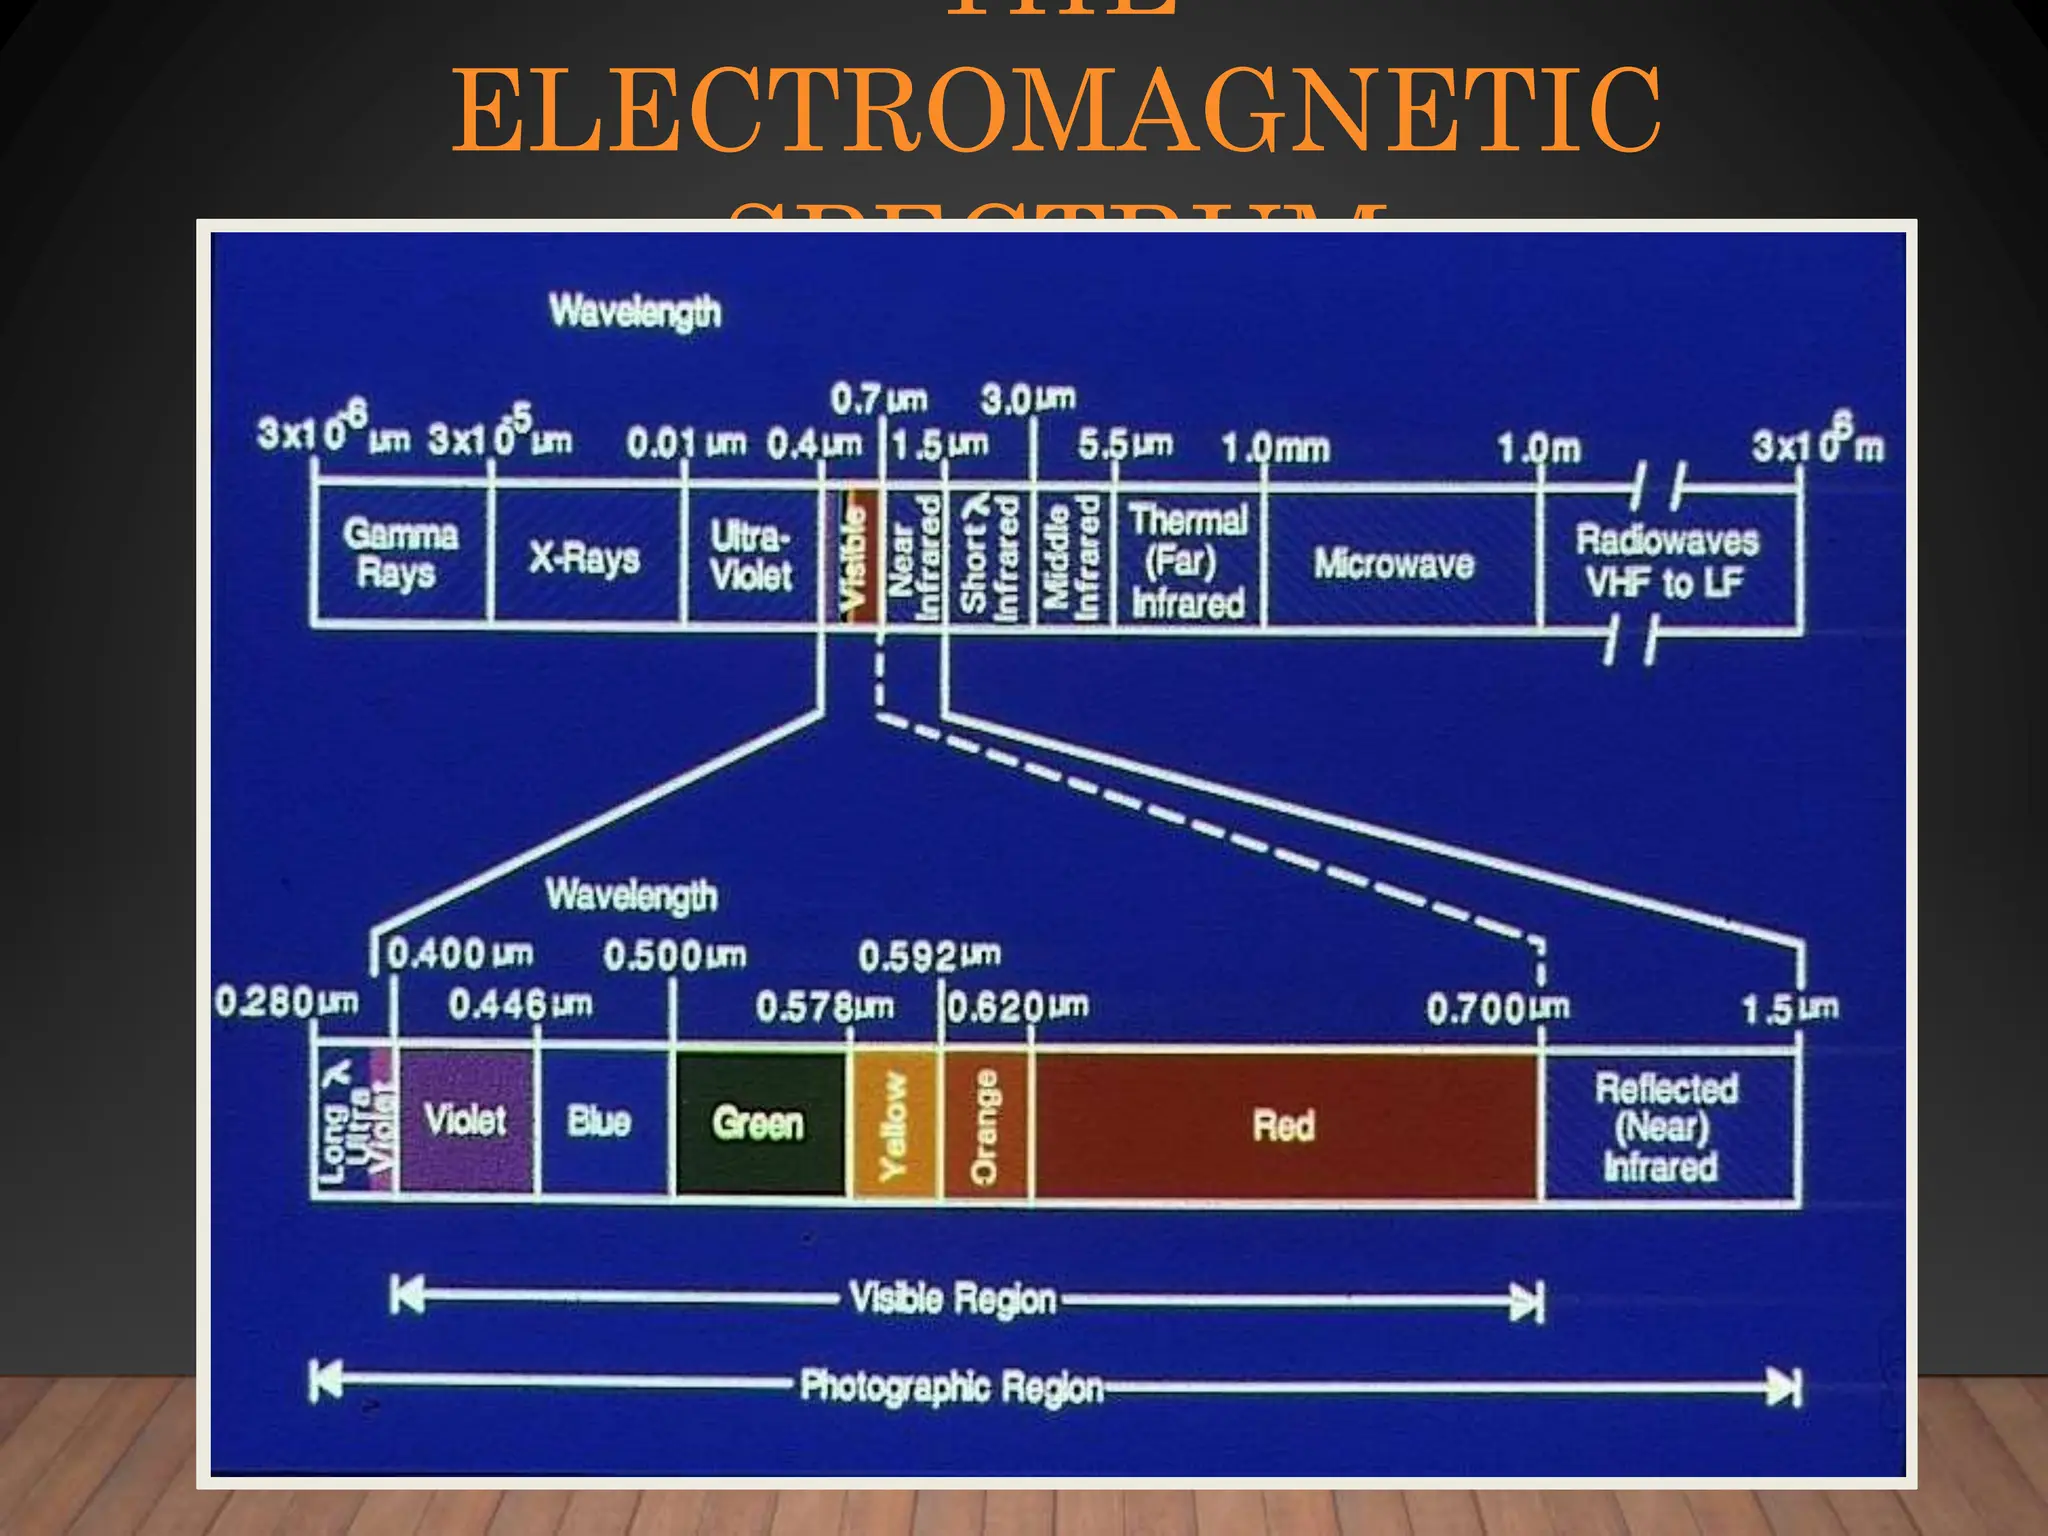
2. DATA TYPES
Aspatial data—data not tied to a location on
the earth’s surface
Spatial data—data associated with a location on
earth
Much of the information we deal with daily has
some spatial component.
3. WHAT IS GIS?
1. Data Management
– Manages various kinds of GIS data including vector,
raster, images, tables, other data files
– Data models and architectures
– Conversion between formats
– Import/export utilities
– Interacts with RDBMS (SQL Server, Oracle, etc…)
4. WHAT IS GIS?
Analysis
– Spatially aware data
– Attribute and spatial query
– Proximity and Overlay
– Advanced geoprocessing techniques
– Decision support
– Flexible, customization
• Programming, scripting (to perform analysis)
5. WHAT IS GIS?
1. Visualization
– Maps! Maps! Maps!
• If a picture is worth a 1000 words…
– Professional cartographic tool
– Charts, graphs, tables, etc…
– Various coordinate systems
– 2D and 3D
– Web, desktop, handheld, etc…
6. WHAT IS GIS?
• Data Management – Database View
• Analysis – Model View
• Visualization – Map View
7. “G” VS. “IS”
• GIS uses maps to spatially analyze and search for
patterns in the data that would otherwise not be found.
(Content)
• GIS stores, manipulates, and displays data files and
relationships in a information system using standard
computing practices. (IT)
• With advances in technology, GIS users must now
deal with both aspects!
8. THE “G”
• “G” = Geographic
– Denotes the concept of spatial location on
Earth’s surface
– Importance of relative location (not just where
you are but where you are in relation to
everything else)
– Theories and techniques in Geography form
the basis of GIS
9. THE “I”
• “I” = Information
– Substance (knowledge) about location
– Factual and interpretative
– Tables + Maps + Analysis
– Transformation of table information into spatial
context for analysis
– Technology and computer systems
10. WHAT ABOUT THE “S” IN
GIS?
• Systems
• Science
• Studies
• Services
11. GEOSPATIAL
?
• Geographic + GIS = “Geospatial”
• Move in recent years to better define the industry
and to focus on data and procedures (business) over
geographic principles (academic)
• Geospatial includes all subcomponents of GIS
embedded in other areas (remote sensing, GPS etc.)
13. IMPORTANCE OF
LAYERS IN GIS
• Geographic data =
Representation of reality
• Reality is complex.
• GIS utilizes a layer approach
• Each layer only includes
information about one type of
phenomenon.
• Data layers must be aligned
with one another
14. IMPORTANCE OF
LAYERS
• Proximity
– Finding what is near or within a distance from a
certain location or feature
e.g., all houses within 100 yards of a stream
• Overlay
– Combining two layers to create new information
e.g., habitat based on veg, elevation, and temp
15. FAMILIES OF GIS DATA
Vector mode or coordinate based
Three vector objects exist—points, lines, polygons; these
are called “features.”
They are represented by X,Y coordinates
sometimes Z (3D), sometimes M (linear reference)
Information about features is (are) called “attributes.”
Two types of vector models—topological and object
Topological means the data models stores relationships
between vectors
Vector objects exist independent of any other nearby
features
16. FAMILIES OF GIS DATA
Raster mode or grid cell
Entire study area is covered by a grid
Each cell within grid is given a value
Values can be integer or decimal
Data can be discrete or continuous
Cell size is variable and linked to the file size of the
raster data
Areas outside of the grid are ignored
Grid must be expanded if those areas are to be
included
21. ADVANTAGES OF VECTOR
• Vector data make maps that look more like maps
we are use to seeing on paper.
• The shapes of features are accurately
represented.
• Vector data can have topology
• Vector data is good for managing attributes
• Vector data has smaller storage requirement
– Only the objects need to be represented in the
database (empty space in-between is not captured)
22. DISADVANTAGES OF VECTOR
• Complicated data structure
• Software must manage many data tables
• Not good at representing geographic features
that gradually change over location
– For example elevation or moisture in soil
• Slower processing time
23. ADVANTAGES OF
RASTER
• Good at depicting continuously changing
surfaces such as elevation or soil moisture
• Grid format is simple data structure
• Easier for computer to make analytical
calculations
• Ideal for utilizing remote sensing images
24. DISADVANTAGES OF RASTER
• Maps can be blocky looking (depending on
the size of the grid cells)
• Cells can only be coded for one attribute
when there may be more than one
attribute at each location
• Can have very large datasets (depending on
the size of the grid cell)
• Not topological: adjacency data structure
25. REMOTE
SENSING
• Remotely-Sensed data is one of the most important
sources of data for GIS.
• RS means - Acquiring data from a distance
• Usually uses electromagnetic energy
– sunlight, radar, laser
• Originally captured on photographic film
• Recent platforms utilize digital sensors
27. WHAT KINDS OF DEVICES
COLLECT THE DATA?
• Aircraft
– High altitude
– Low altitude
• Spacecraft:
– Landsat
– SPOT
– Weather satellites
– GeoEye-1
Geosynchronous Orbit
when the satellite moves at
the same speed as the
spinning earth – results in the
camera staying over the same
spot of the earth
29. DIGITAL ORTHOGRAPHIC
PHOTOS
• Digital photos of the earth
• Usually acquired by aircraft
• Orthographic means that the photo has all distortion
removed
– A regular photo from an airplane will have distortion due to:
• Parallax – effect that distance away from the center point of a photo
will always have distortion
• Terrain – the hills and valleys or a land area will cause distortion in the
photo
– An orthographic photo is adjusted by computer software to
make the image line up with a flat map
32. REMOTE SENSING
MEDIUMS
• Black and White or “Panchromatic”
– Sensitive to visible light
• True Color
– Similar to color film
• Infrared
– Sensitive to infrared frequencies that can’t be seen by humans
– Developed by military for identifying tanks painted with camouflage
– Good for evaluating conditions of vegetation
– Good for evaluating moisture in soil
• False-color adjusted
– When frequencies of received data are shifted to allow or enhanced human viewing
• Multi spectral
– When more than a single “band” of energy is captured
– Color is multi-spectral (3 bands)
– Some satellites can have 7 or even more “bands” of sensitivity
34. THE VISIBLE
SPECTRUM
• The visible spectrum is only
a tiny window
• We are blind to 99.99% of
the energy in the universe
• We have created devices
that allow us to see beyond
the range of human vision
36. WHAT ARE THE SPATIAL UNITS FOR
WHICH DATA ARE
COLLECTED?
• Pixel or Picture Element
– Smallest unit of data collection
– Features smaller than the pixel size can’t be distinguished
• Pixel Sizes
– Landsat MSS
– Landsat TM
= 79 meters
= 30 meters
– SPOT
– IKONOS
– GeoEye-1
= 10 meters
= 1 meter
= 0.41 meters
39. TEMPORAL
RESOLUTION
• Remote sensing images begin to get old as soon
as they are taken.
• Satellites repeatedly circle the earth.
• Airplanes must be commissioned every time they
photograph (expensive).
• NJ aerial photography was taken 1995, 2002, and
2007. Statewide aerials often have to be taken in
multiple years. (95/97) (07/08)
• Turnaround is improving: NearMap’s 2cm imagery
of Brisbane floods released within 1 week.
•
40. WHAT IS GIS?
• Now that we’ve learned the essential elements
that make up a GIS…
• …and have seen examples of how GIS is being
used…
• …let’s take a look at the big picture.
42. HOW IS GIS
USED?
• Sometimes, the best way to learn about GIS is to
see how it’s being used…..
– Science
– Emergency management
– Government record-keeping
– Business location
– Environmental management
– Planning
– Crime mapping
44. VIOLENCE IN
DARFUR
• Image shows 2004 &
2006.
• Area too large and
dangerous for small
peacekeeping force.
• Violence tracked using
satellite images.
• Article.
45. CALIFORNIA
WILDFIRES
• LA Times and local
residents are mapping
the spread of major
wildfires.
• Using web-based GIS to
present and catalog
data.
• Article.
46. GEOCOMMONS
• GeoCommons is a "mashup" maker
• Upload your data – excel or GIS and have it
mapped
• Find data others have shared
• Make maps, then export to Google Earth
47. RESPONSE TO HAITIAN
EARTHQUAKE
• Users of OpenStreetMap volunteered time to
update the map around Port-au-Prince.
• CrisisCamp volunteers are adding features such
as camps, collapsed buildings & recovery efforts.
• How volunteers are using GIS to help in Haiti.