Downloaded 693 times


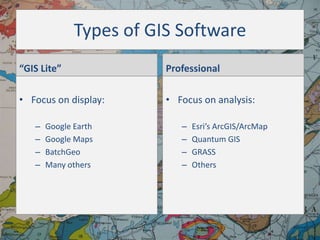


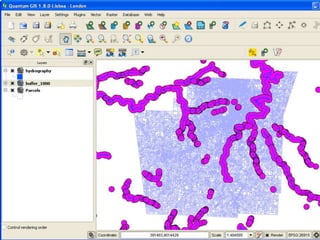


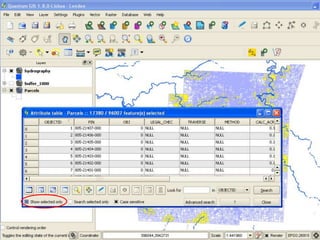
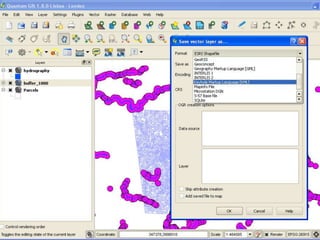

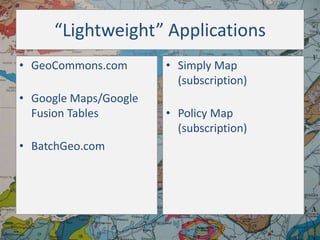


This document provides an overview of Geographic Information Systems (GIS), highlighting its capabilities in managing and analyzing spatial data through both vector and raster formats. It explains the uses of GIS in various applications such as conservation, vehicle routing, and demographic research, and lists sources of GIS data from federal, state, and local levels. The document also discusses different types of GIS software, including professional tools and lightweight applications, along with examples relevant for libraries.


![5G Explained! A High Level Overview [Introduction]](https://cdn.slidesharecdn.com/ss_thumbnails/5gexplainedahighleveloverview-260119165306-cc137a3e-thumbnail.jpg?width=640&height=640&fit=bounds)


